Posizionamento tattico mercato US — settori, livelli S&P, raccomandazioni peso
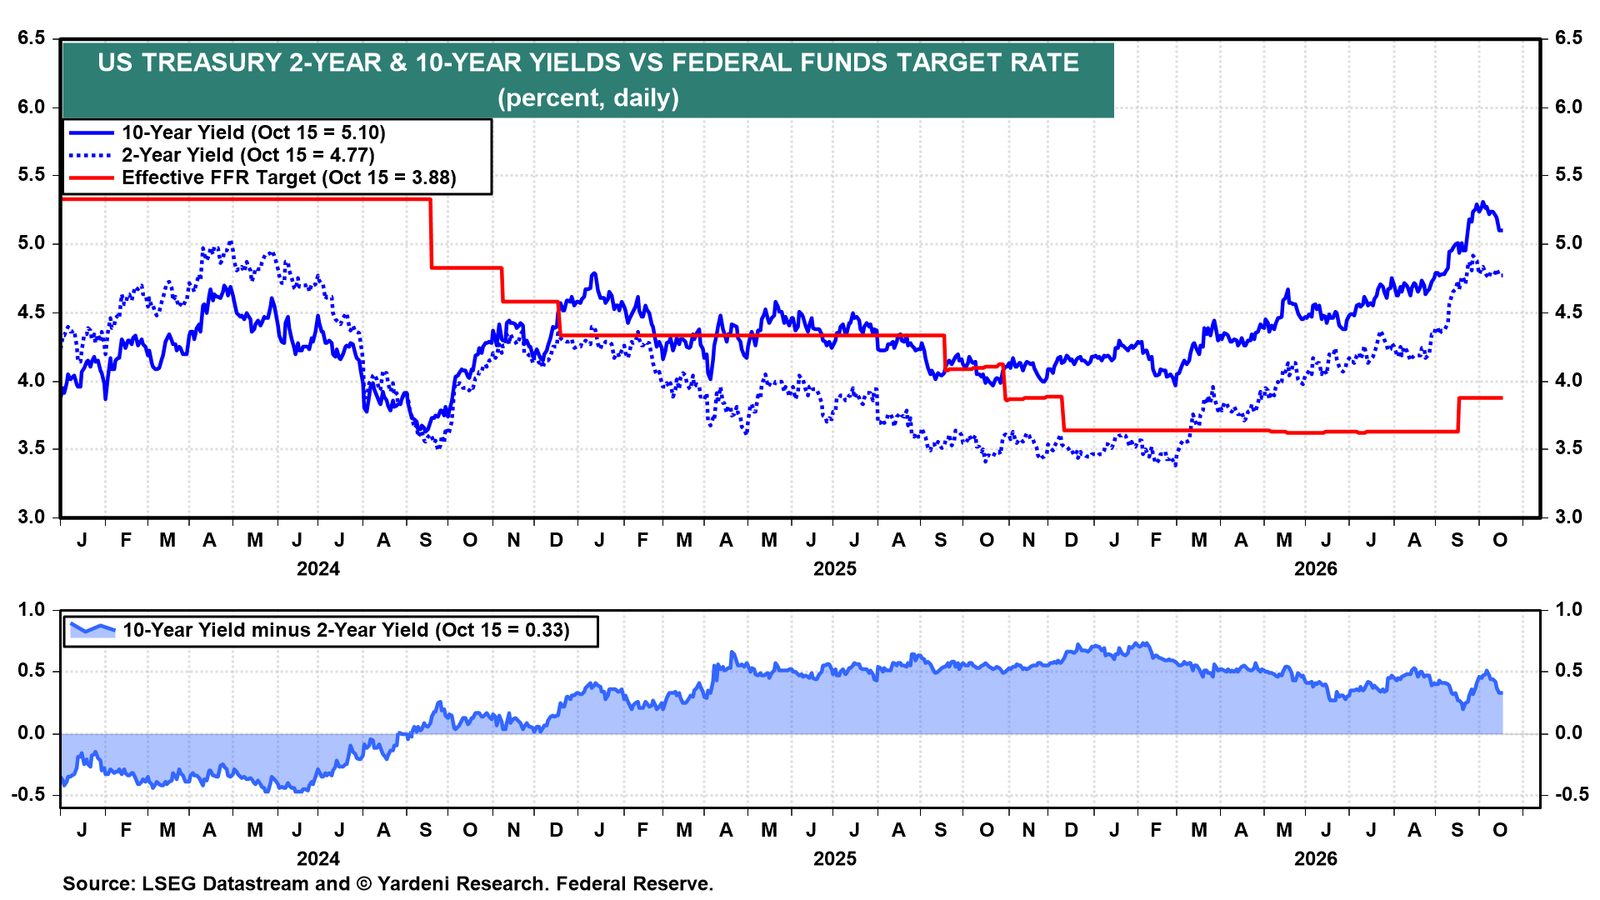
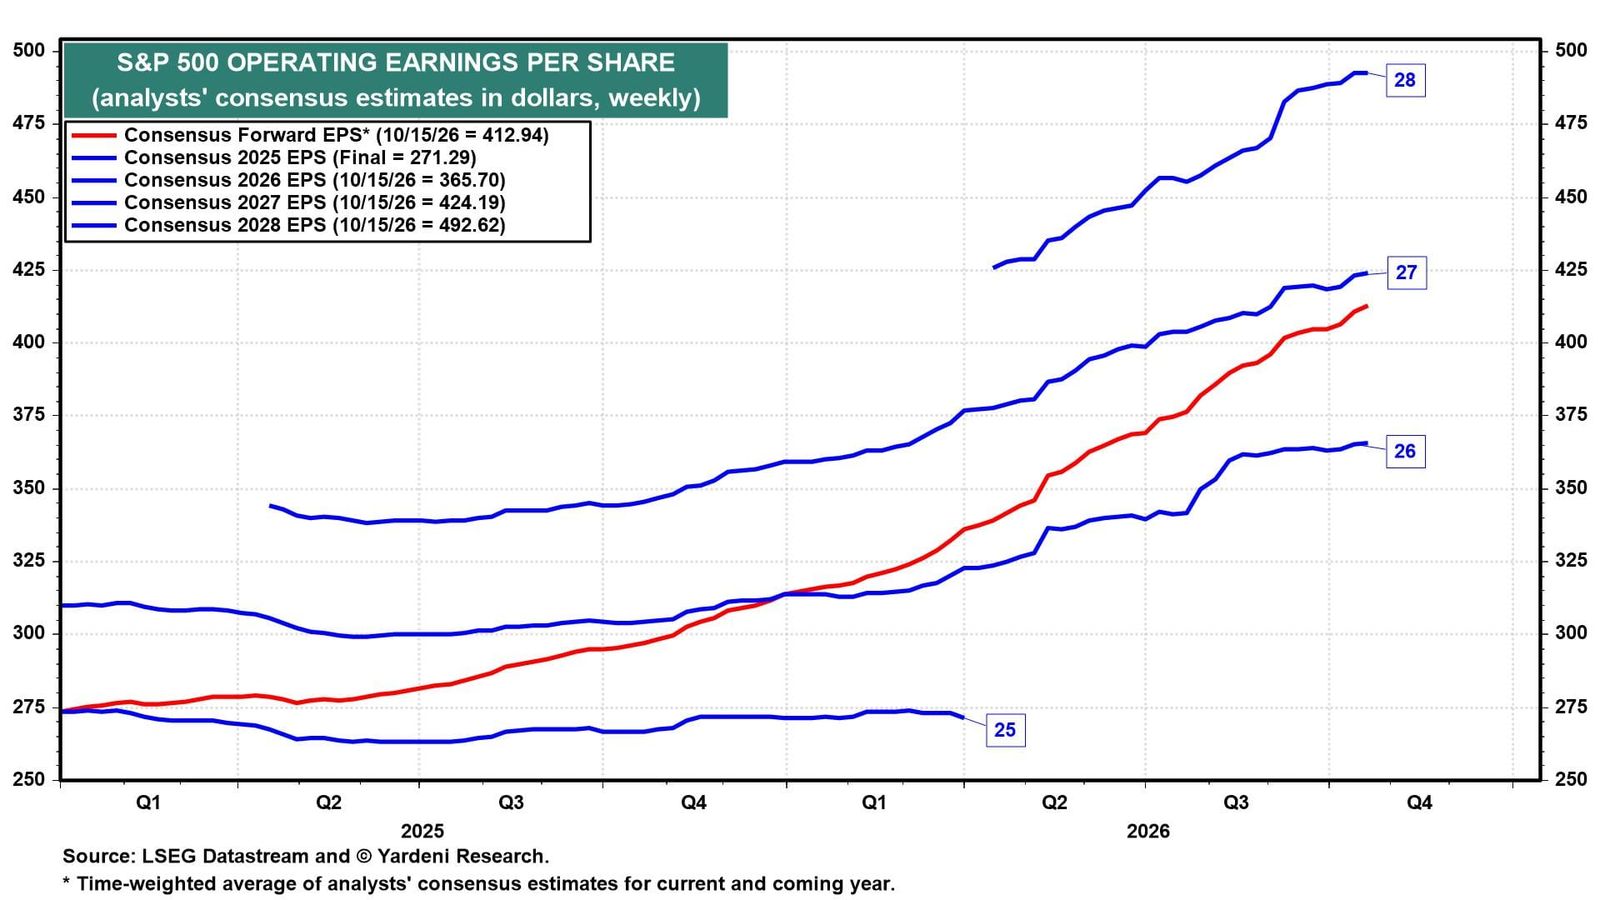
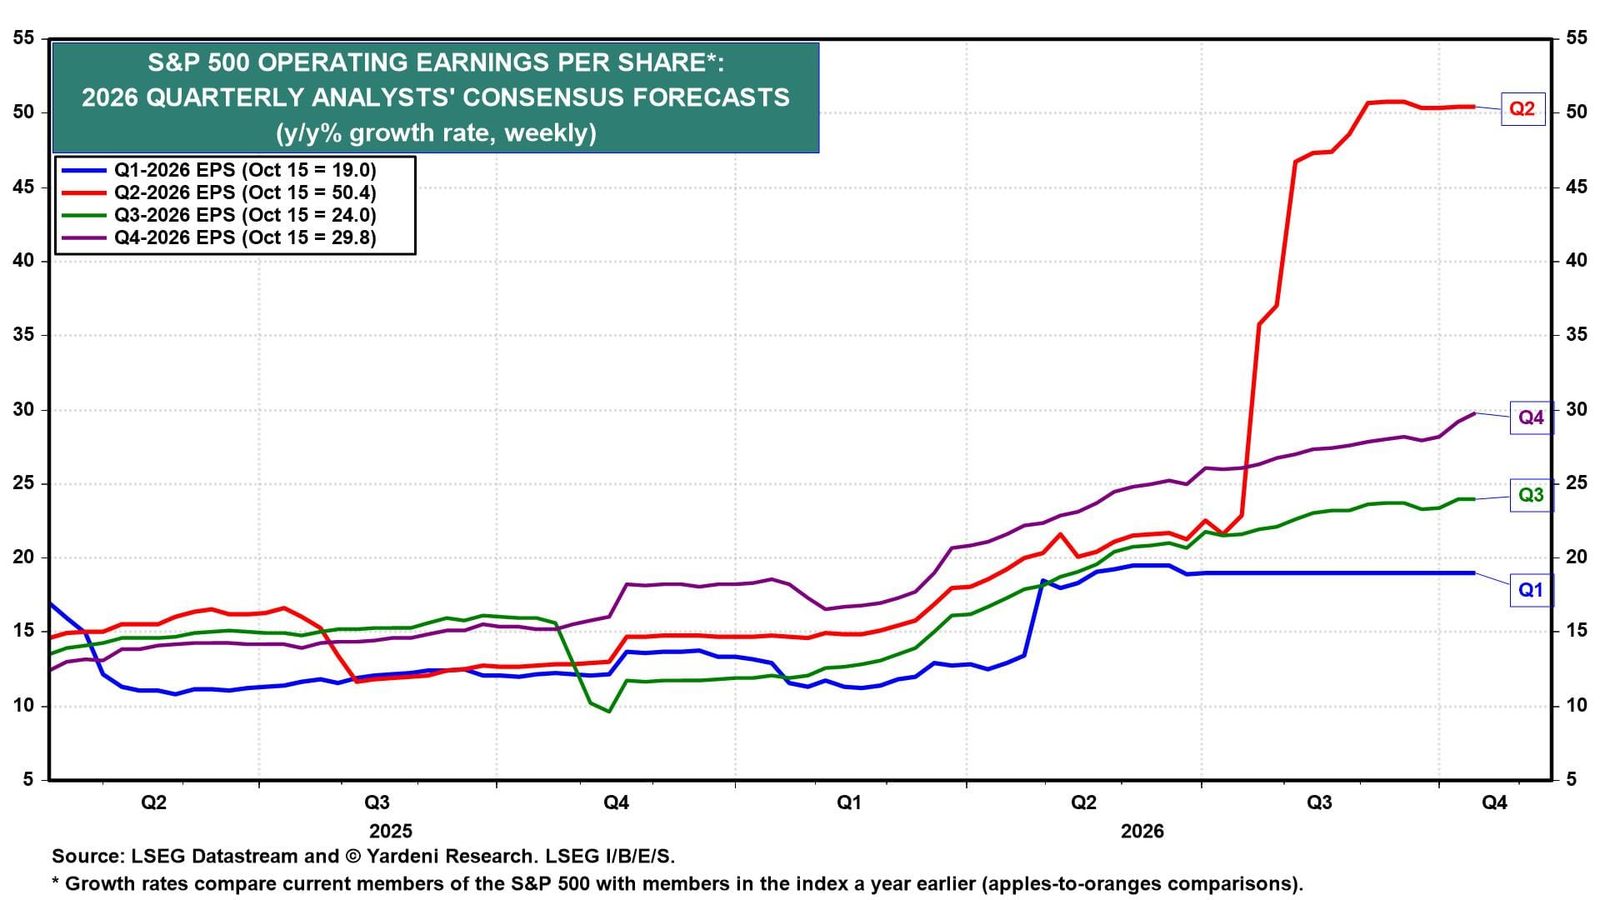
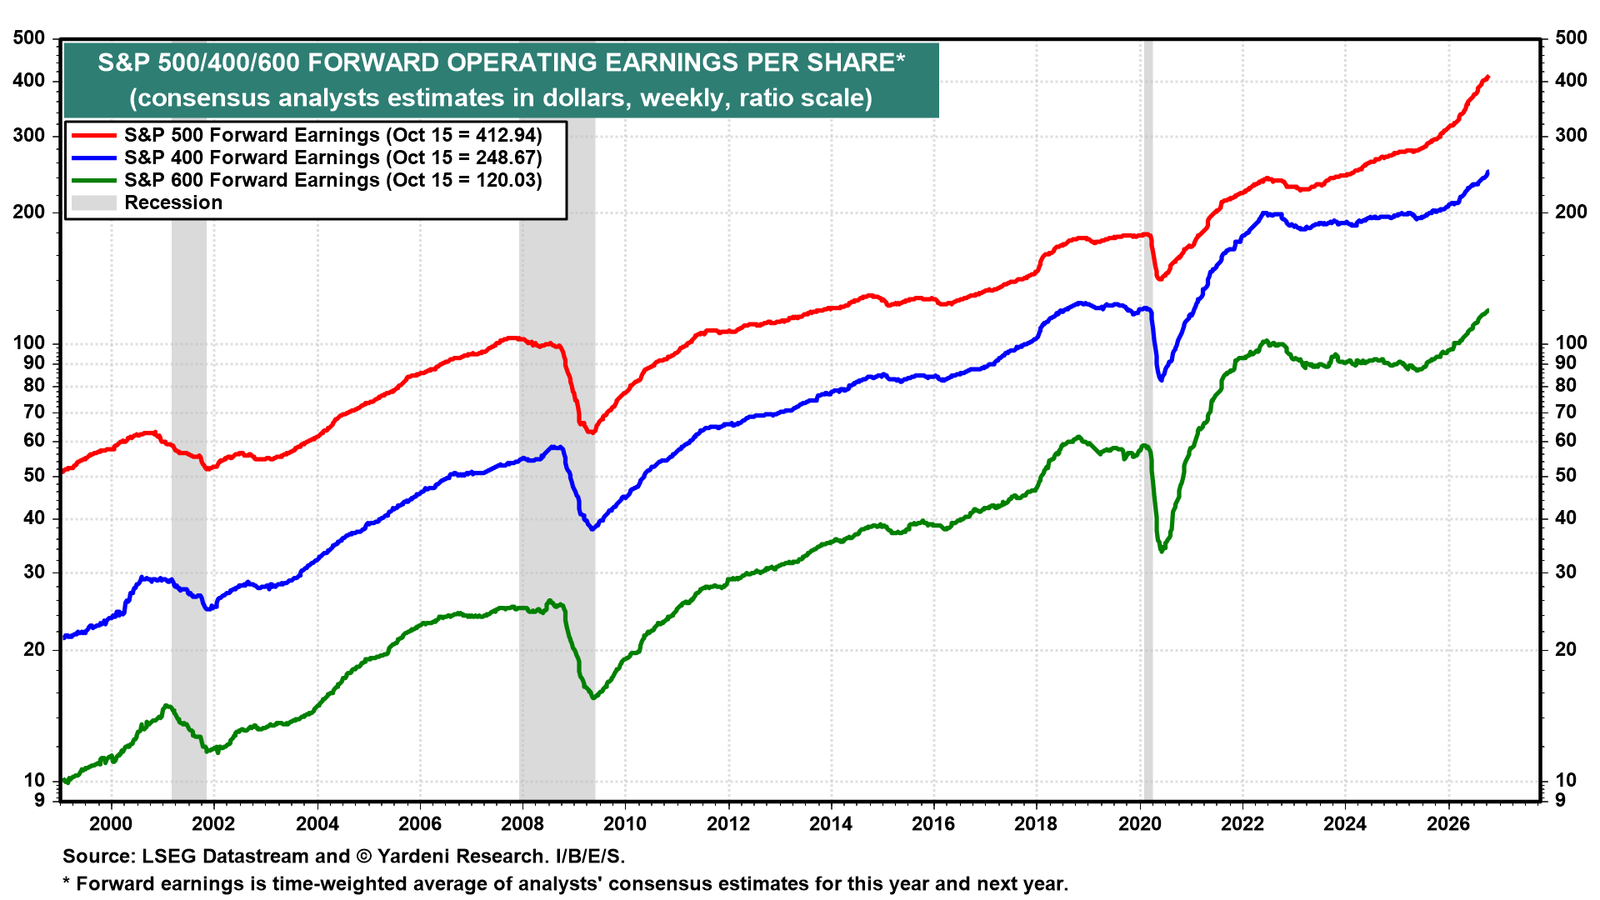
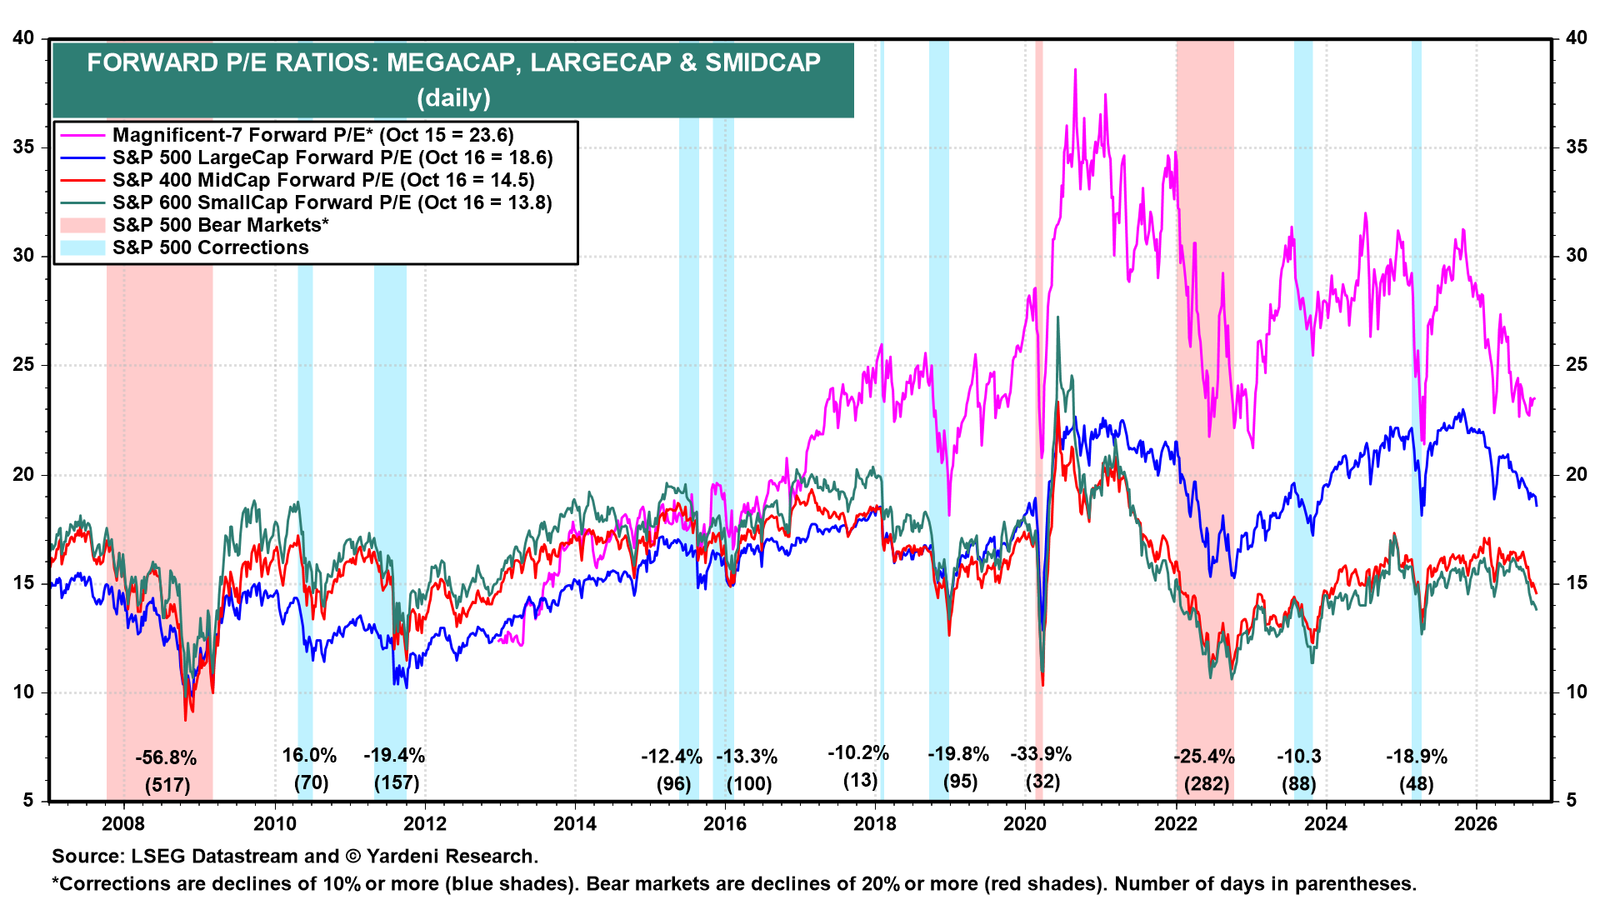
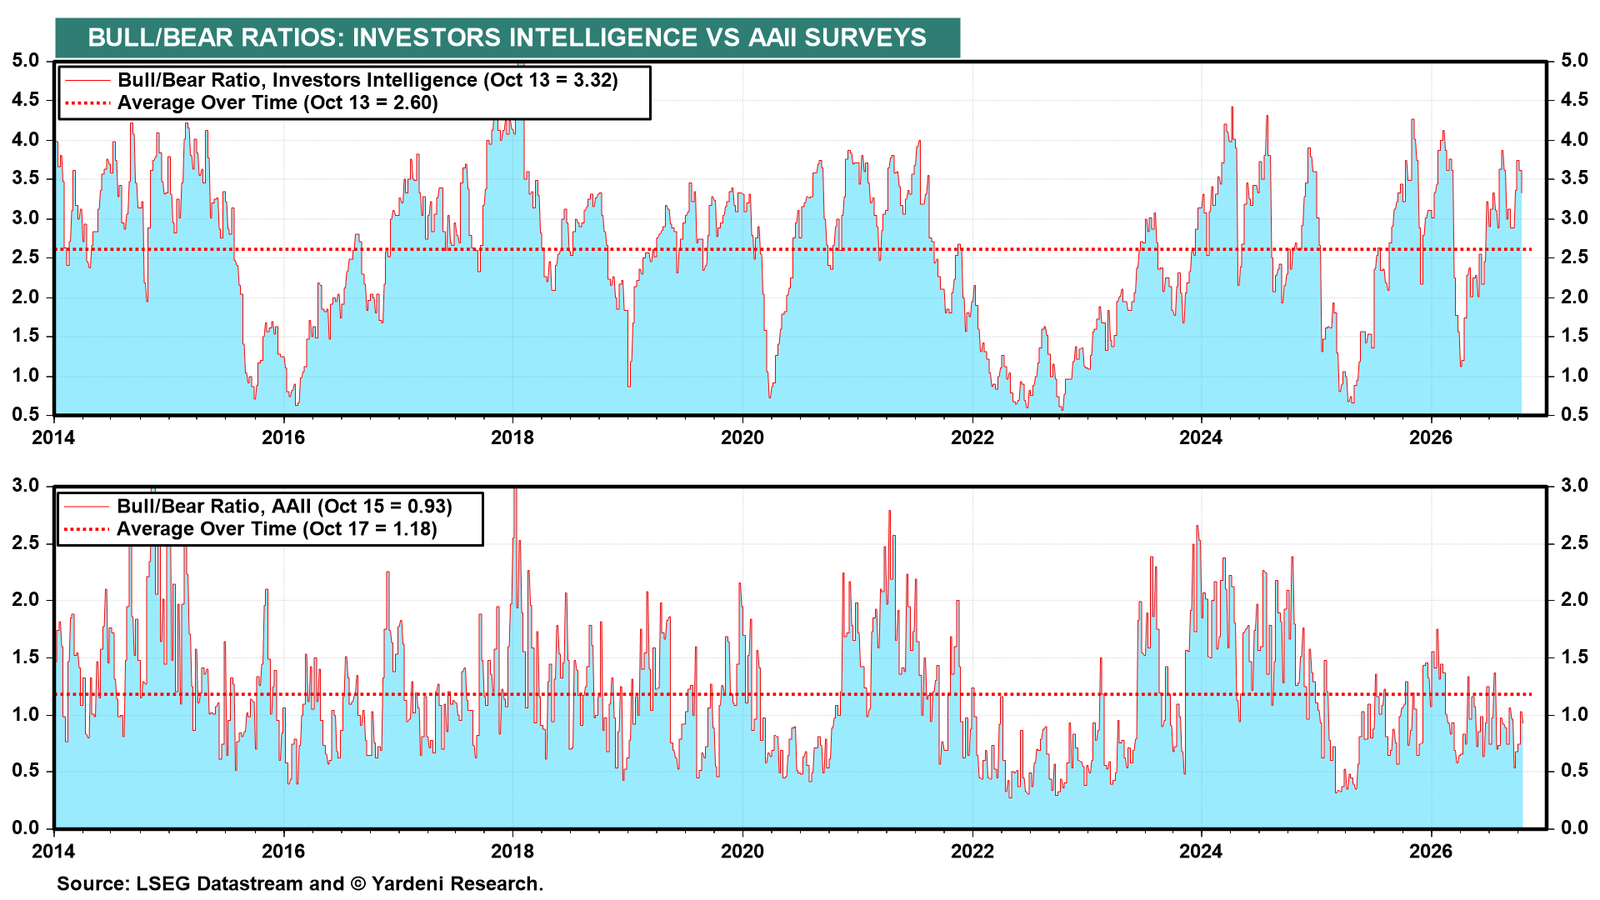
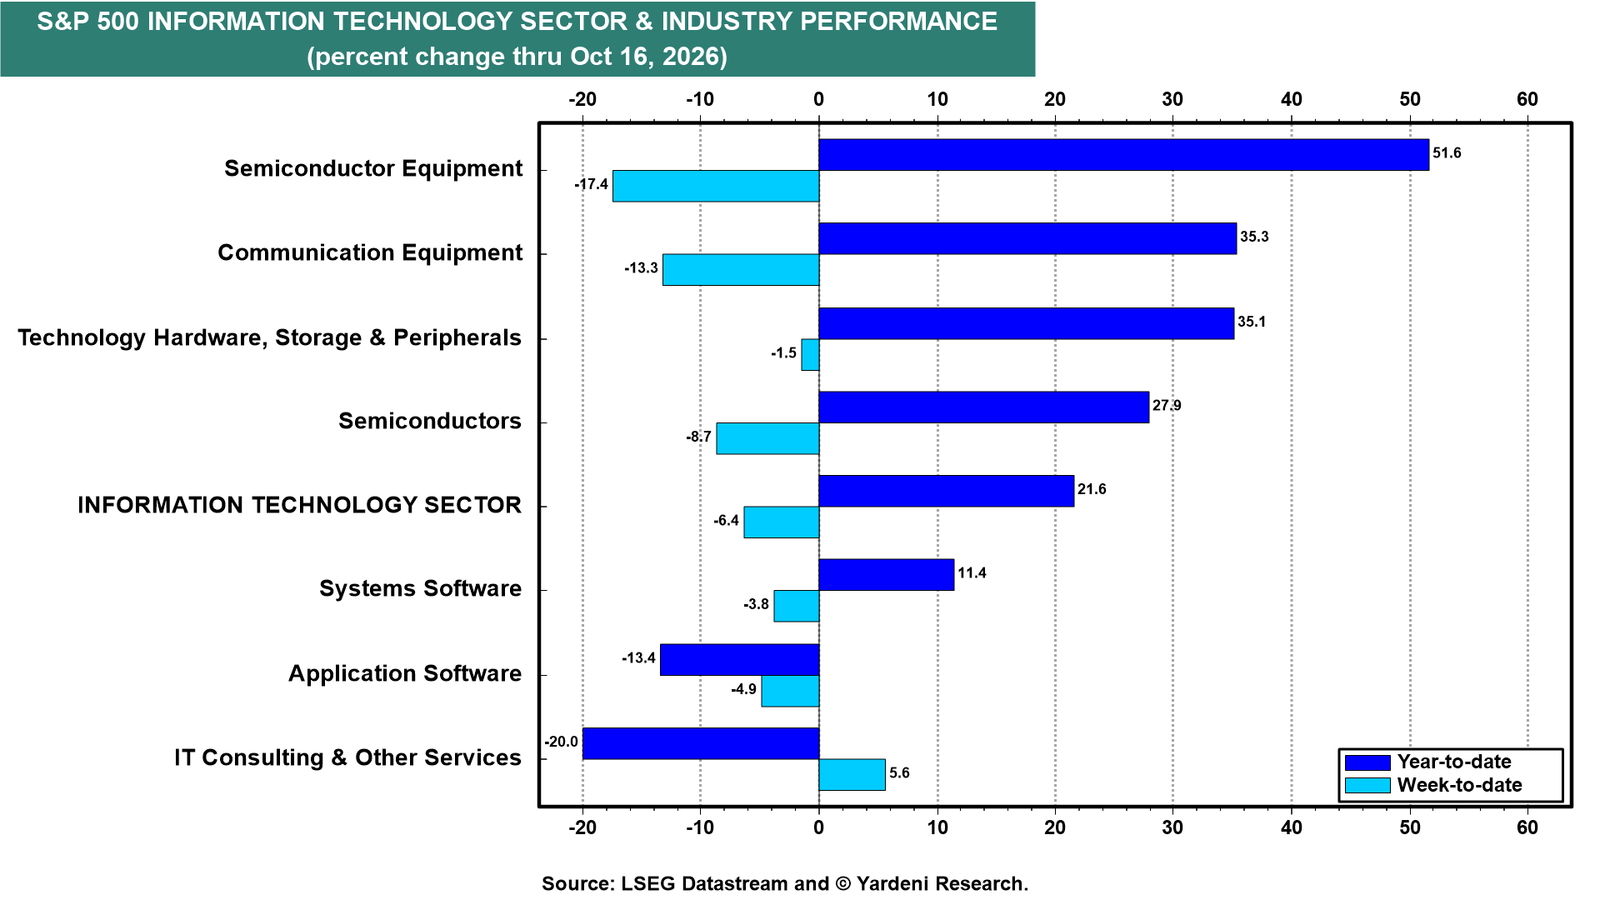
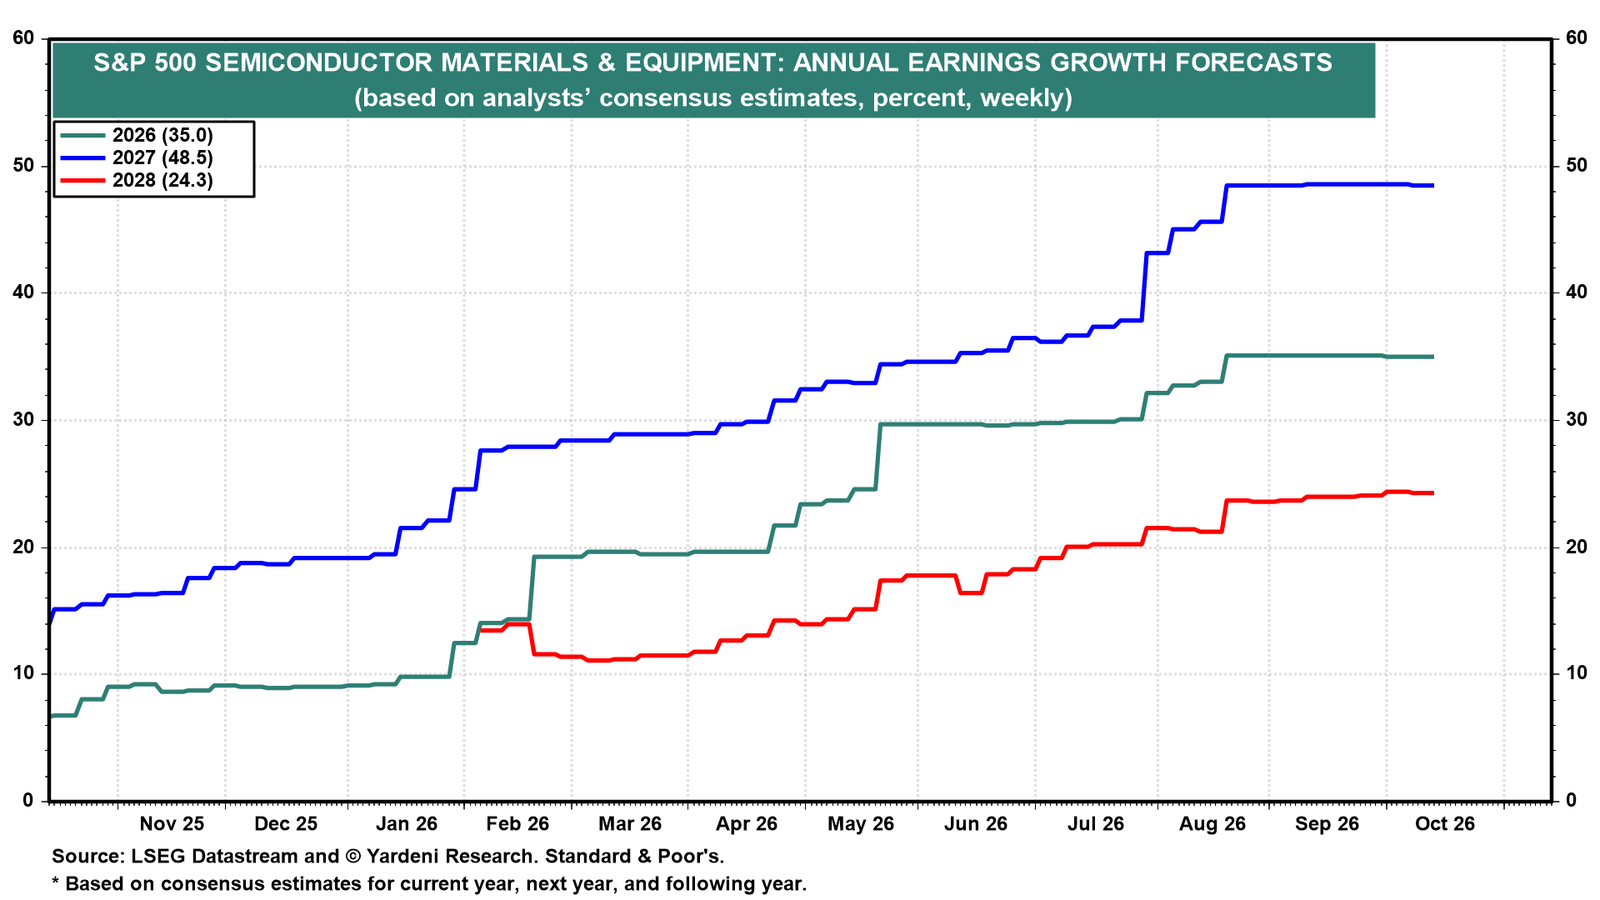
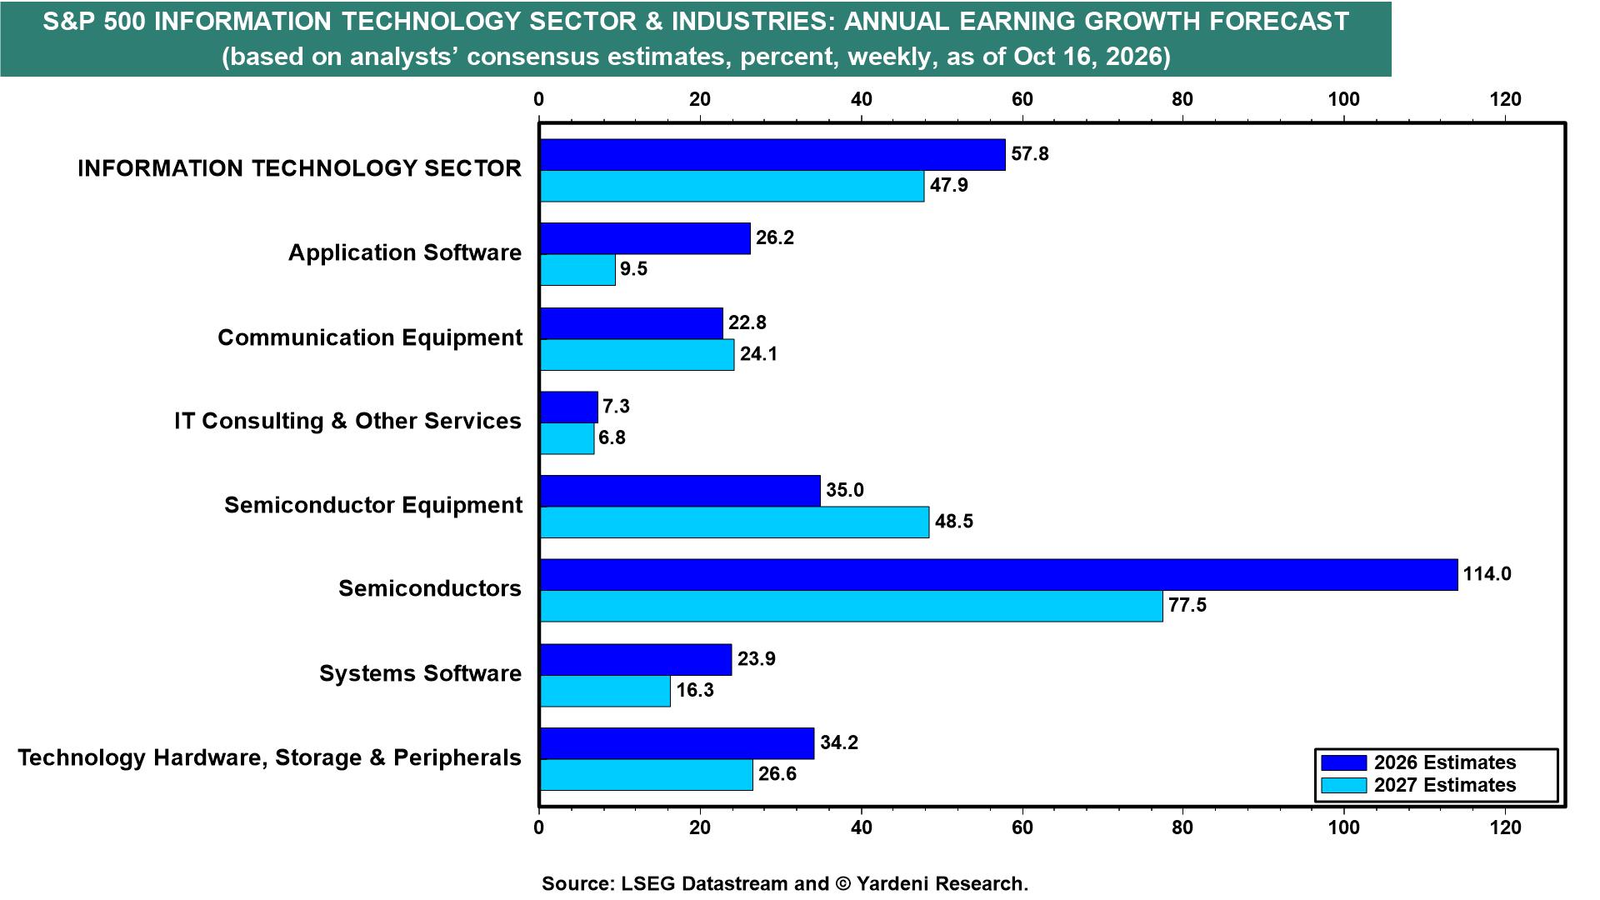
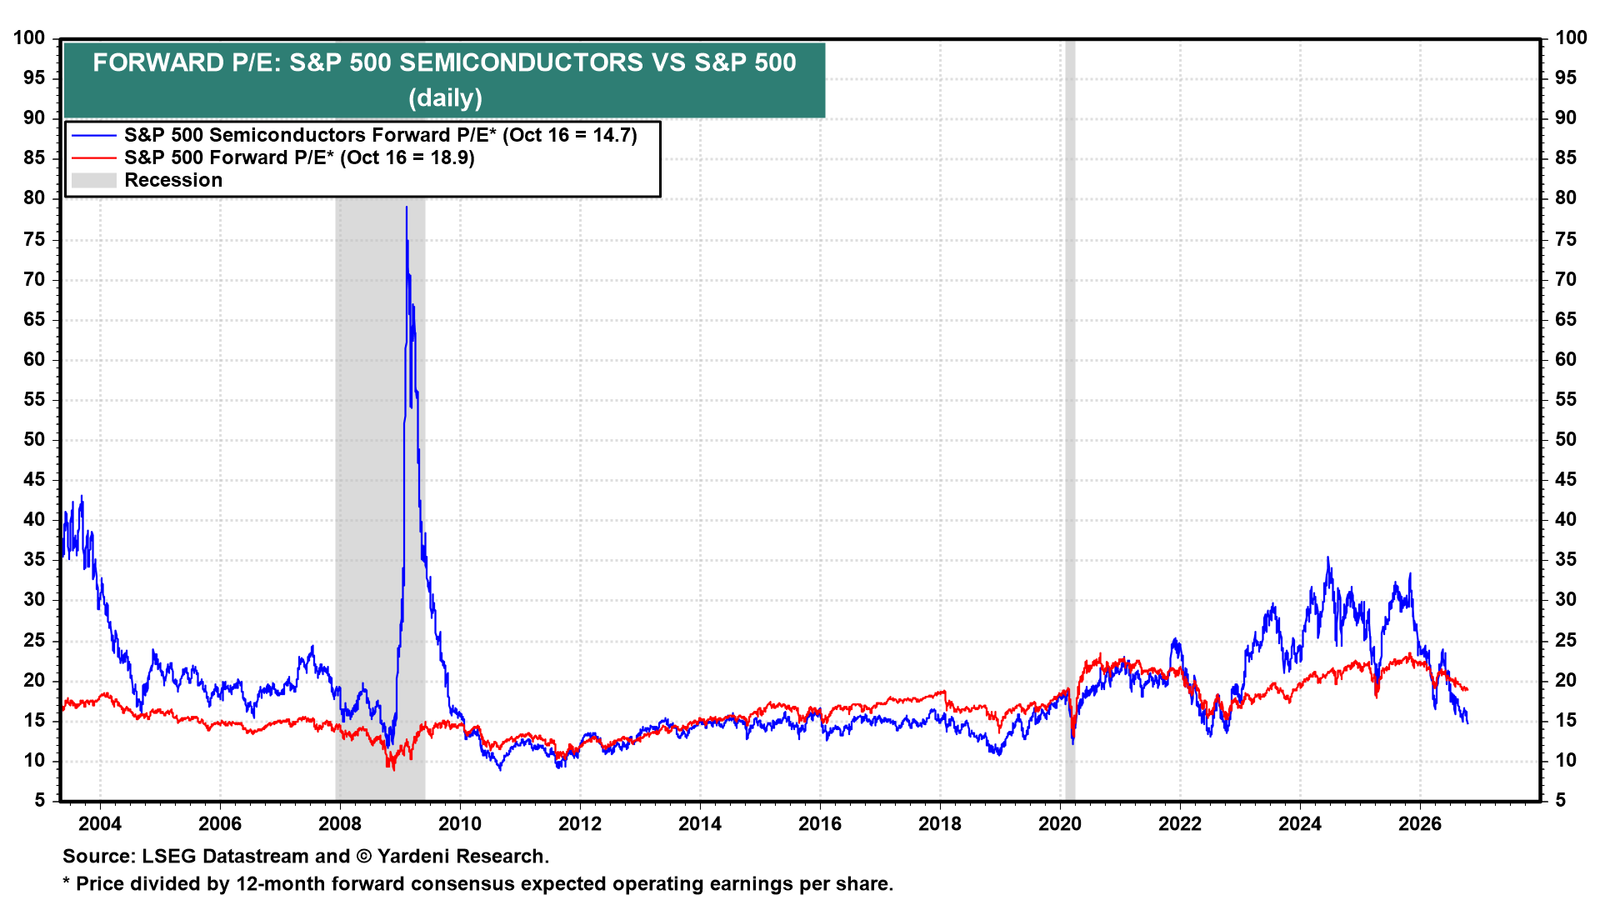
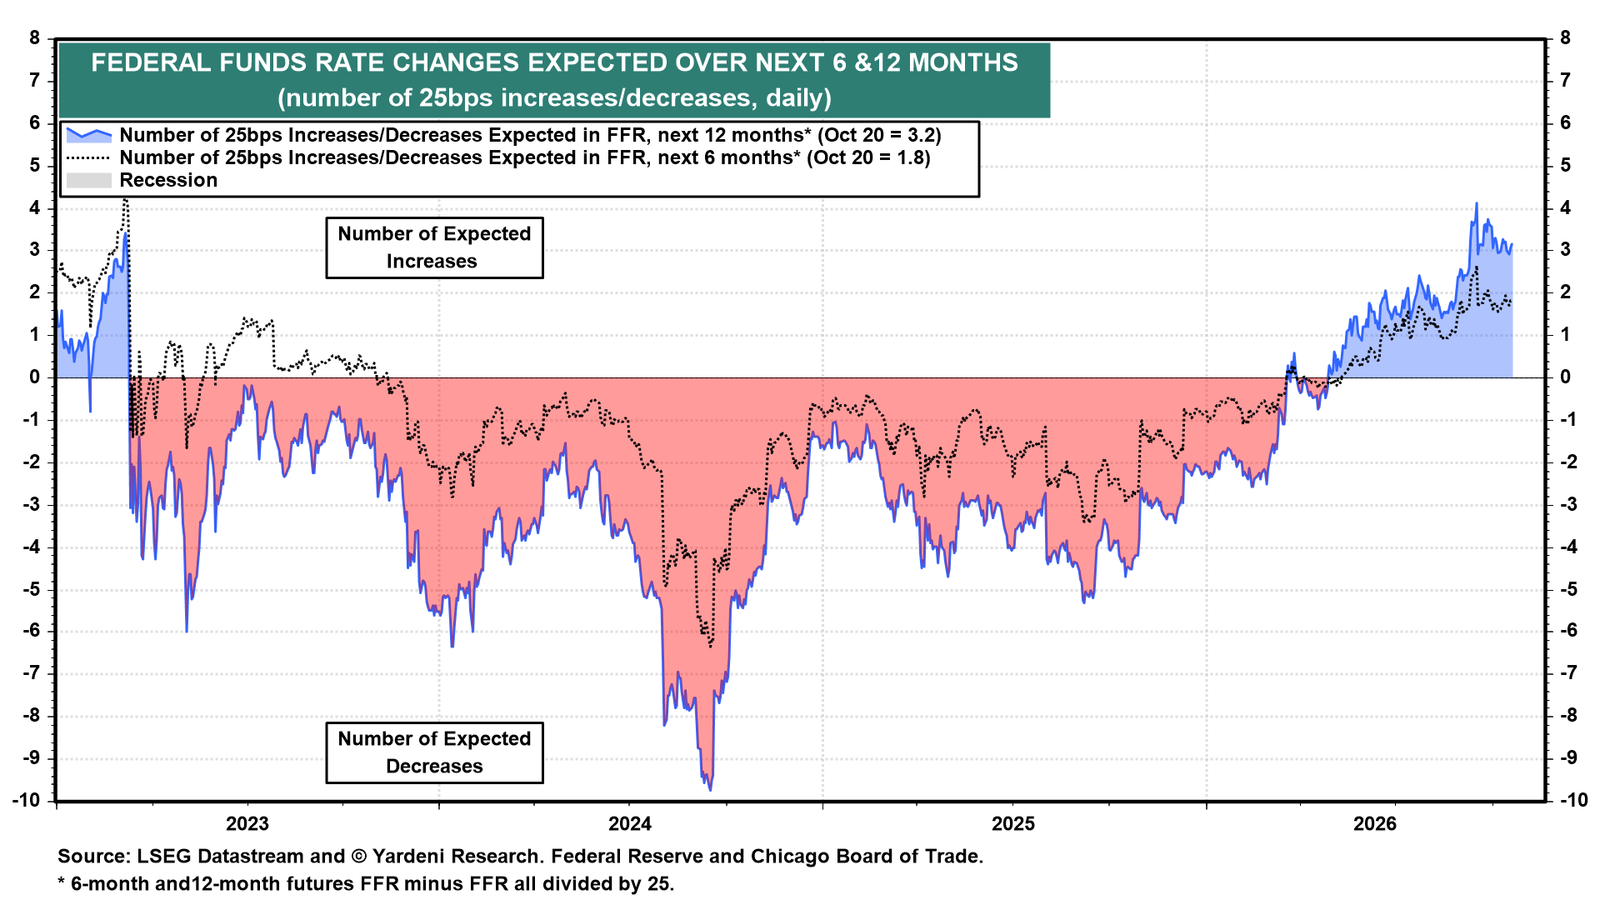
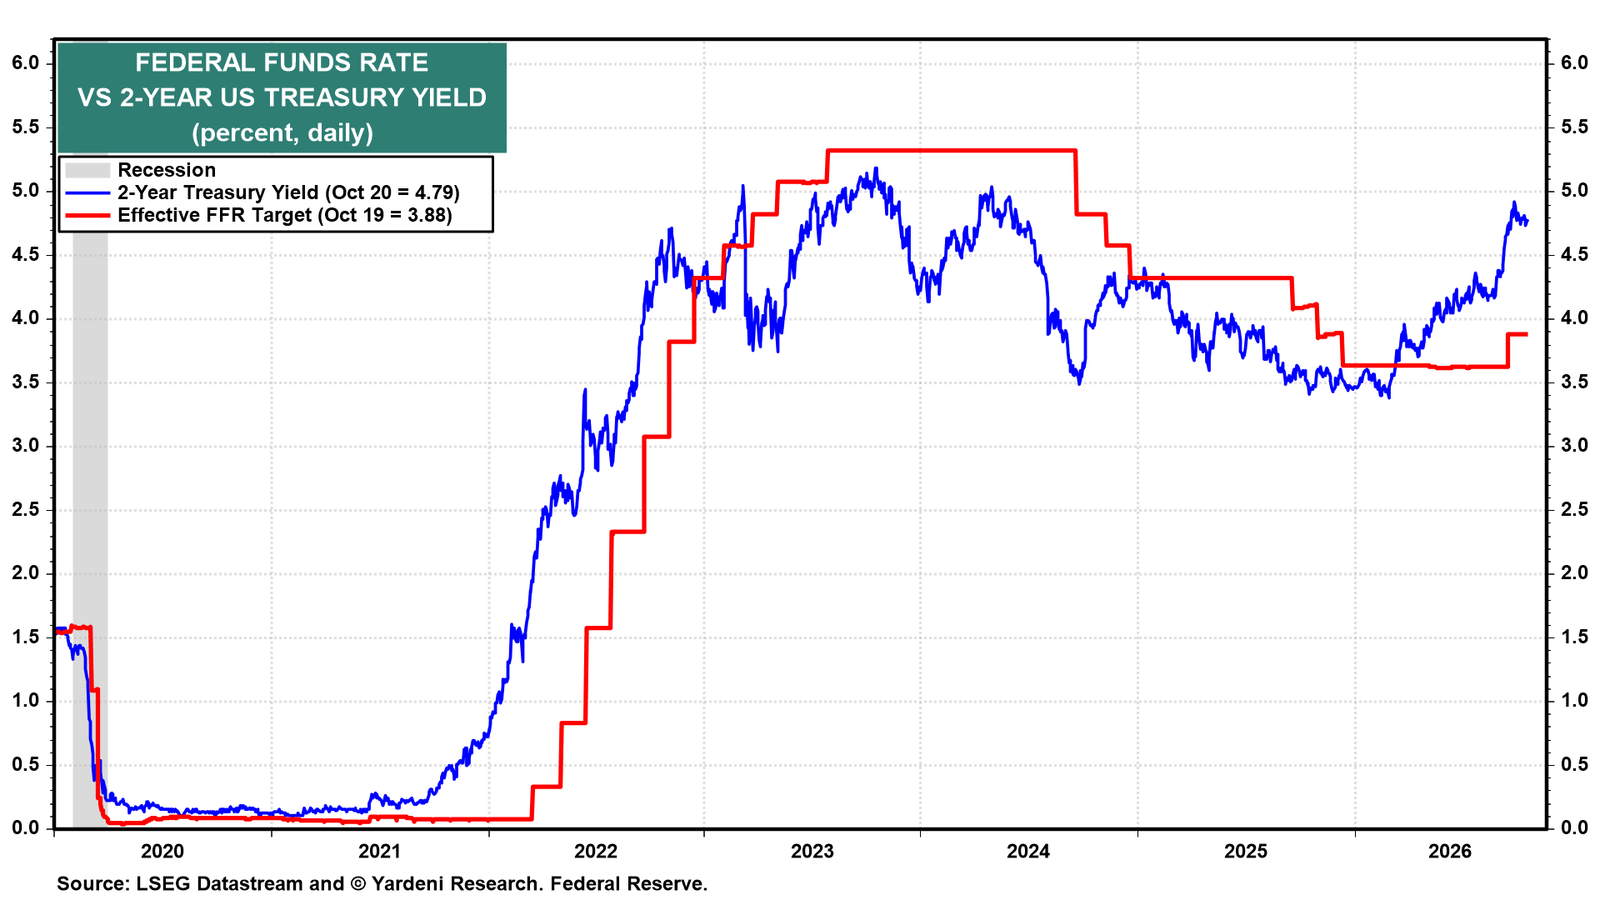
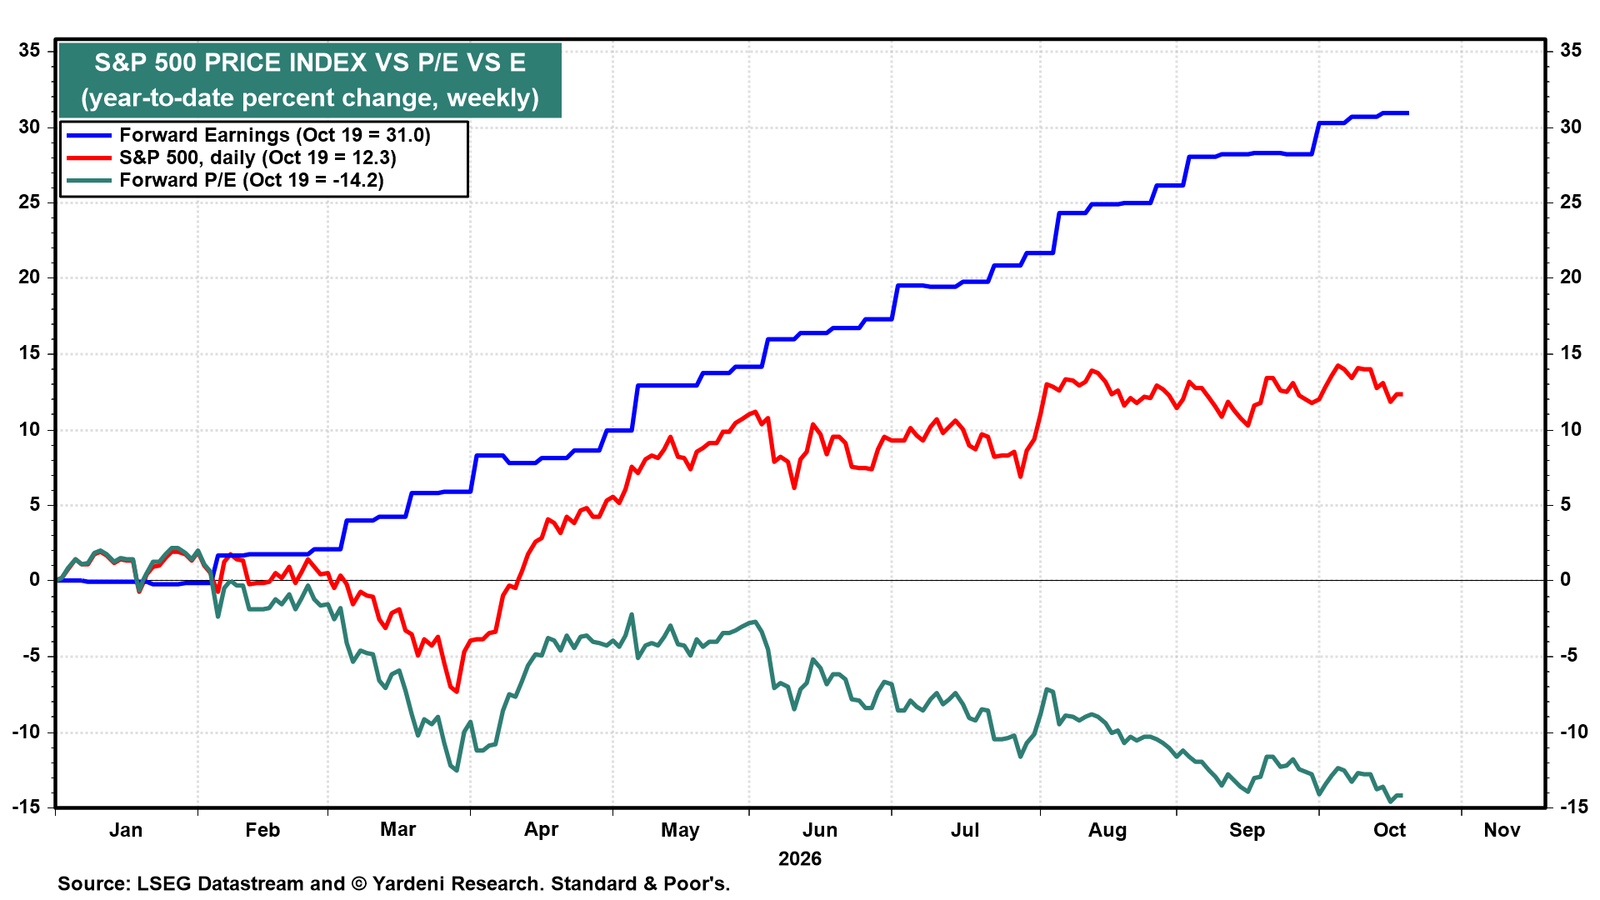
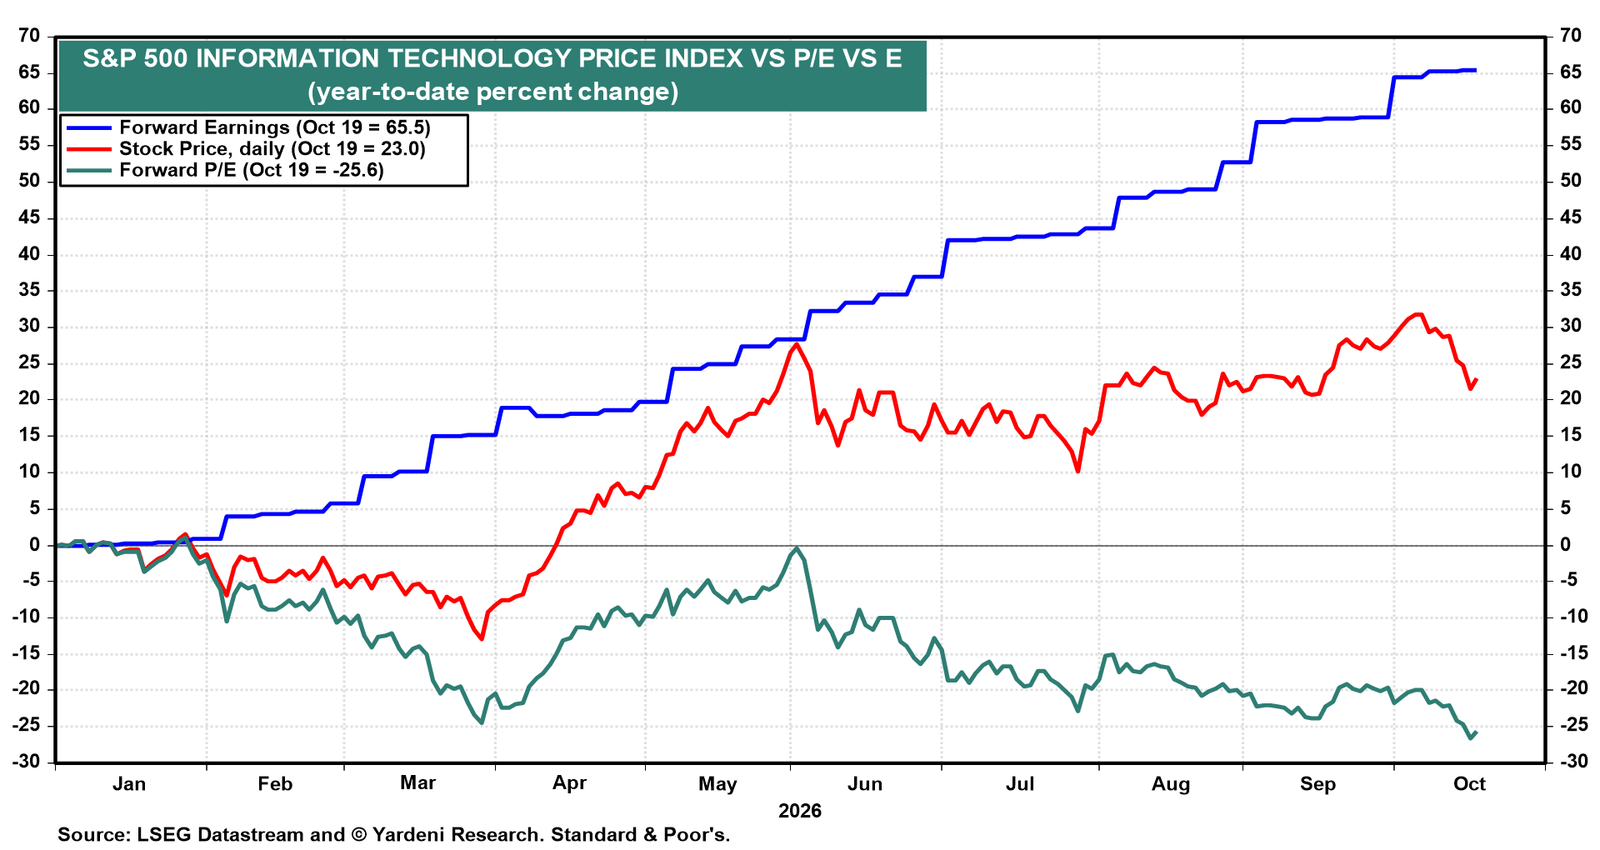
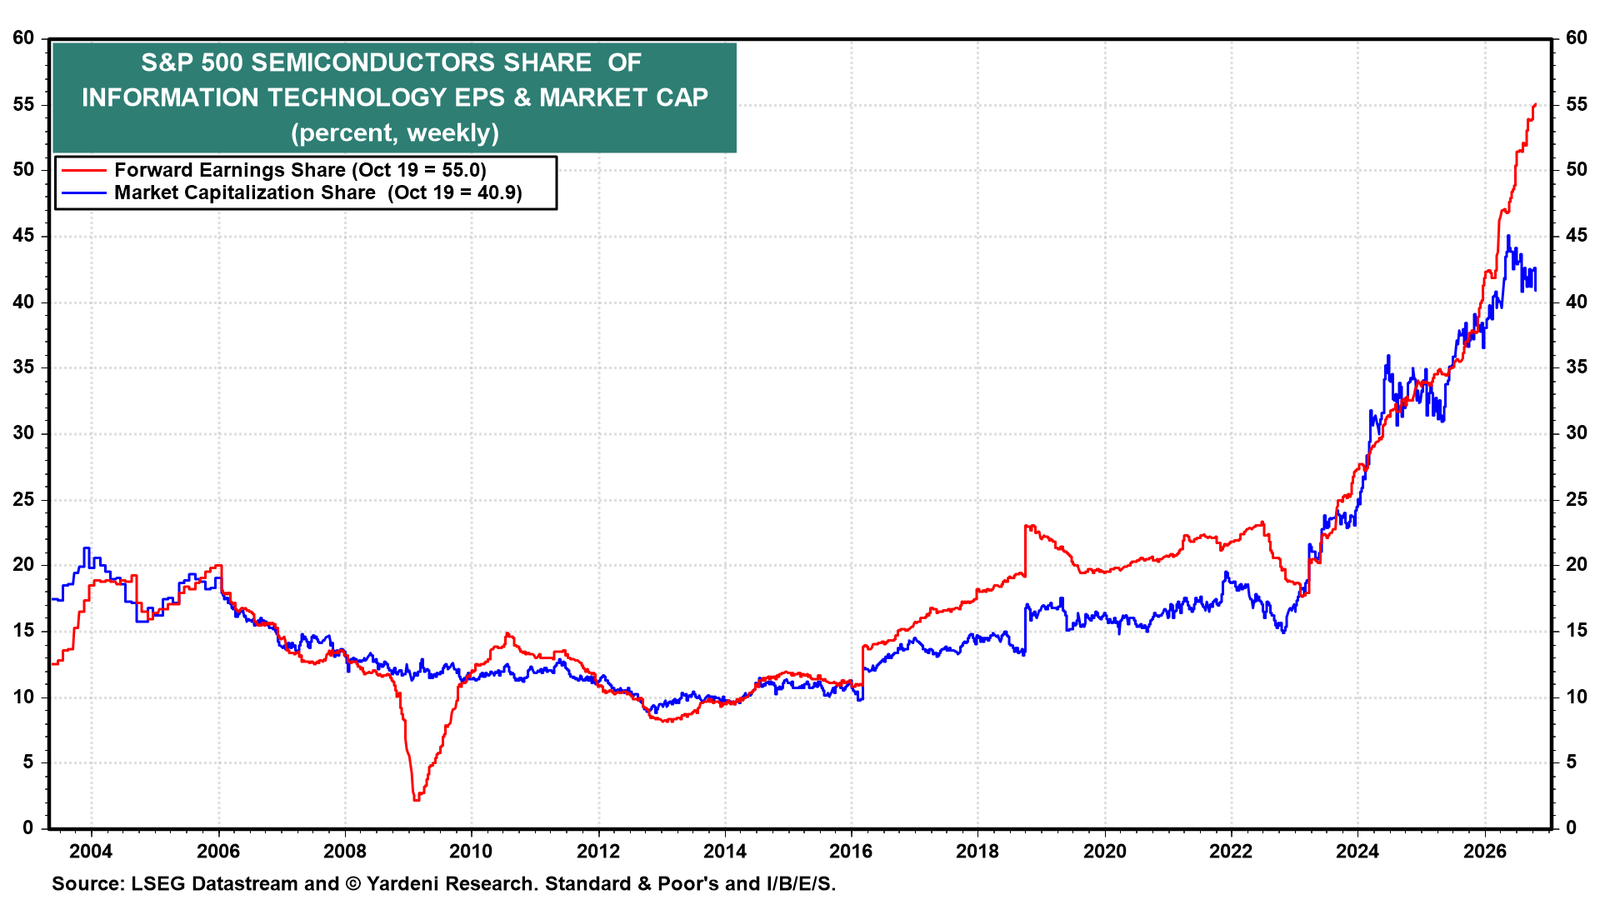
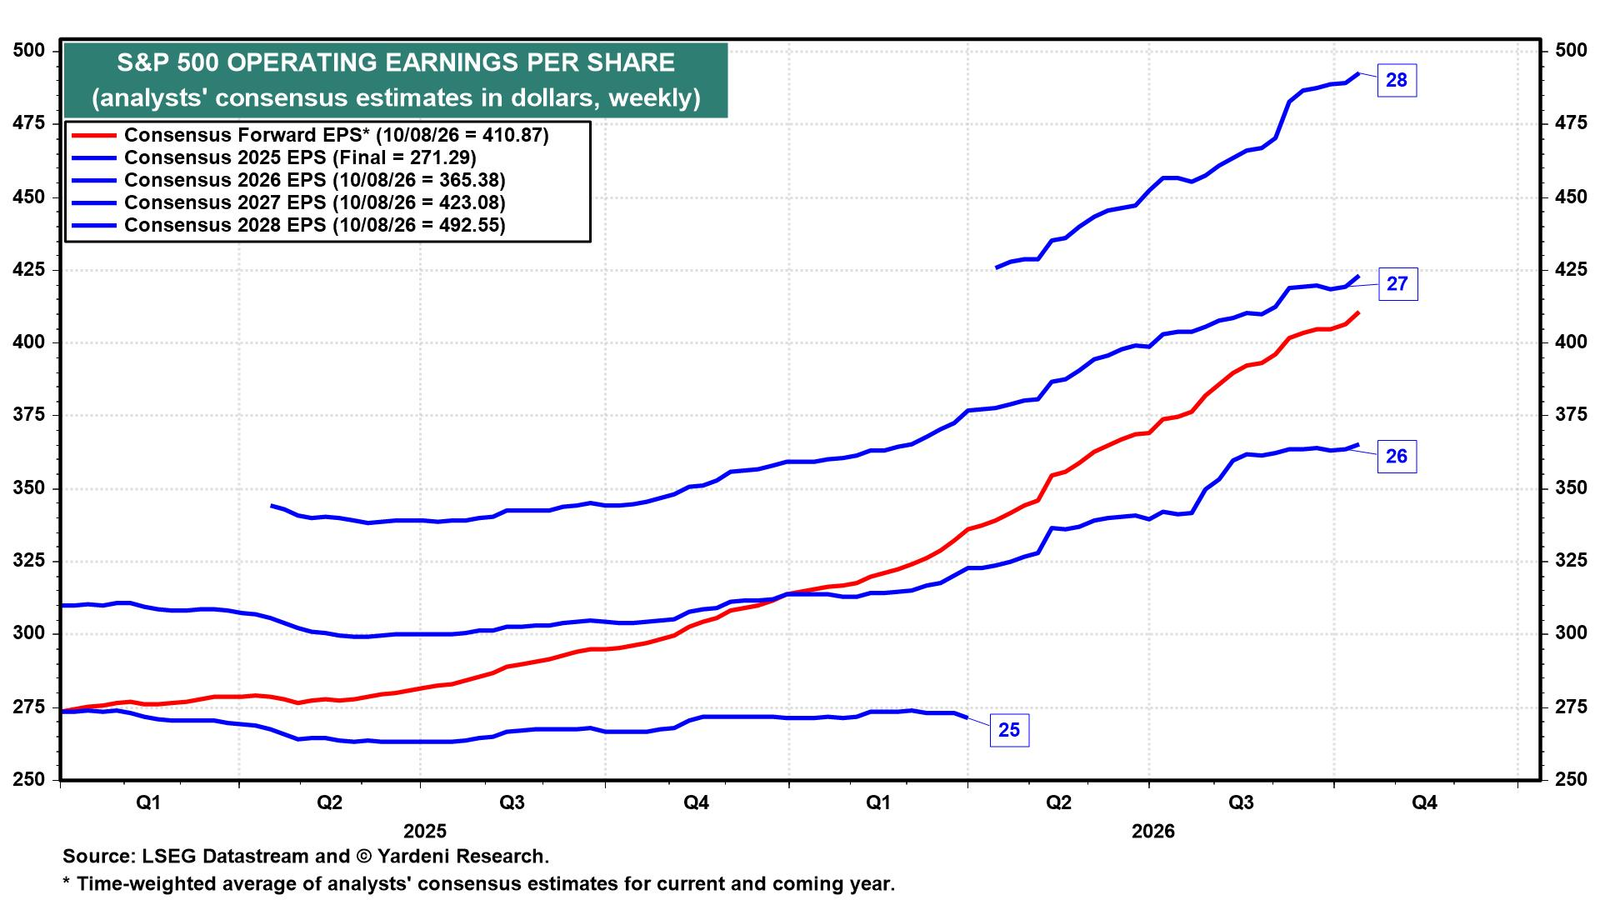
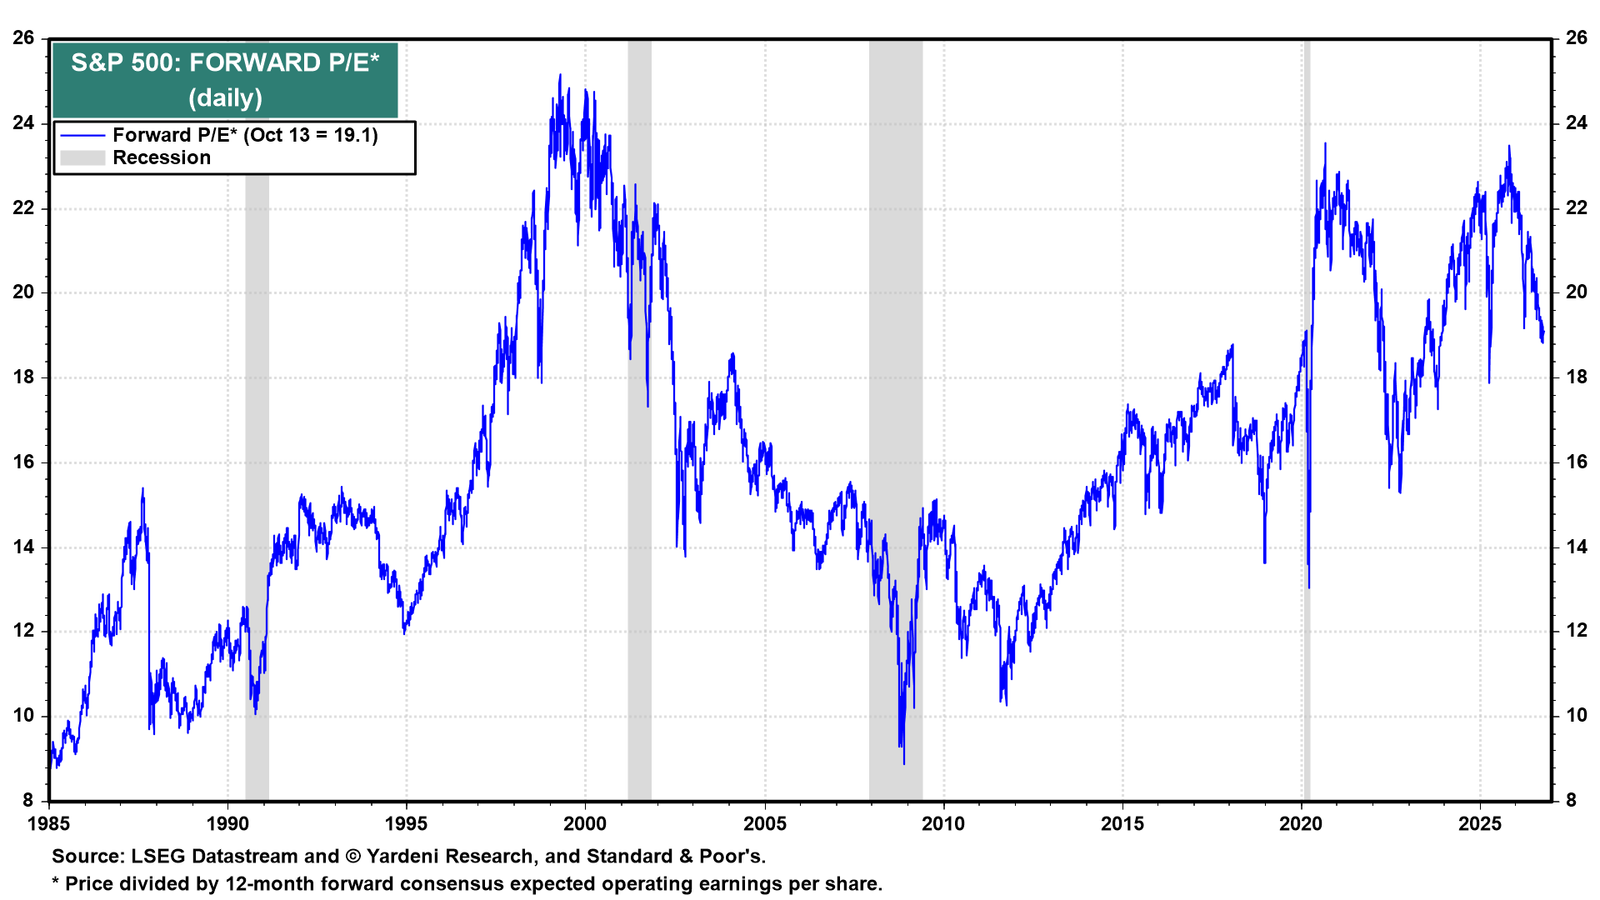
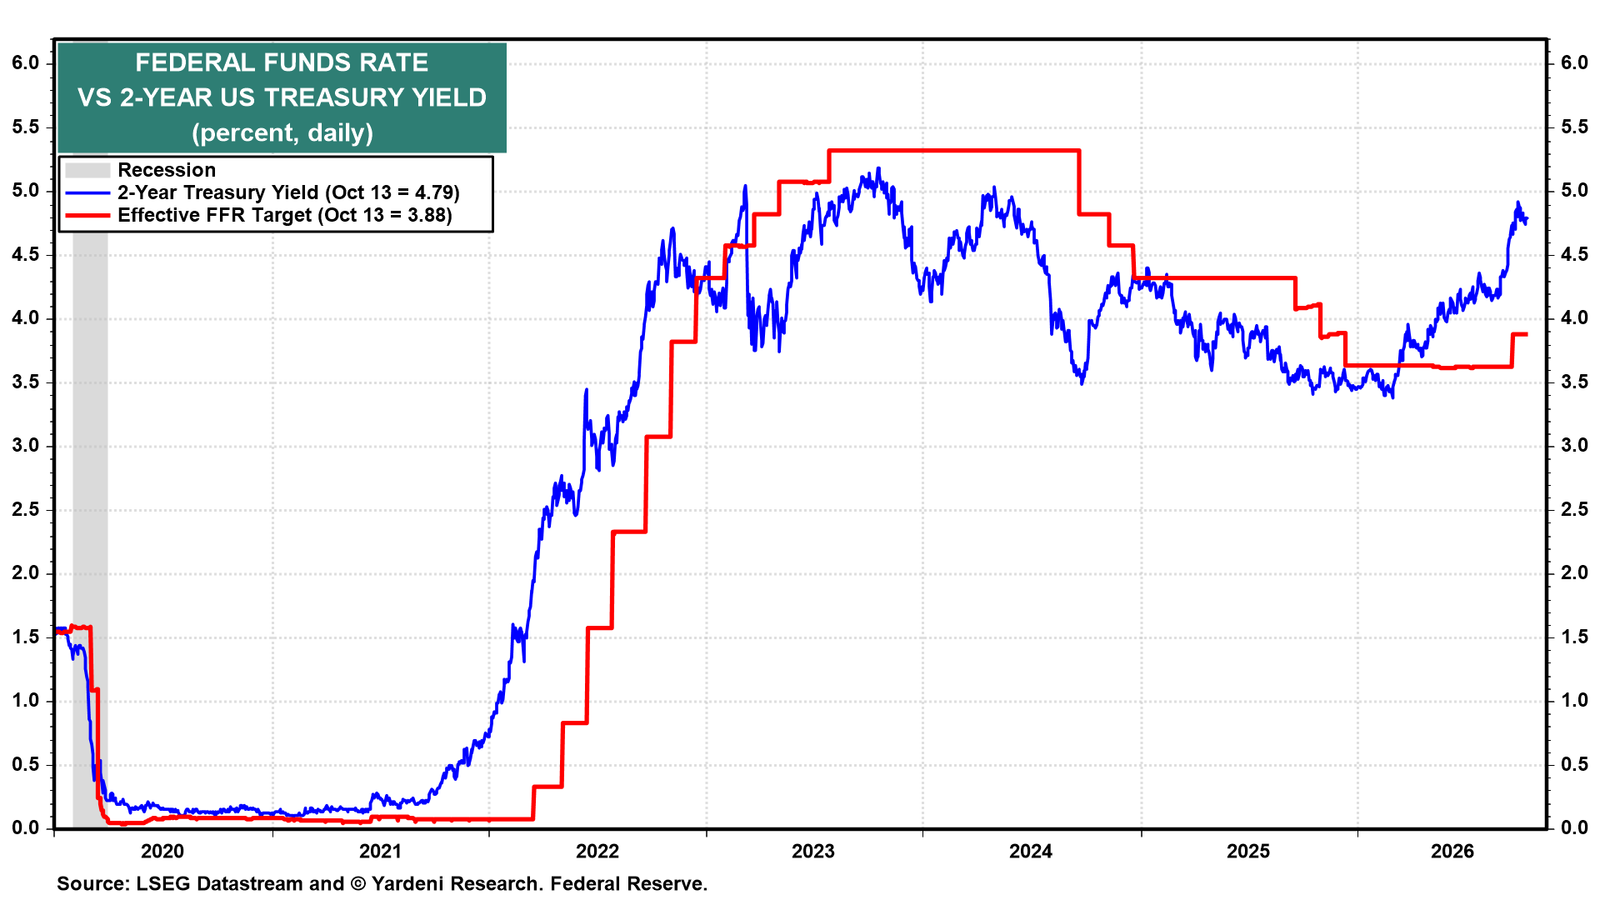
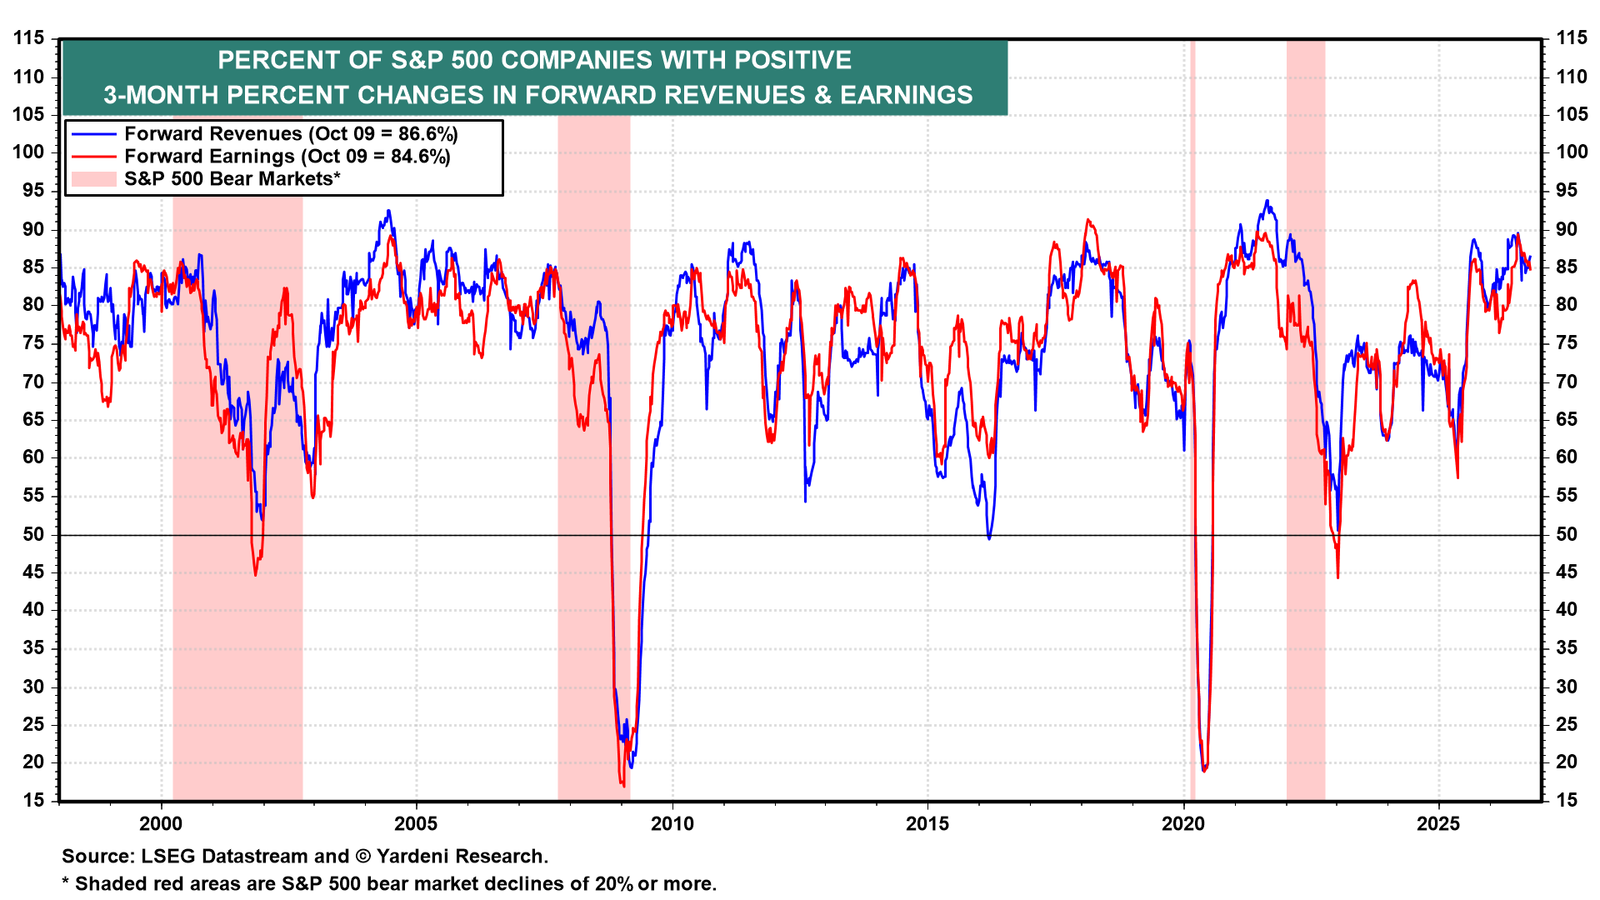
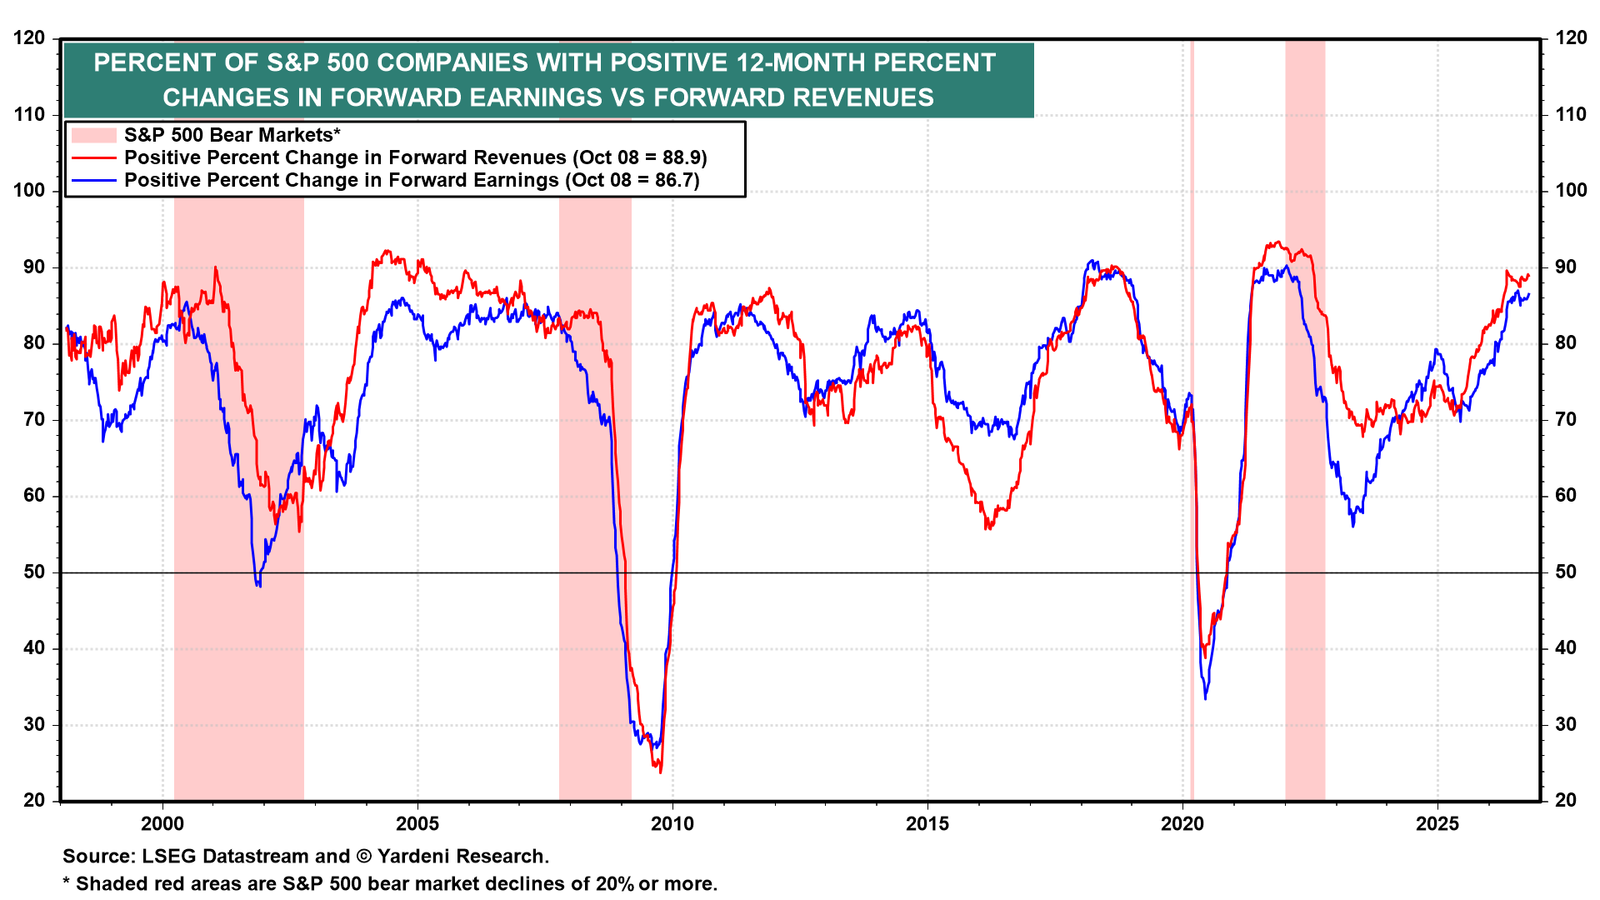
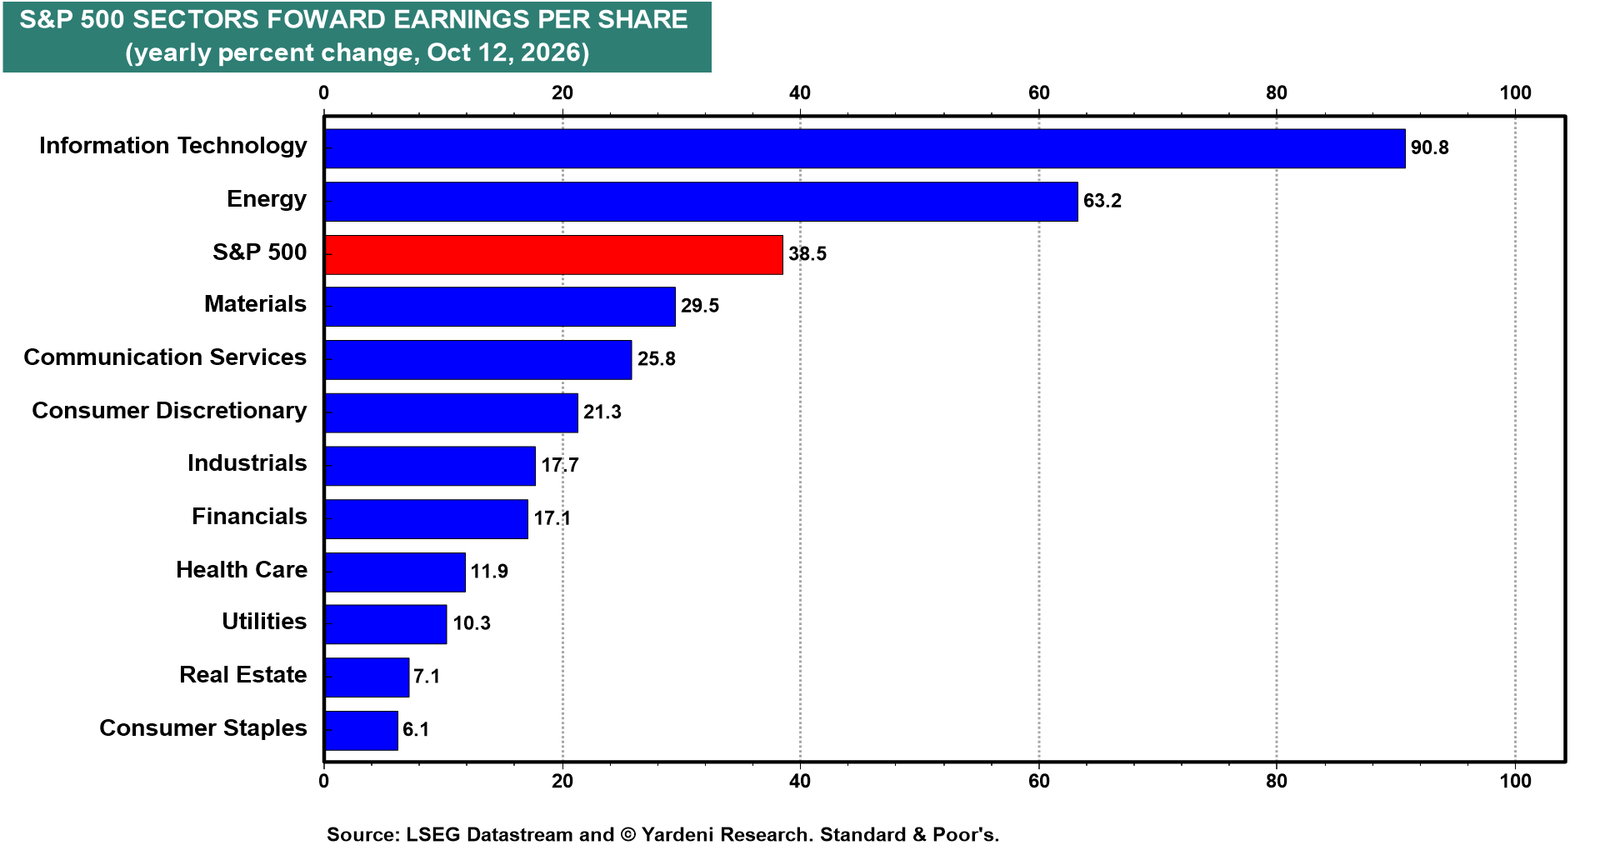
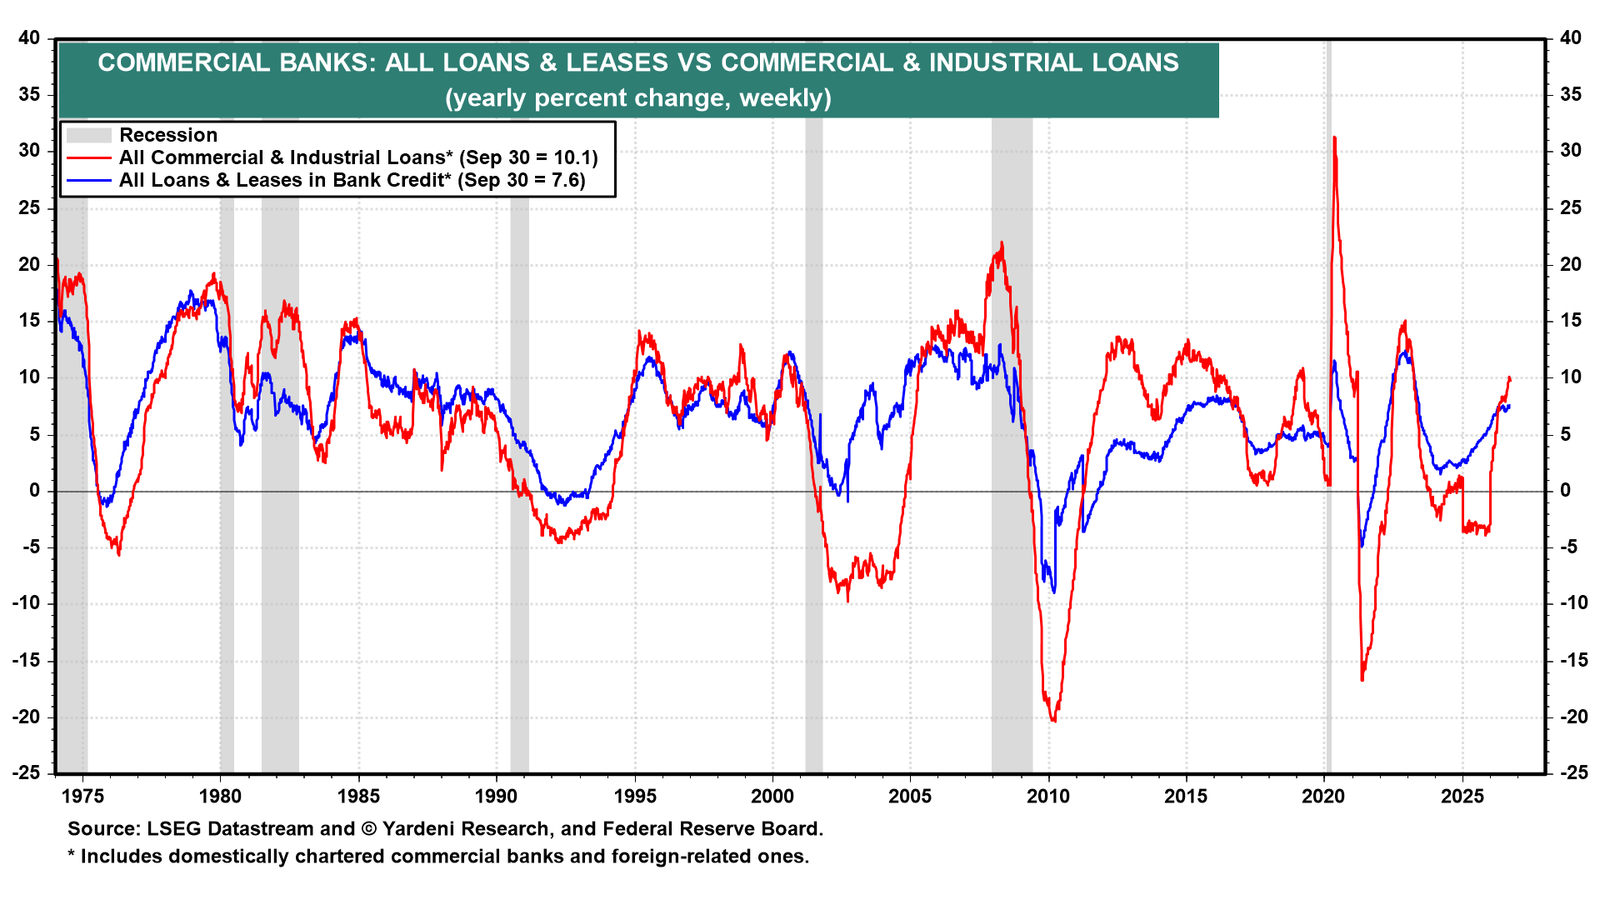
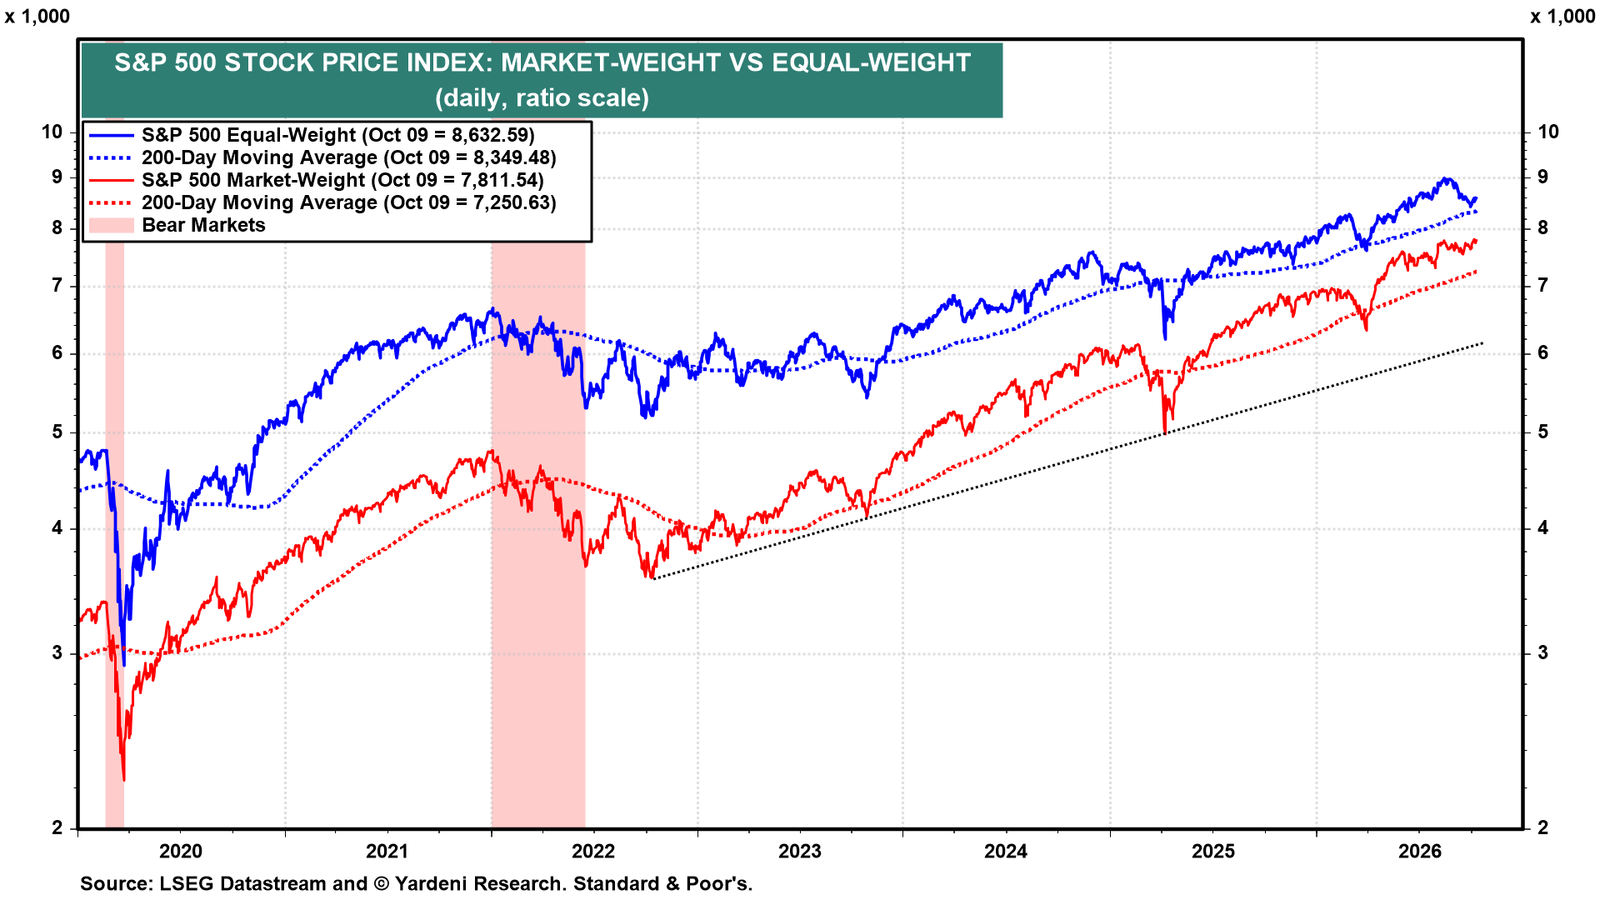
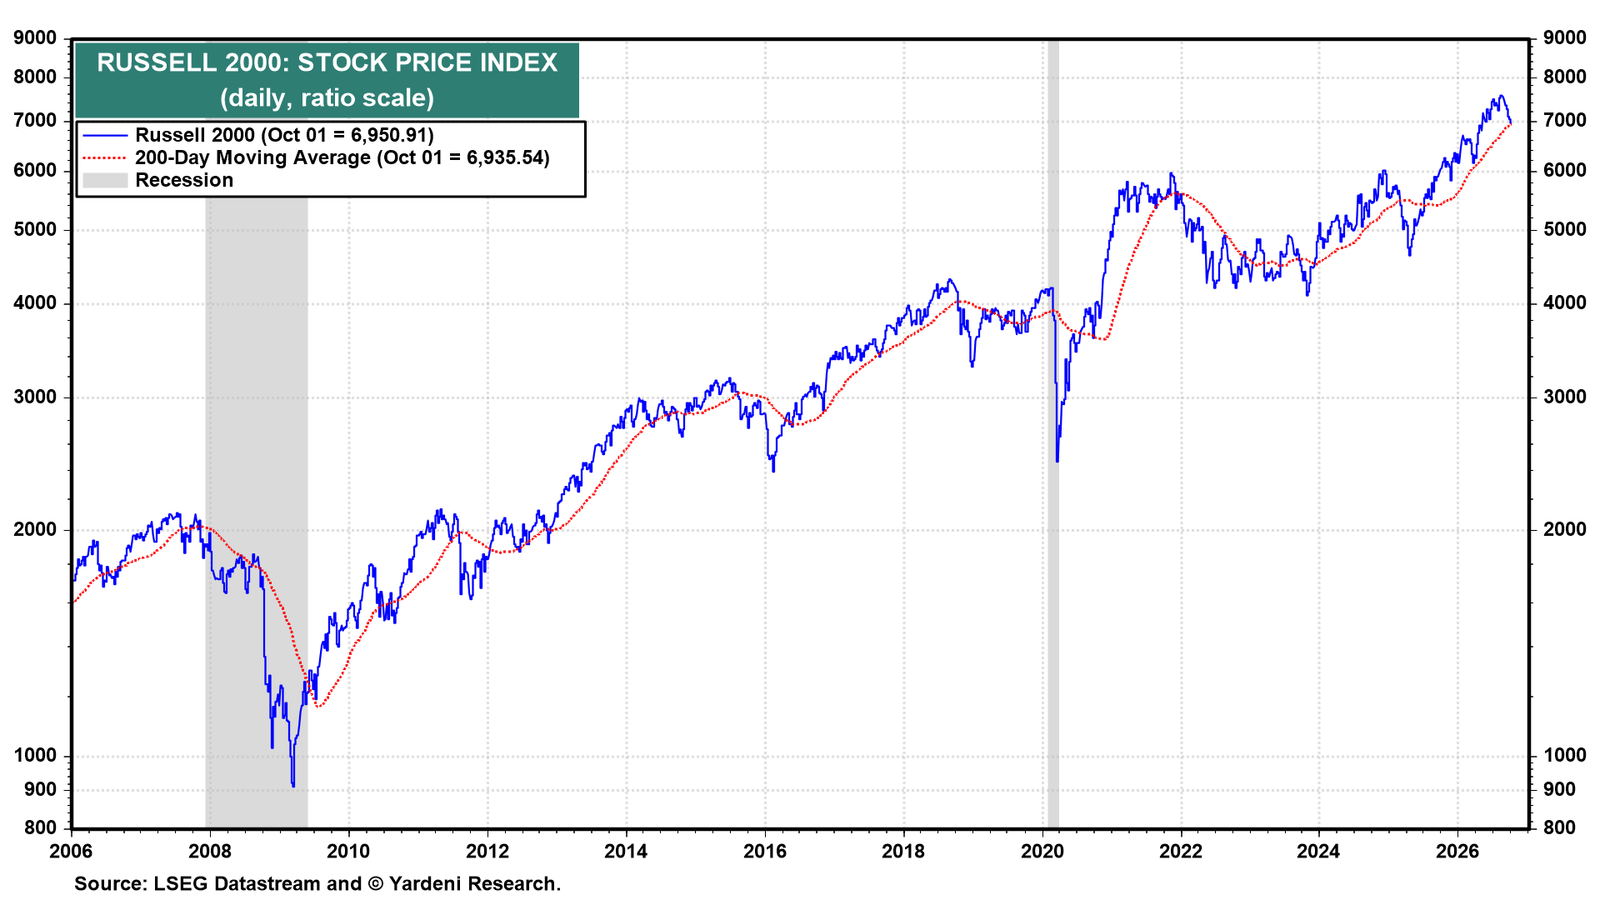
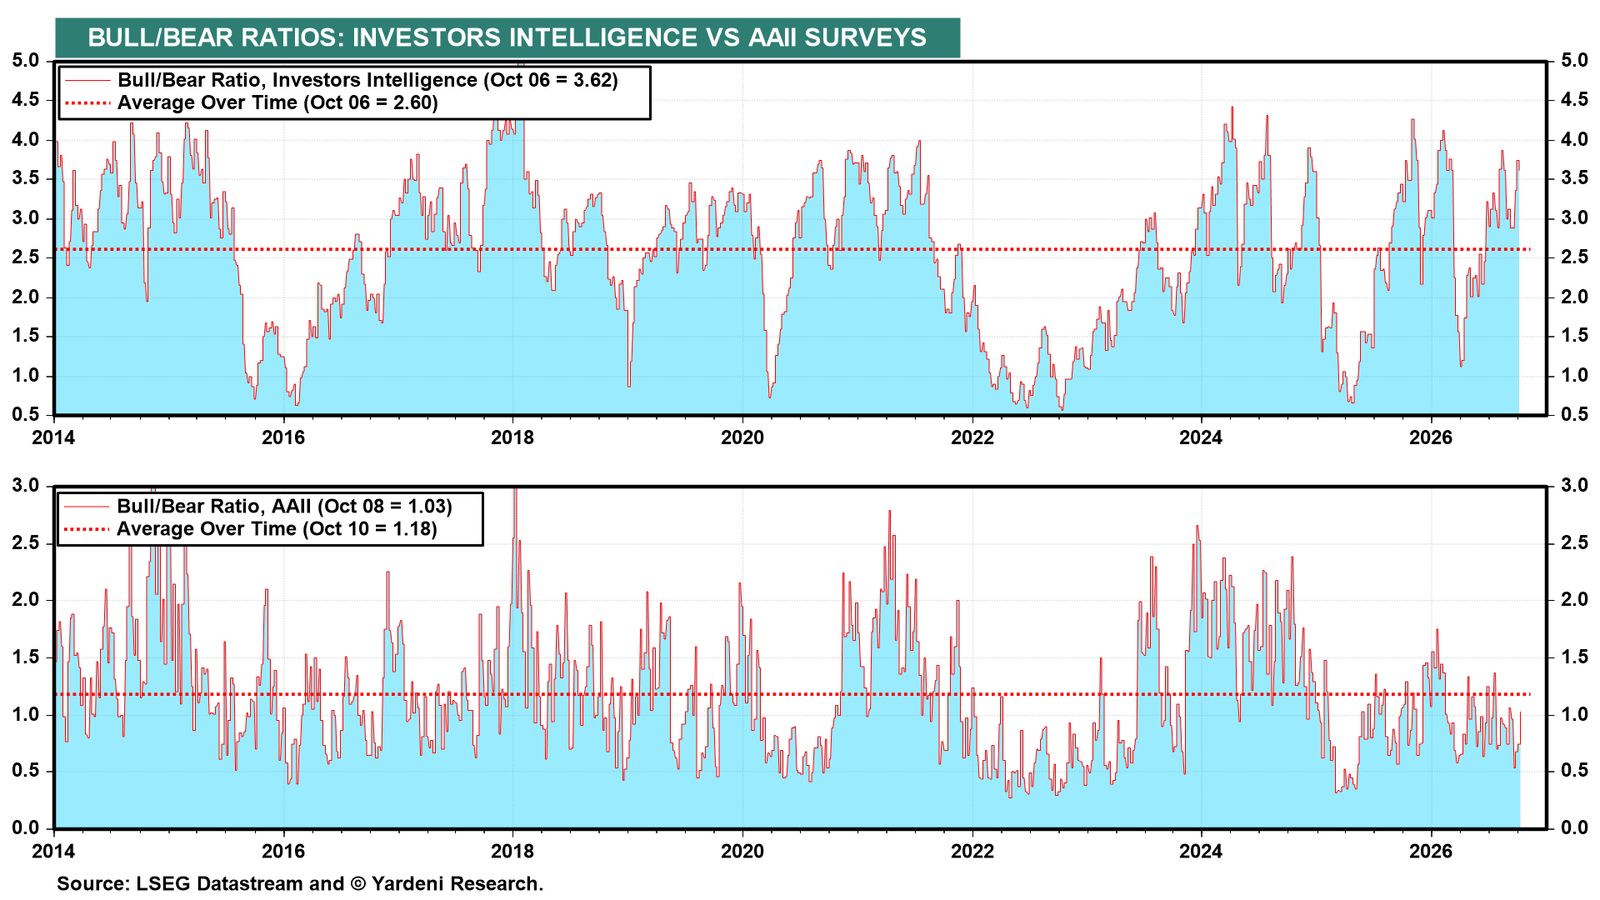
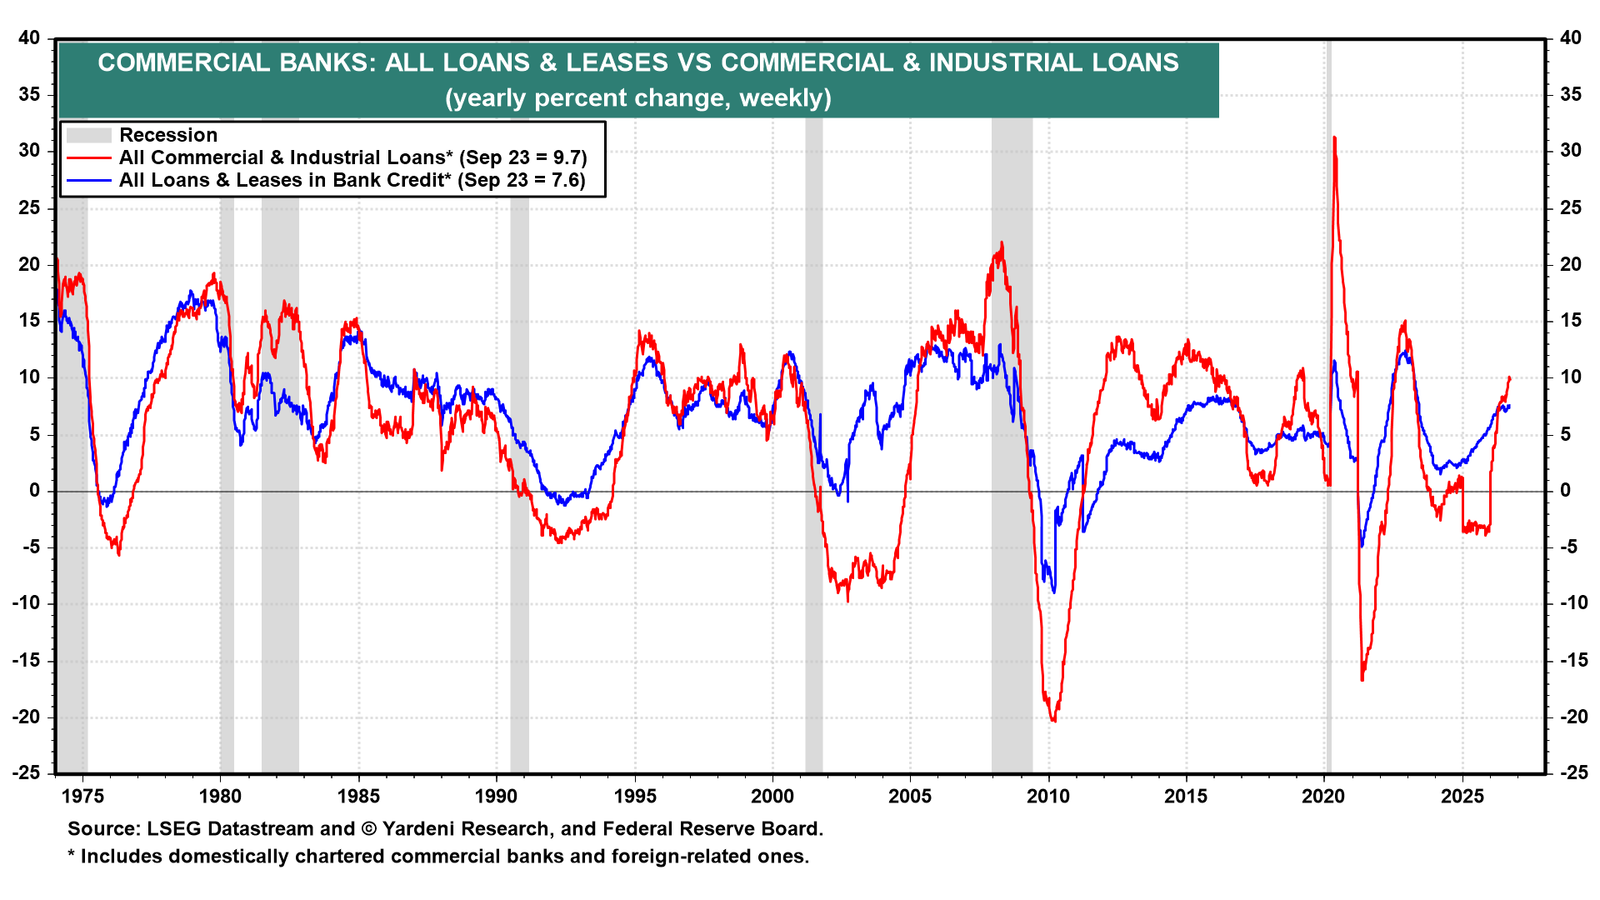
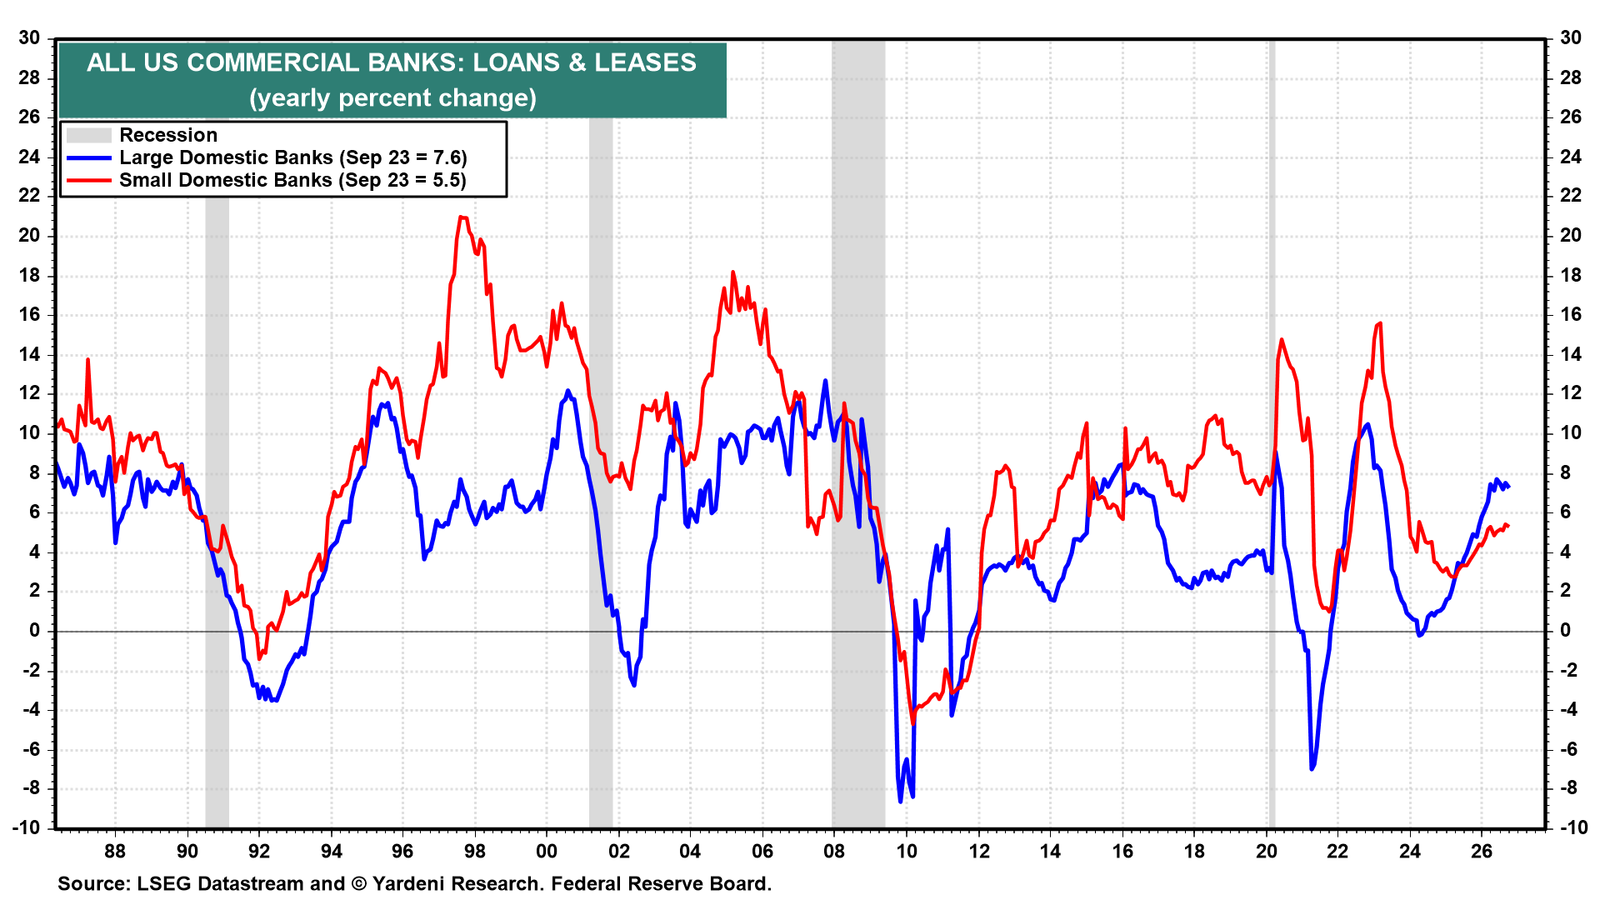
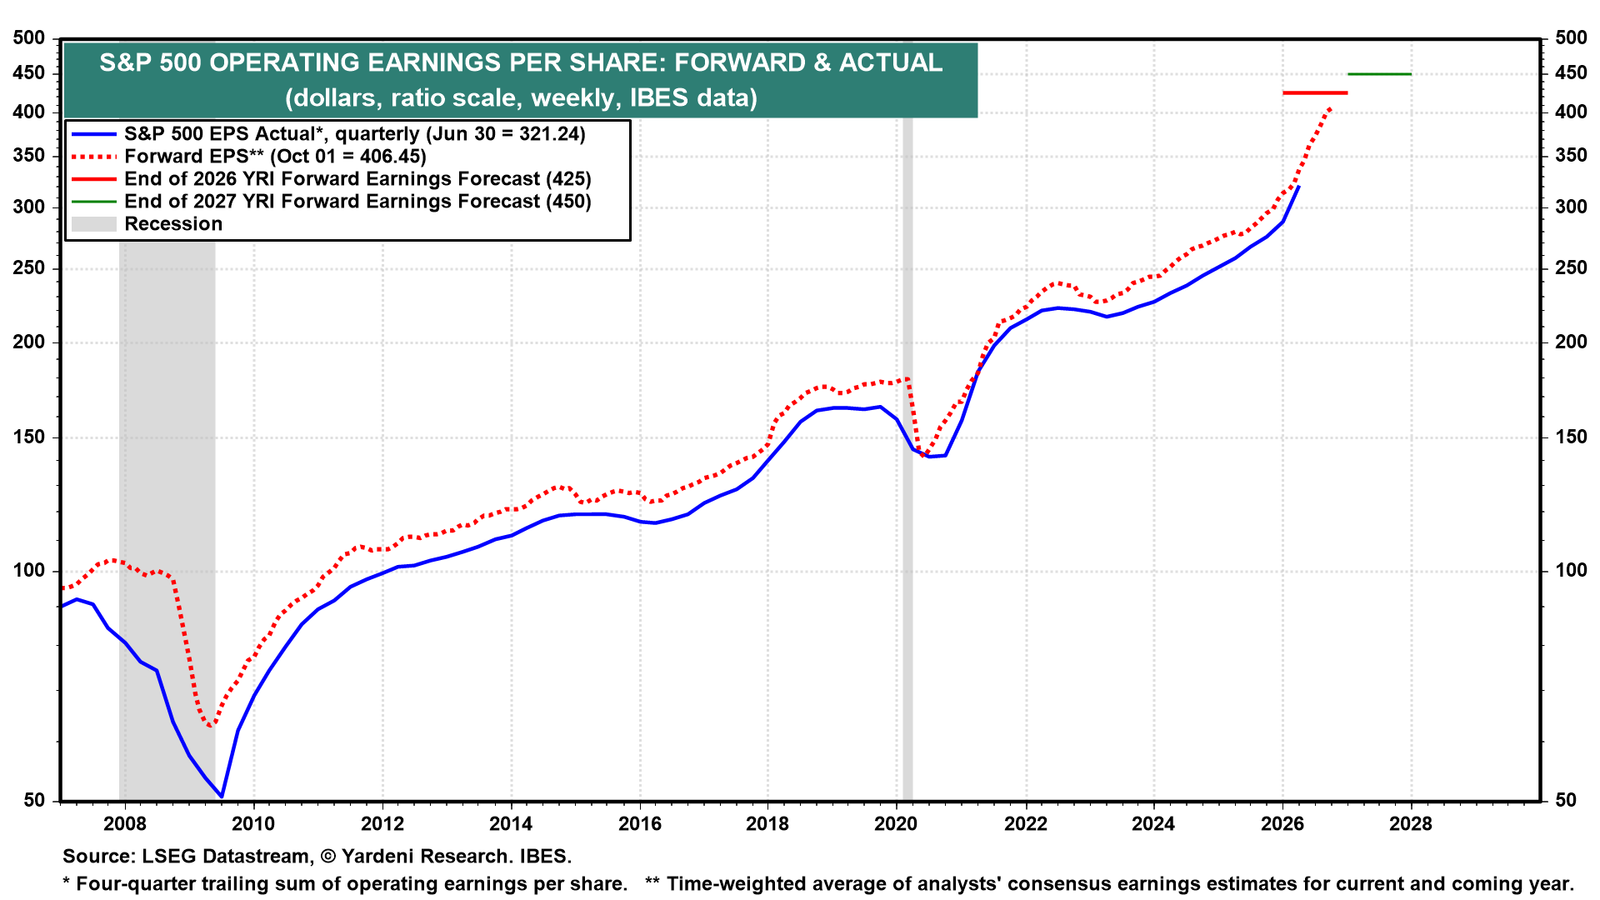
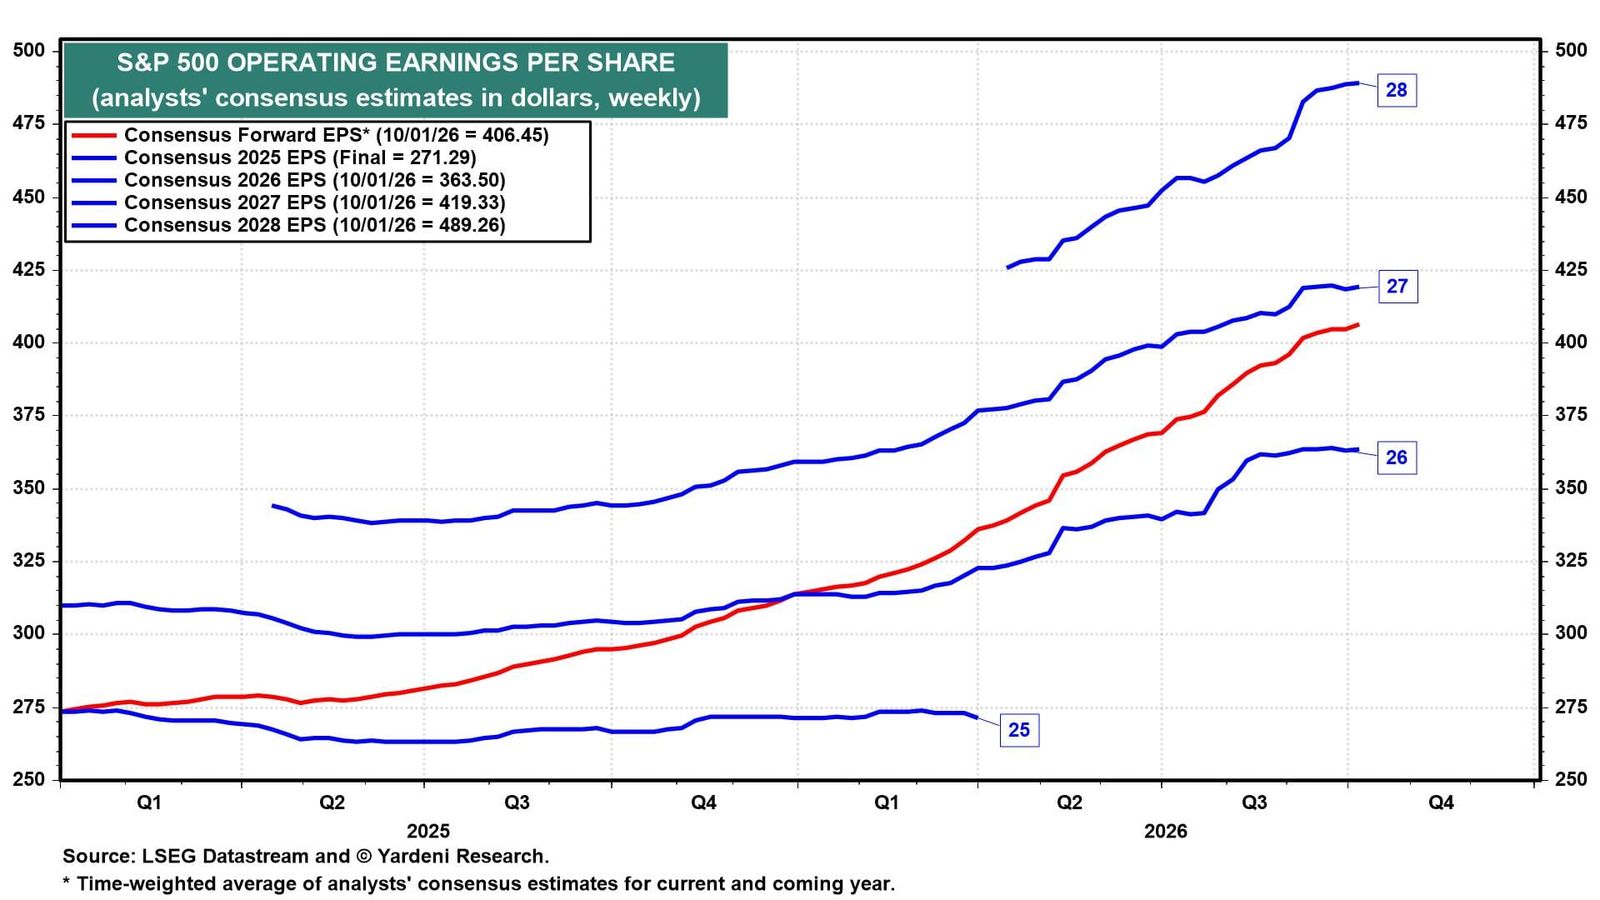
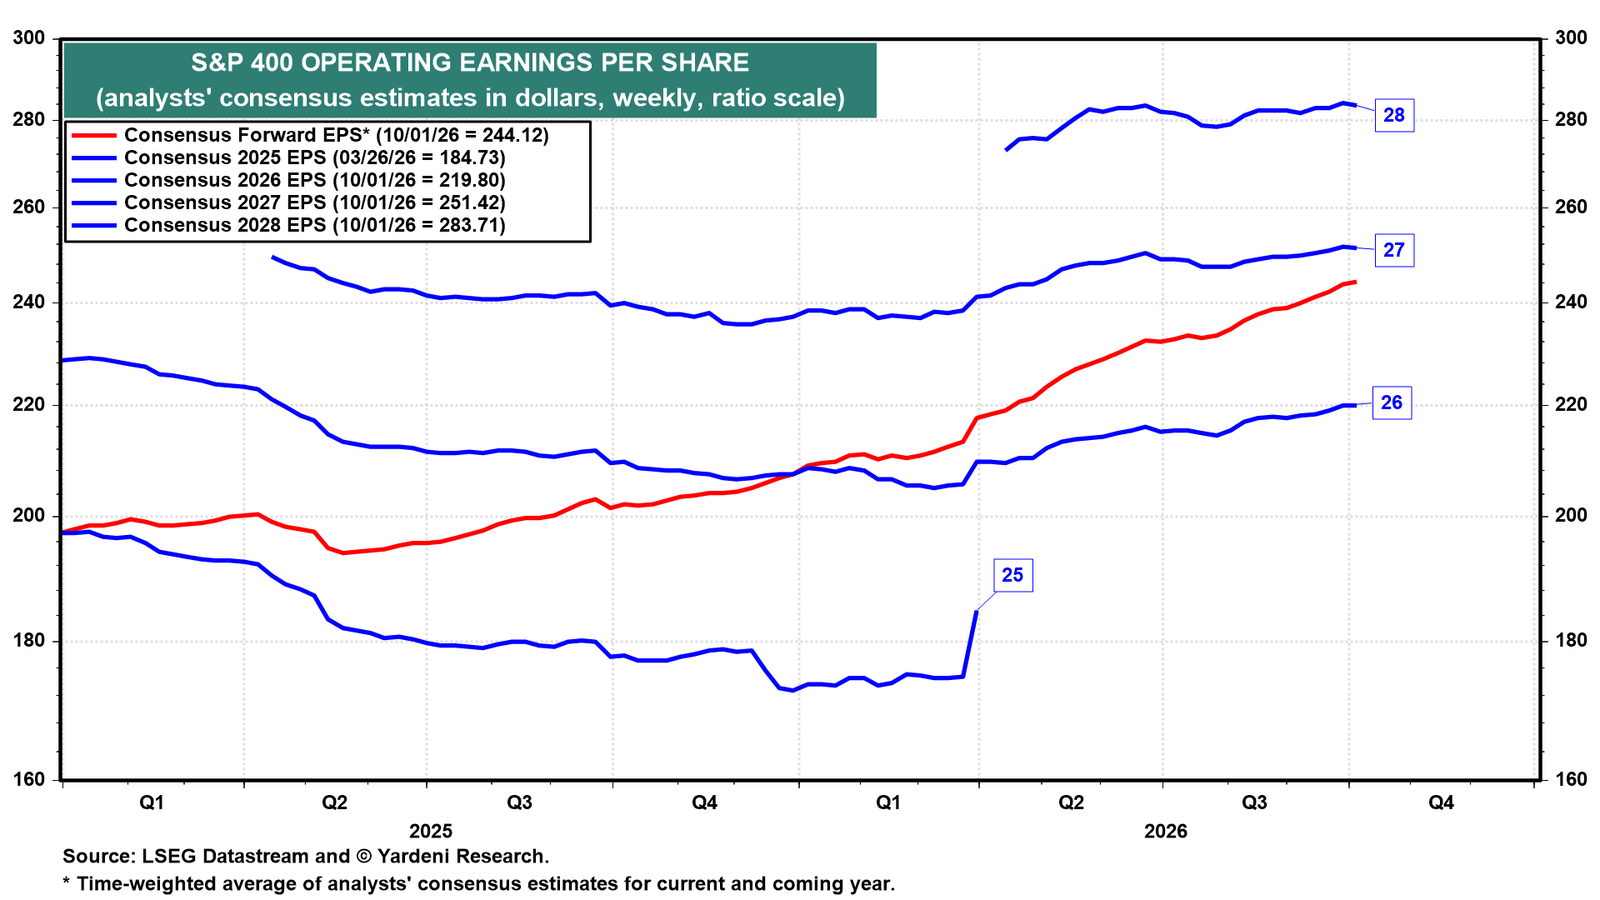
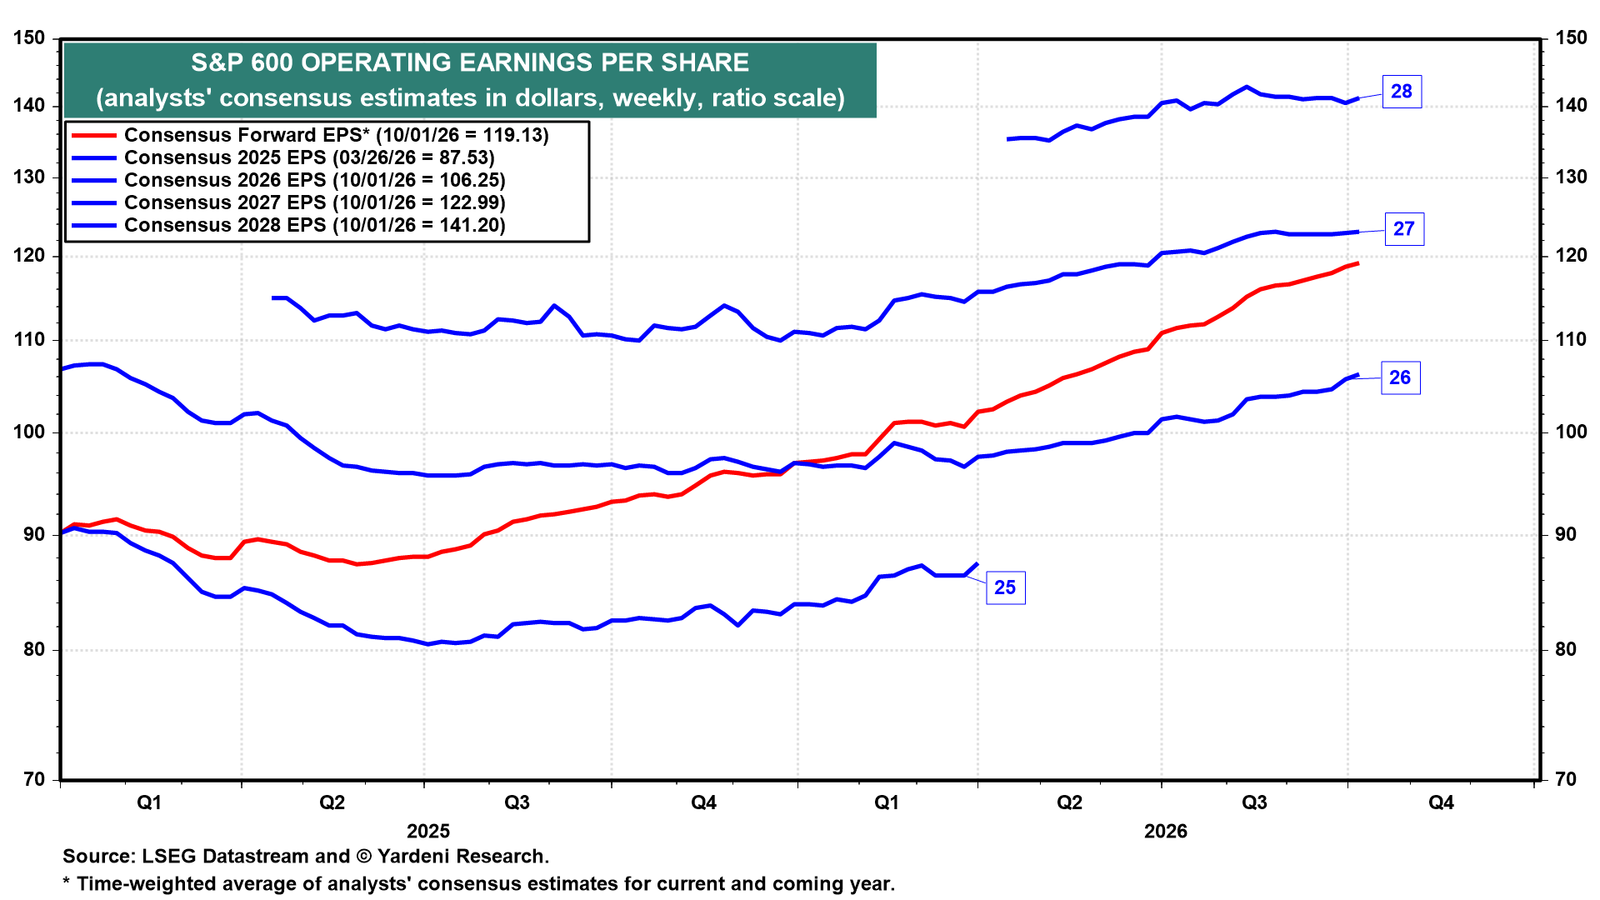
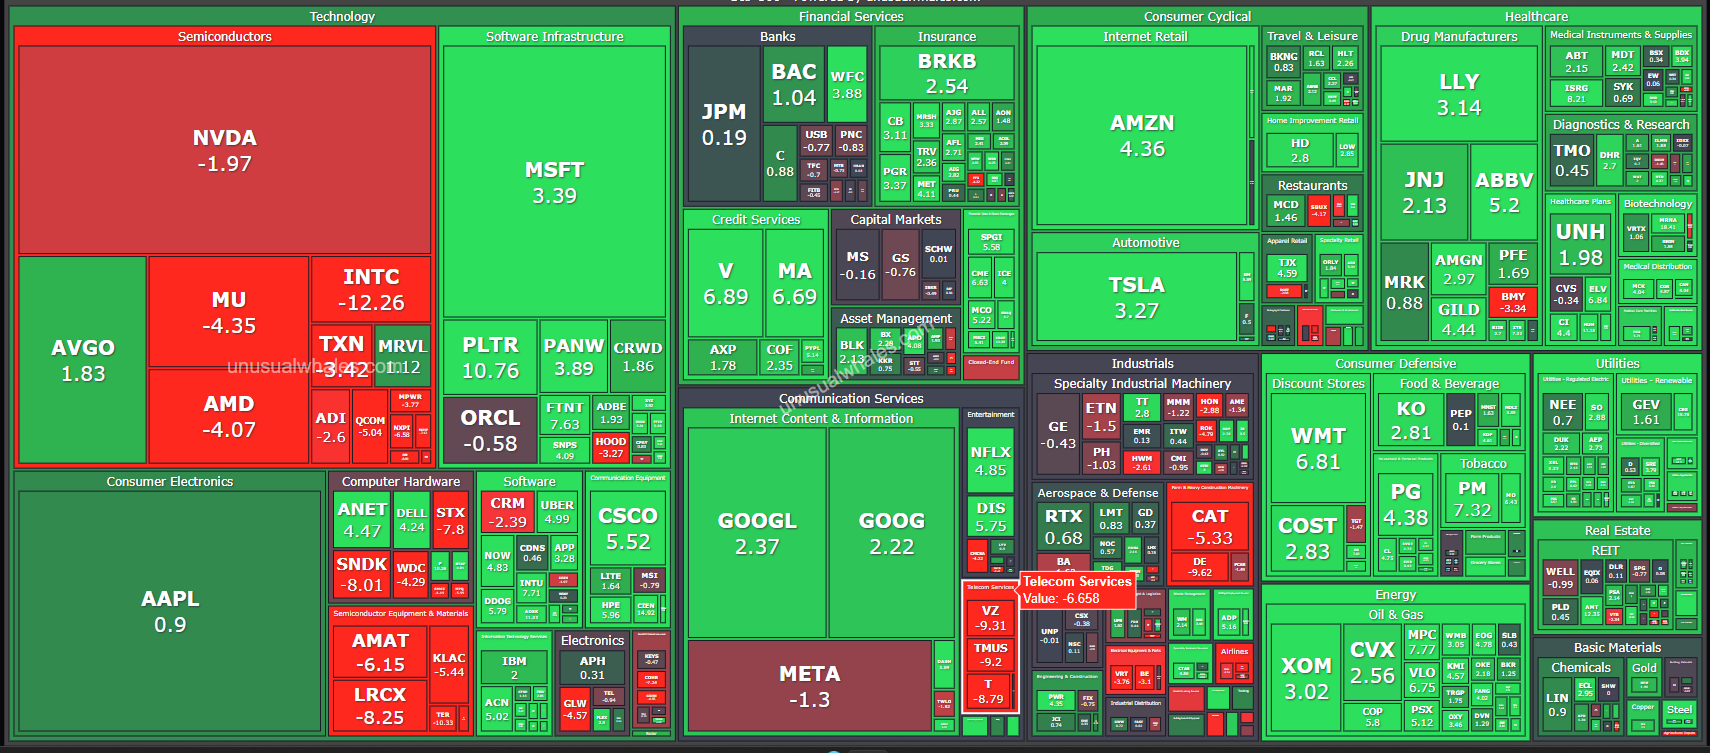
Yardeni QuickTakes US MARKET CALL: Is Irrational Exuberance Driving FEMO? The stock market bubble of the late 1990s was driven by fear of missing out (FOMO) on the tech-led bull market. As a result, the forward P/E of the S&P 500 rose to a record high of 25.0 in early 2000 as the forward P/E of the S&P 500 Information Technology sector soared to a record high of 55.0 (chart). The current bull market has been increasingly driven by fabulous earnings momentum (FEMO). On Friday, the S&P 500 closed near its June 2 record high of 7609.78. Its forward P/E was 20.4, while the Information Technology sector's was just 23.0. An earnings-led rally should be much more sustainable than a P/E-led one fueled by irrational exuberance. FEMO beats FOMO. The question that we are asked more often these days is whether the quality of earnings is eroding and fueling irrational exuberance in earnings expectations. Might circular financing be artificially boosting earnings among the AI-related companies? Might capital gains on their investments in one another be doing the same? Let’s have a look: (1) FEMO. The S&P 500 Information Technology analysts' consensus expected long-term earnings growth (LTEG) soared to 38.0% during the week of June 18, while the S&P 500 LTEG climbed to 23.1% (chart). Both well exceed their 2000 peaks of 28.7 and 18.7 (chart). The 14.9-point spread between the two is wider today than the 10.0-point gap at the 2000 peak. Some of the FEMO is not pure operating income either. In Q1-2026, mark-to-market gains on equity investments in AI companies accounted for 58% of Alphabet's net profit, 52% of Amazon's, and 27% of Nvidia's. Circular financing across the AI hyperscalers is a related concern. The Information Technology plus the Communication Services sectors of the S&P 500 currently account for a whopping 47.2% of the index's market capitalization (chart). That's not a sign of irrational exuberance, given that their combined forward earnings share of the index is 43.8%. However, irrational exuberance might play a role to some extent if the earnings expectations are unlikely to be realized for the reasons mentioned above. Then again, investors certainly aren't valuing the analysts' earnings outlooks for the two sectors as highly as they did during the tech bubble of the late 1990s (chart). Back then, it was FOMO driving the bull market. Now it's FEMO. While the earnings quality of the Magnificent-7 might be reduced by circular financing and capital gains, that's not an issue for the earnings of the Impressive-493, which has been increasing at a faster pace since mid-2025 (chart). Meanwhile, S&P 500 forward EPS rose to $368.91 during the June 18 week, with 2026 at $340.82 and 2027 at $399.25 (chart). That's another record high for forward earnings. S&P 600 SmallCap and S&P 400 MidCap forward earnings also have been rising at faster paces over the past year, to record highs (chart). FEMO is broadening. (2) Stocks. FEMO is driving Momentum ETFs to record highs, led by iShares MSCI USA Momentum (MTUM), up 33.9% ytd (chart). Semiconductor ETFs are also at record highs (chart). Micron is now the third-largest weighting in SMH after a 259% ytd return. The Russell 2000 ETF (IWM) is breaking out to new highs, a sign that the rally is broadening beyond mega-cap stocks (chart). (3) Valuation & sentiment. The forward P/E spread between the S&P 500 and S&P 400 has narrowed to 4.0, and the spread to the S&P 600 is at 4.3 (chart). Both are off late-2025 highs of 6.9 and 7.5. The Investors Intelligence Bull/Bear ratio is 2.45 against its long-run average of 2.59, and the AAII ratio is 0.93 against its 1.19 average (chart). Sentiment is balanced, neither too bullish nor too bearish. (4) Commodities. The price of Brent crude is down sharply to $79.85 a barrel in recent days (chart). That should contribute to more FEMO in the coming weeks. Then again, the oil price might rebound if the latest peace deal is already falling apart. The price of gold might have bottomed around $4,000 an ounce a few days ago (chart). However, a hawkish Fed might continue to weigh on this price. (5) Credit. The markets have repriced since Fed Chair Kevin Warsh's debut presser last Wednesday, with federal funds rate (FFR) futures now pointing to one 25bps FFR increase over the next six months and two over the next 12 months (chart). The 2-year Treasury yield at 4.19% is well above the effective FFR of 3.63% (chart). The spread between the 2-year and 10-year Treasury yields has flattened to its tightest level in a year. Private-credit ETFs have rolled over, with Virtus Private Credit (VPC) down 3.3% over the past month to $15.09 and VanEck BDC Income (BIZD) down 1.2% to $12.36 (chart). At the same time, commercial bank loans and leases are still growing 7.3% y/y, a pace consistent with a healthy expansion and well above the contractionary readings that have preceded past downturns (chart). There is no credit crunch underway, and banks are still financing the real economy. We remain constructive on the bull market, with FEMO now broadening across the market-cap structure. We will continue to monitor the quality of earnings.
Tattico internazionale — Go Global vs Stay Home, EM, Europa, Giappone
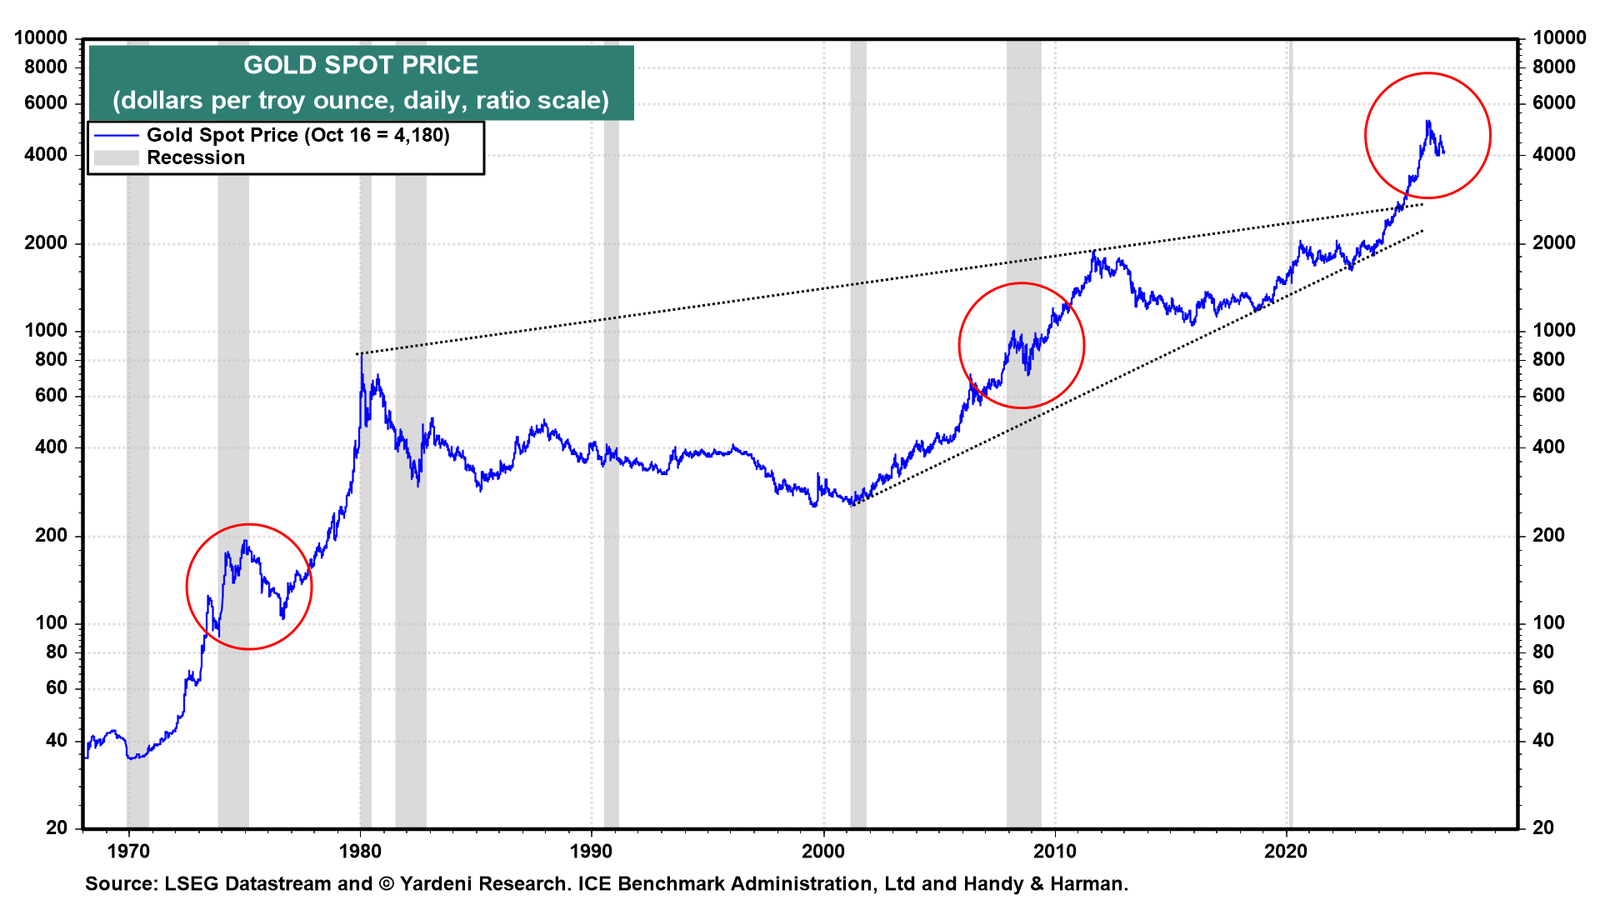
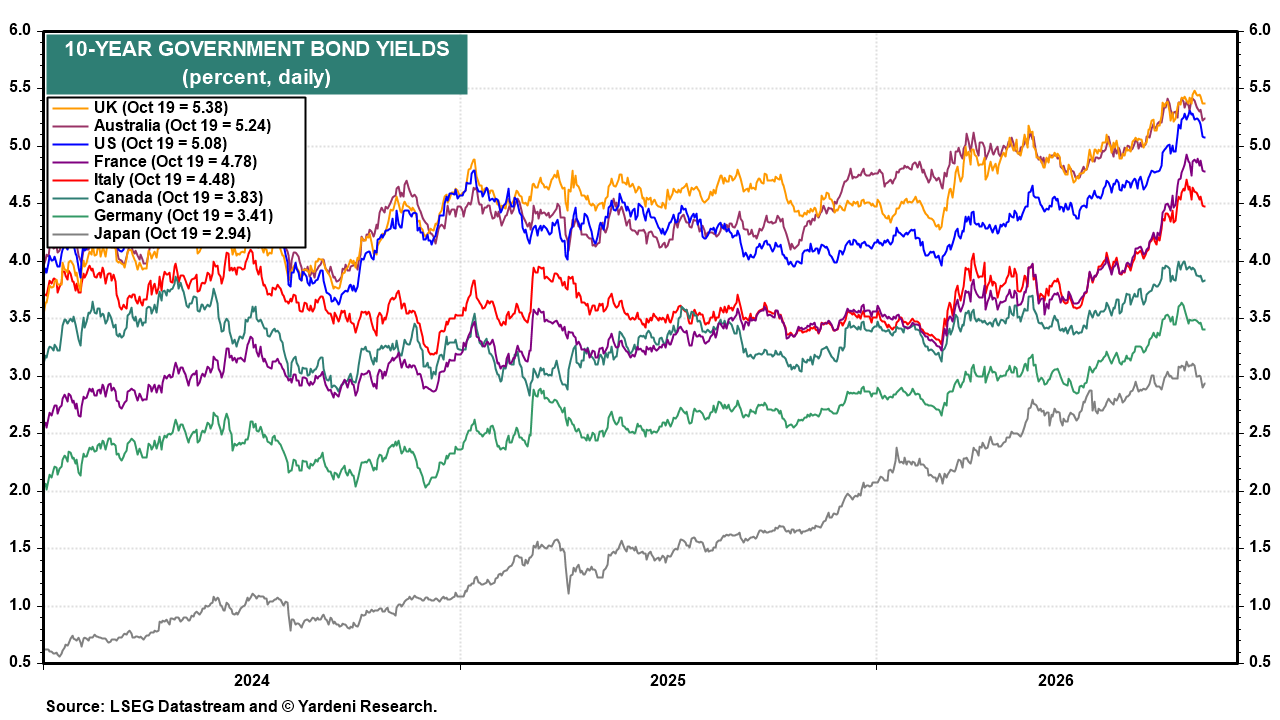
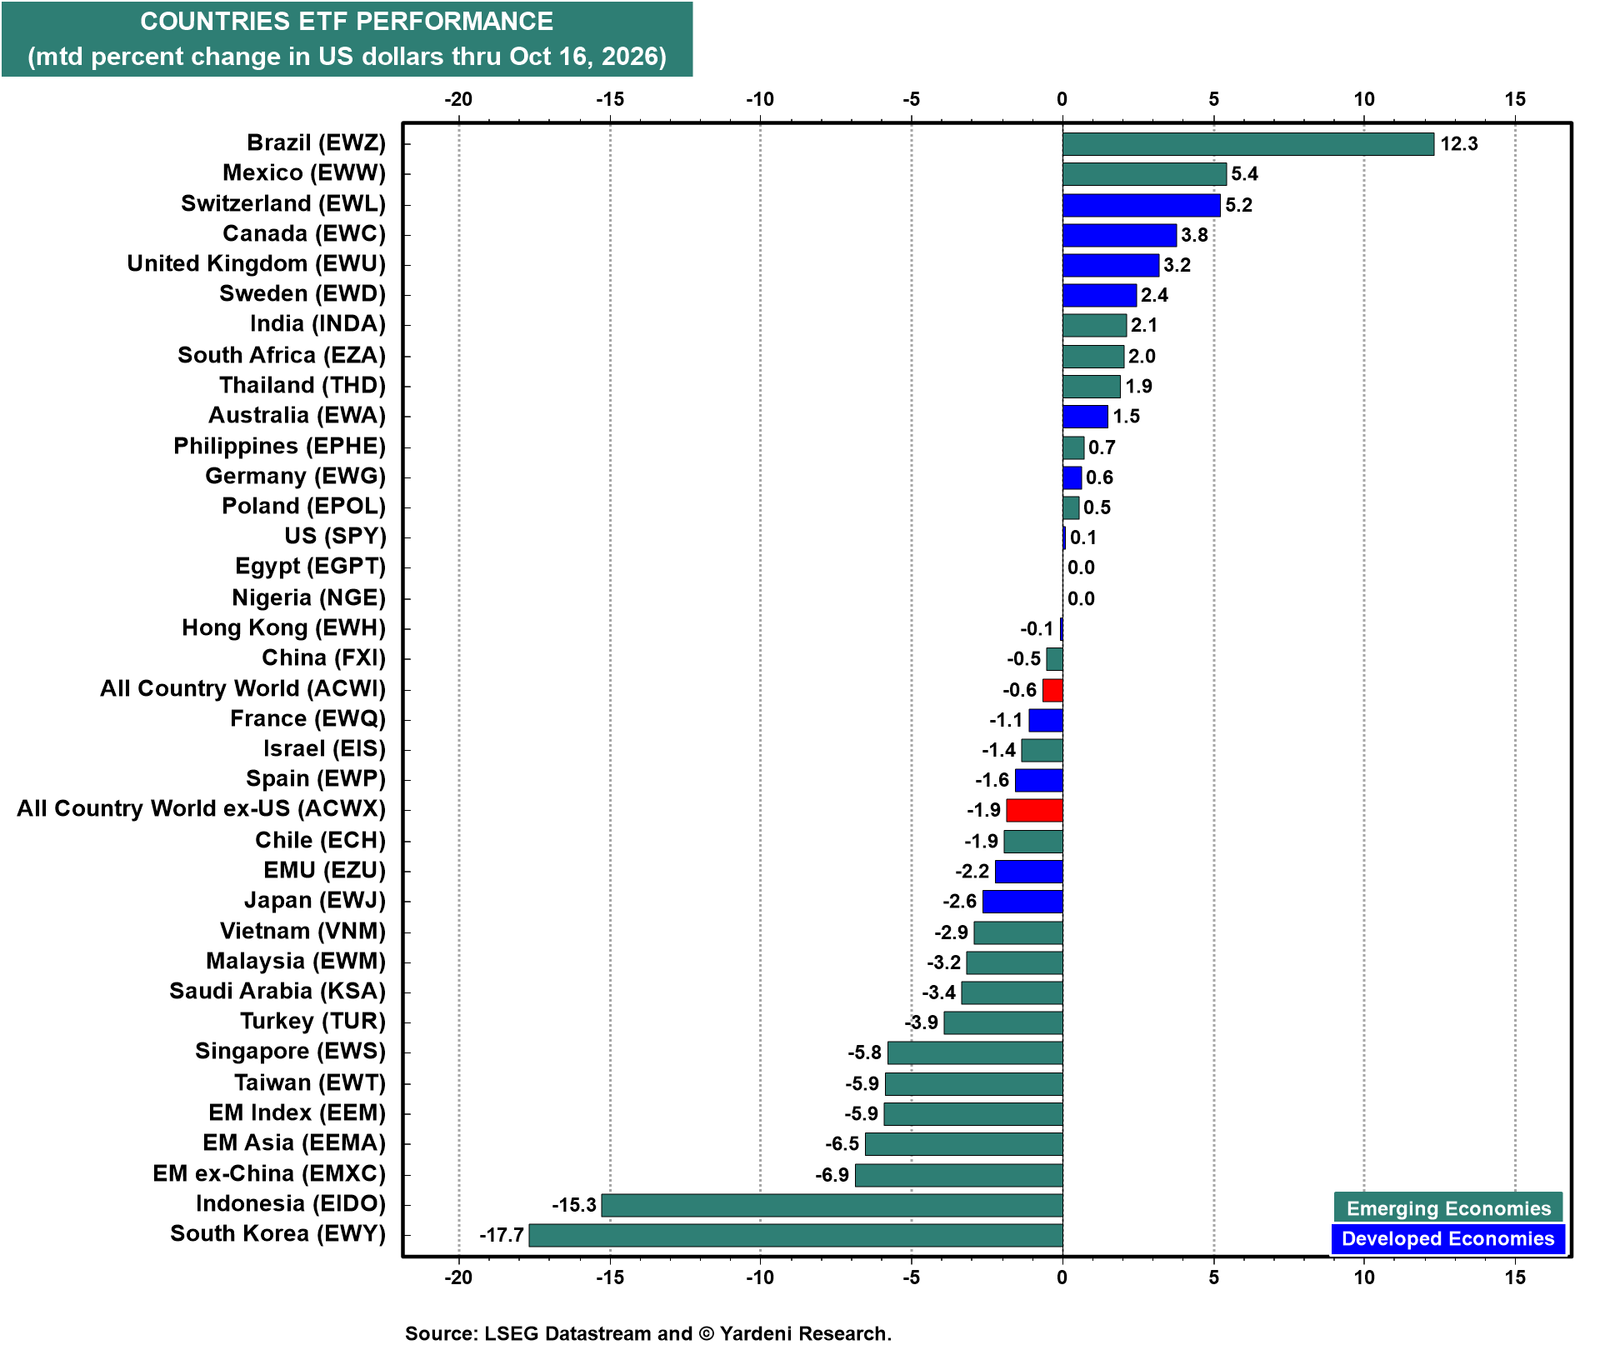
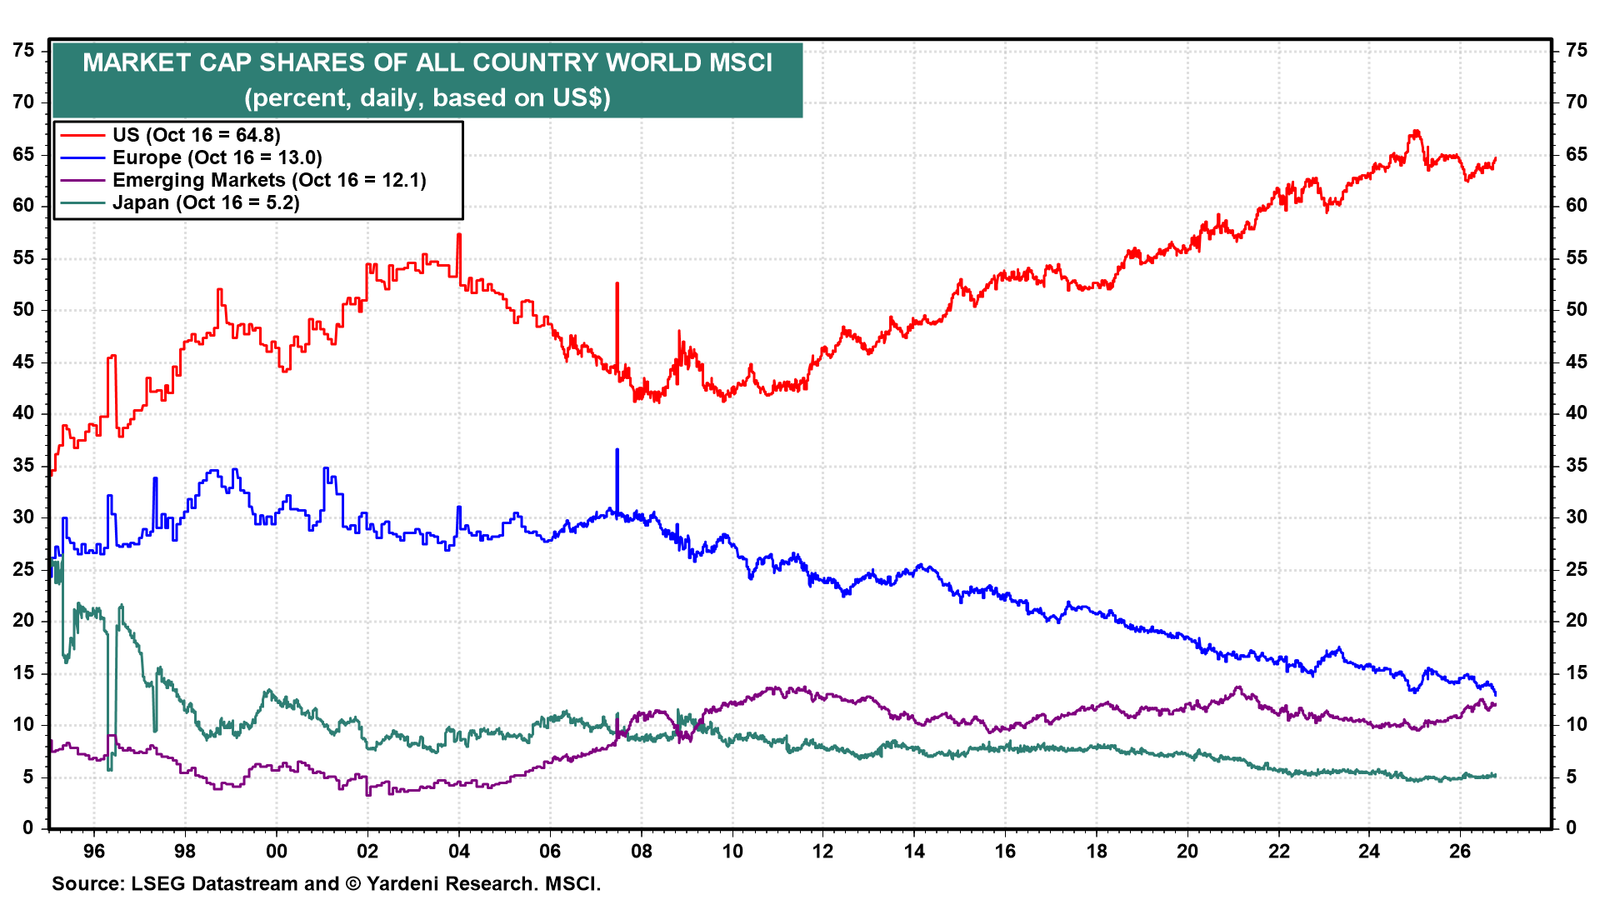
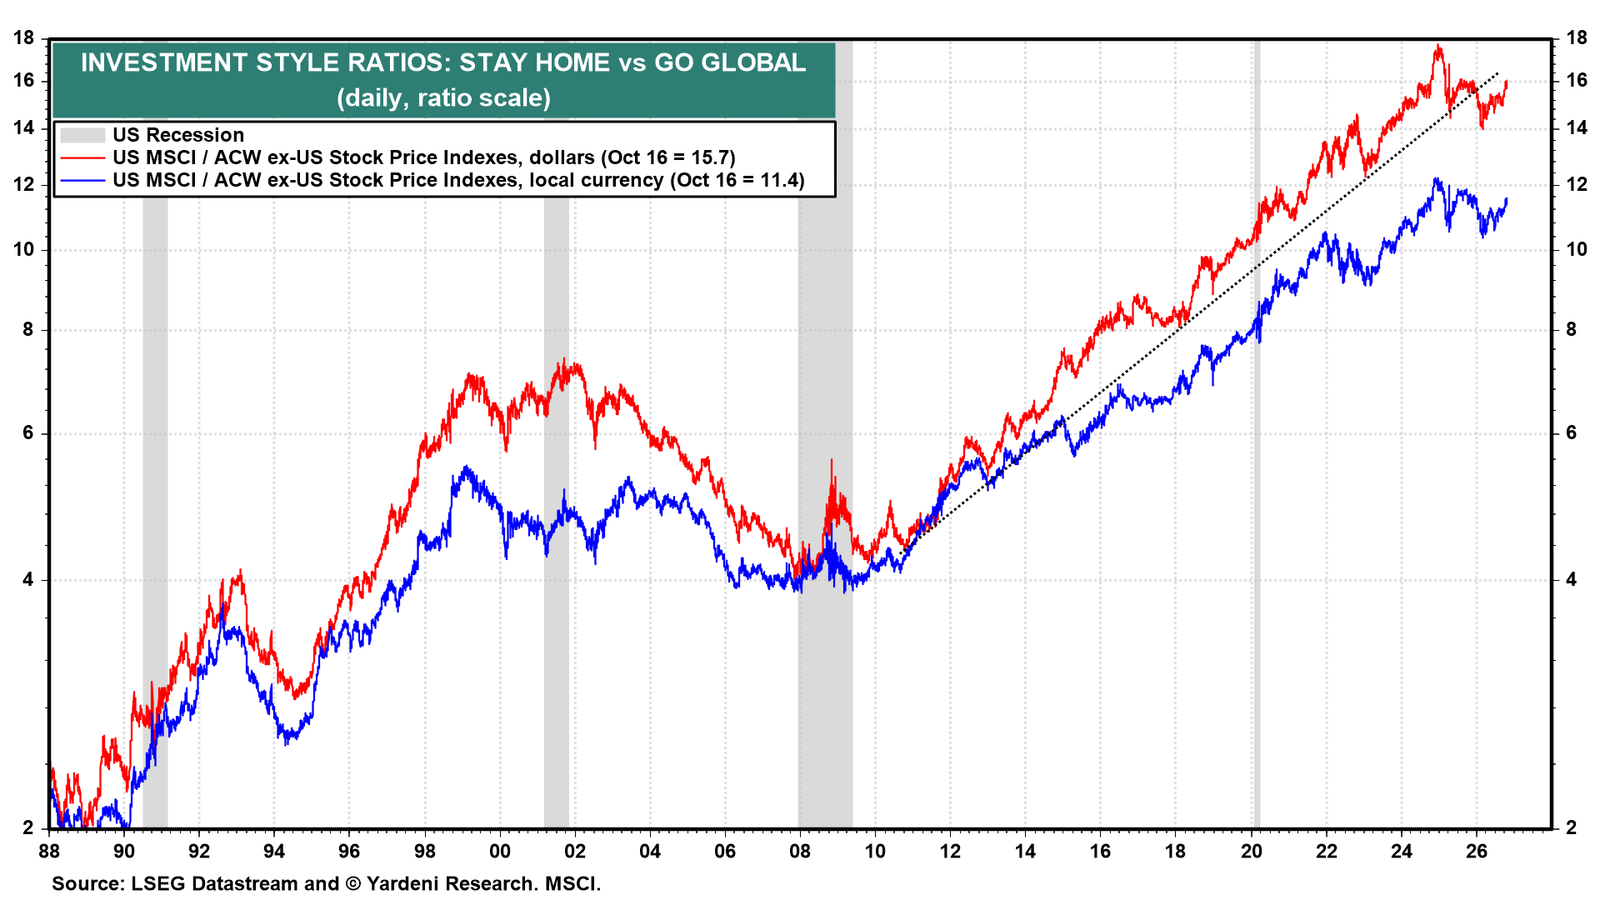
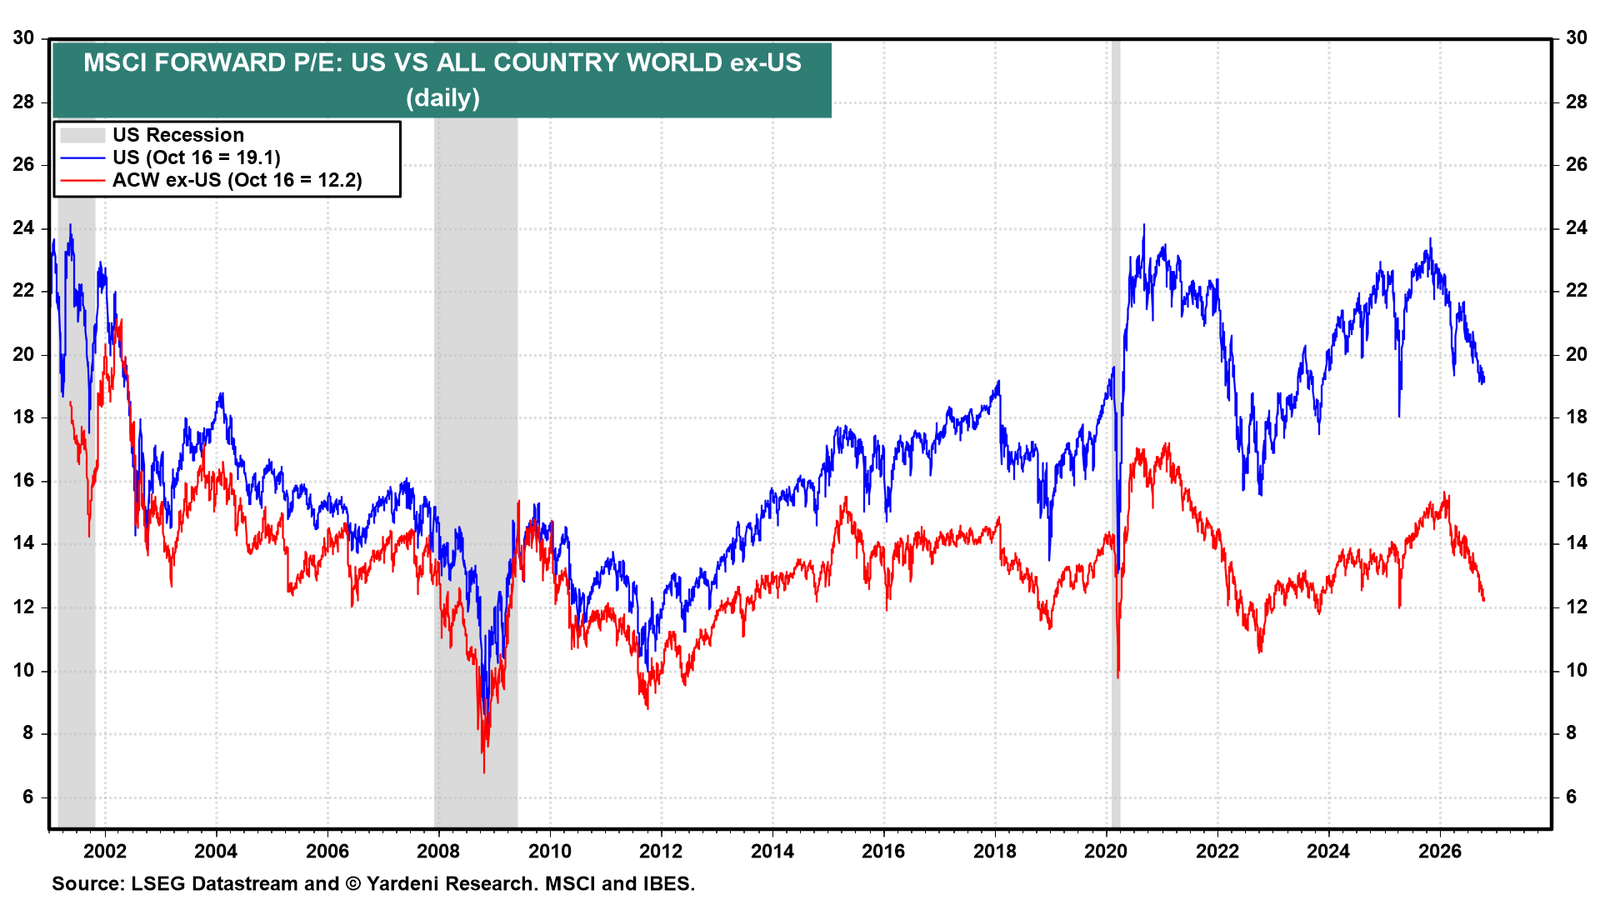
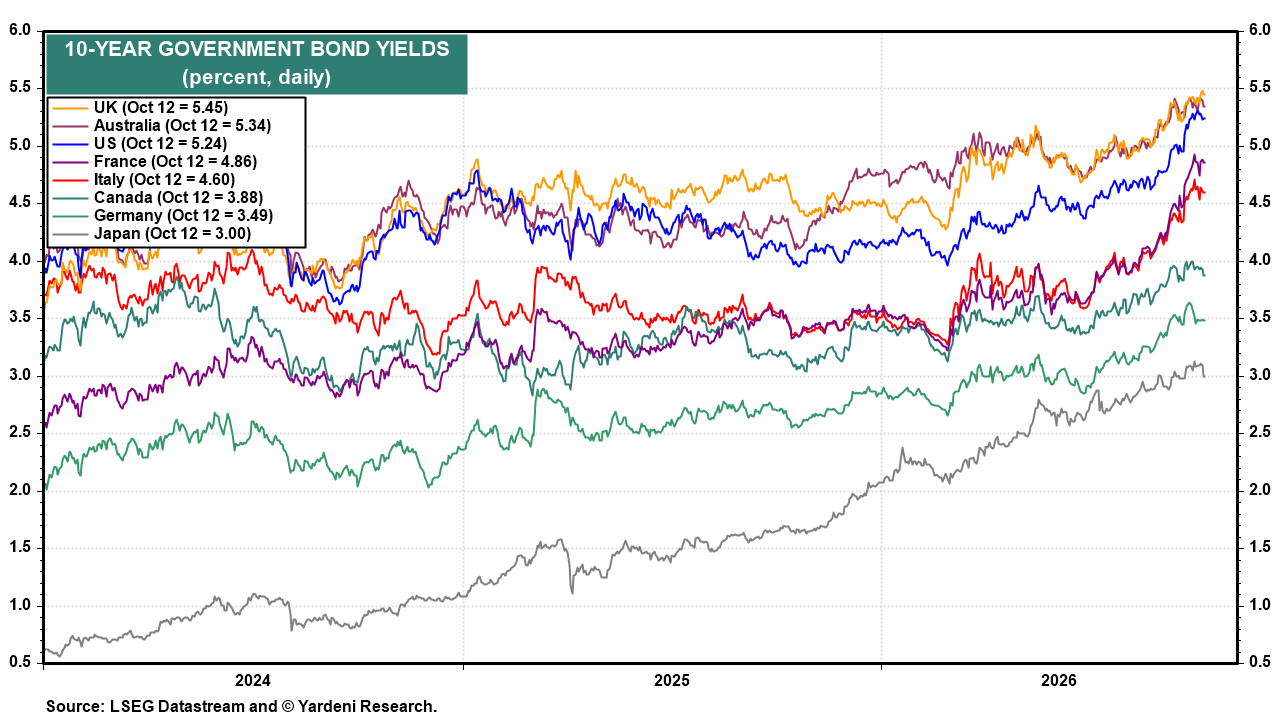
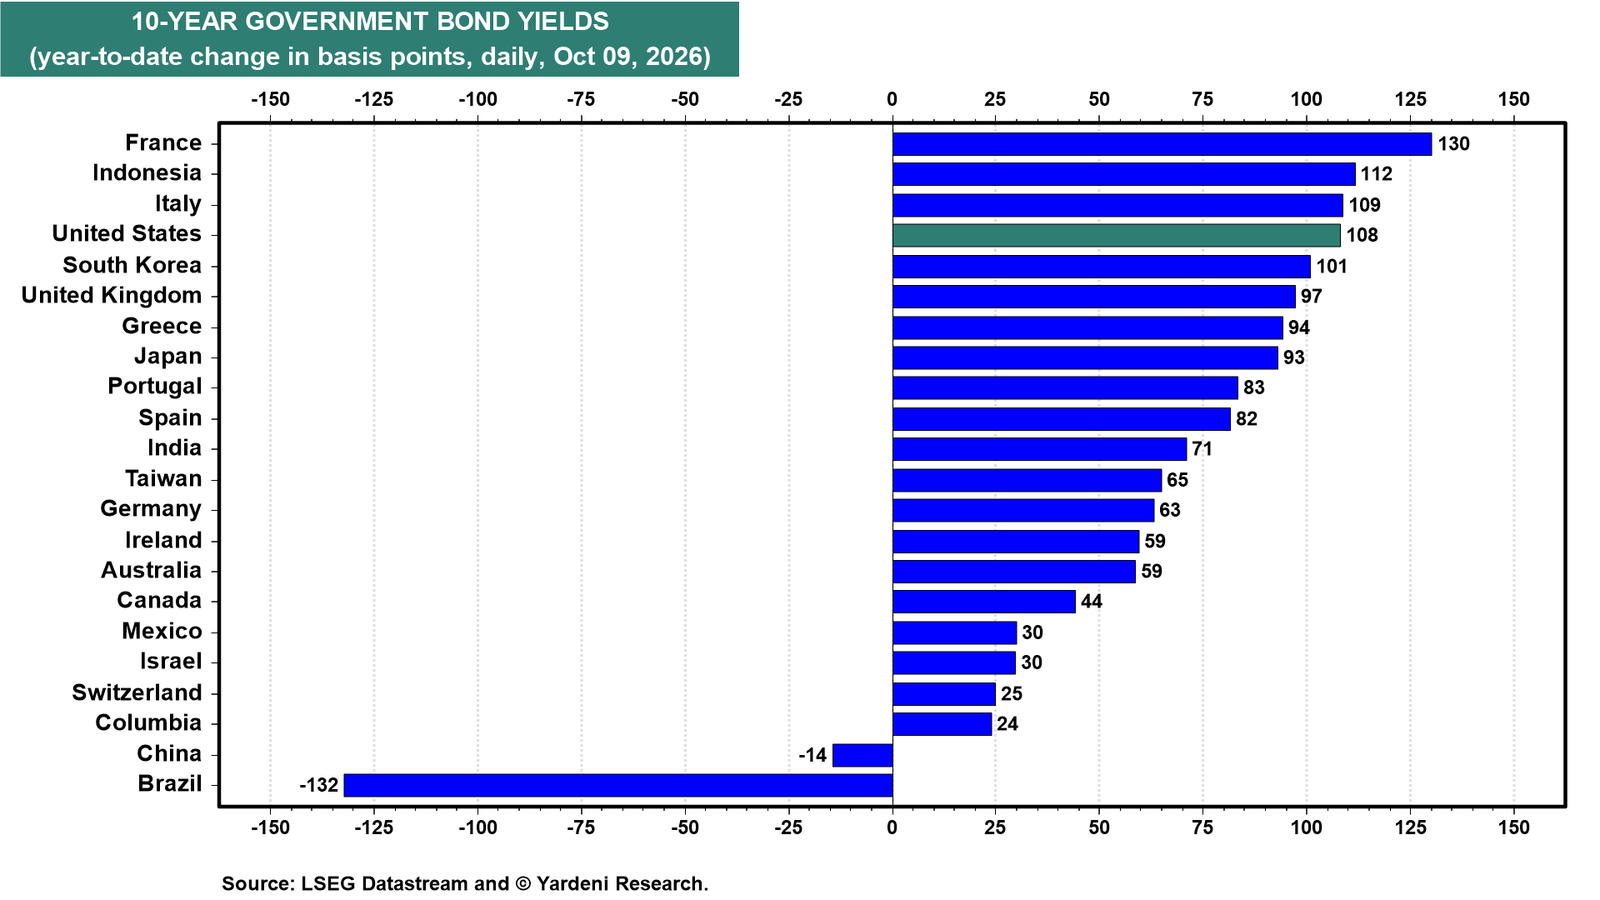
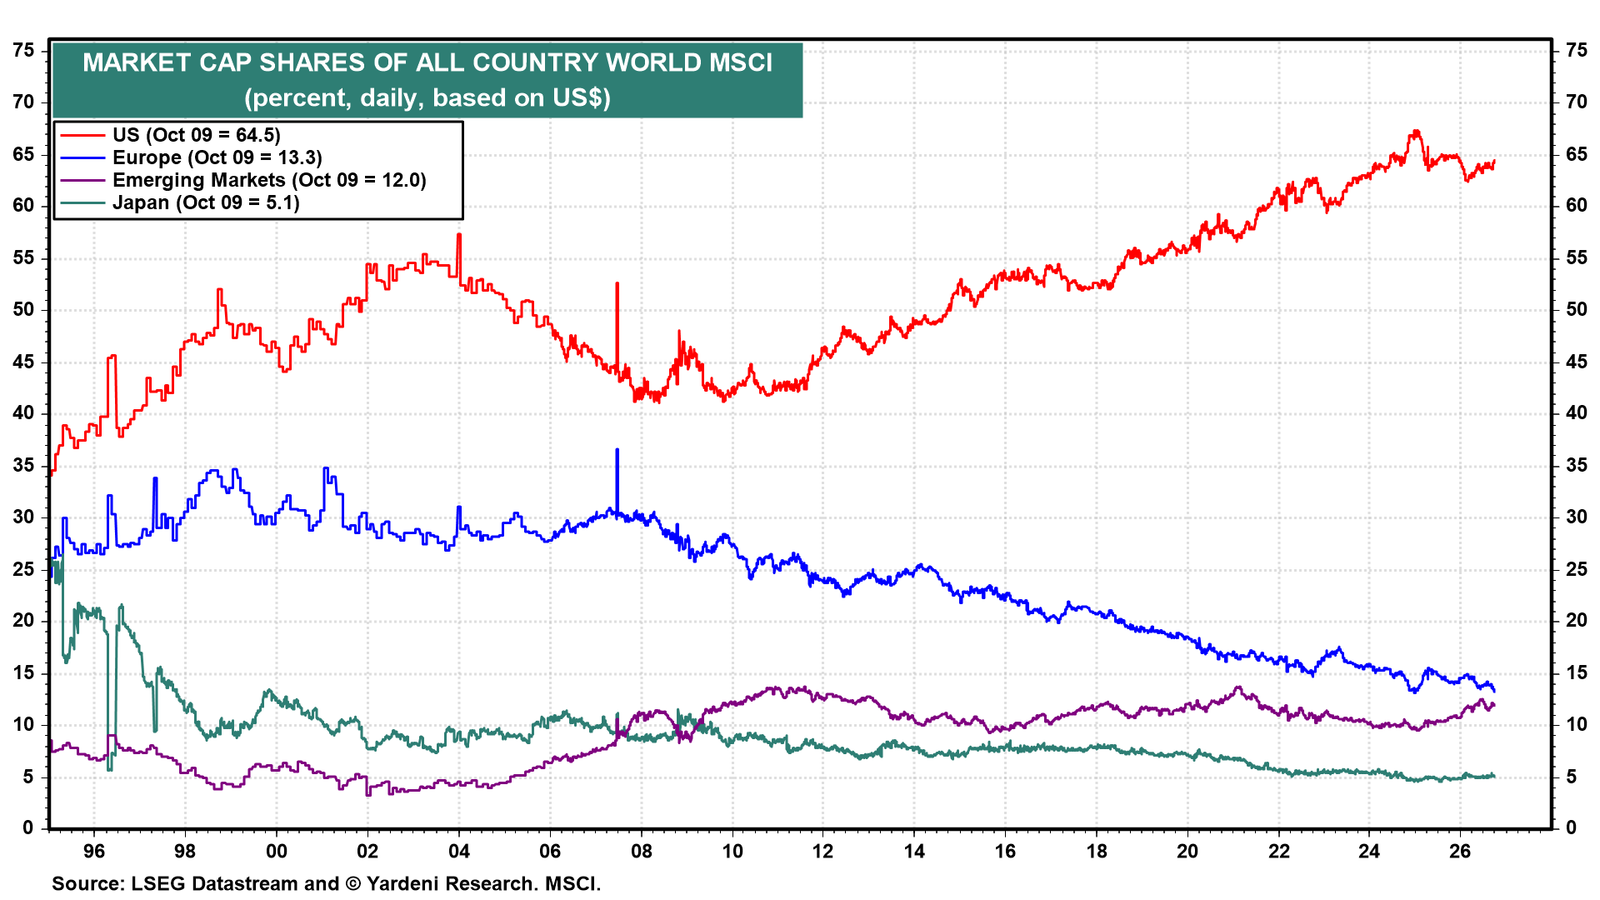
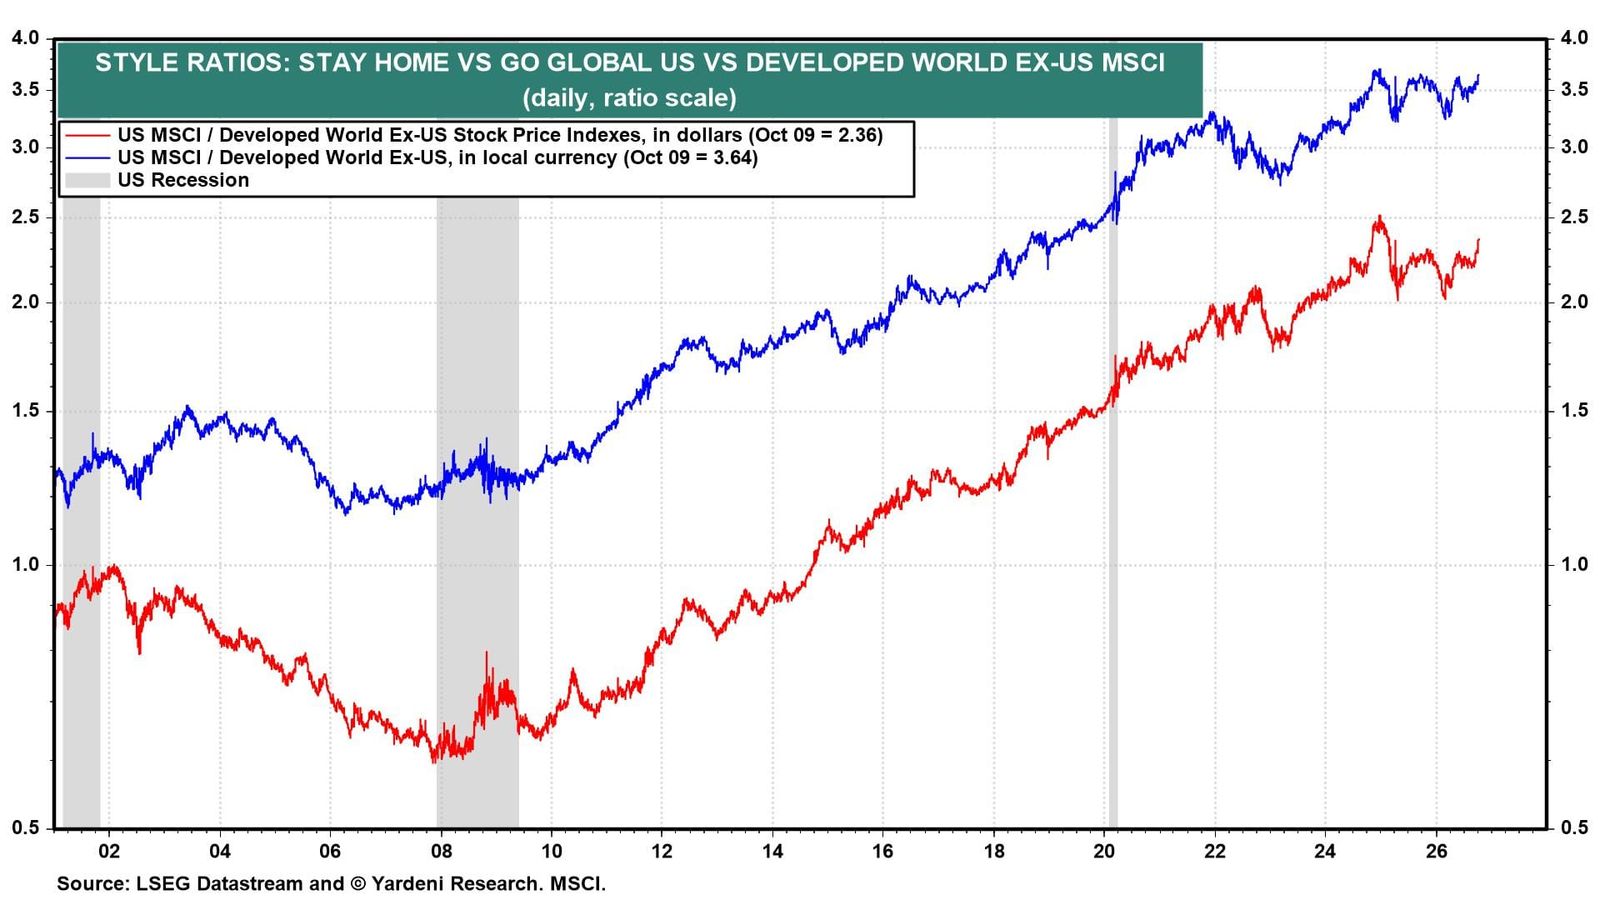
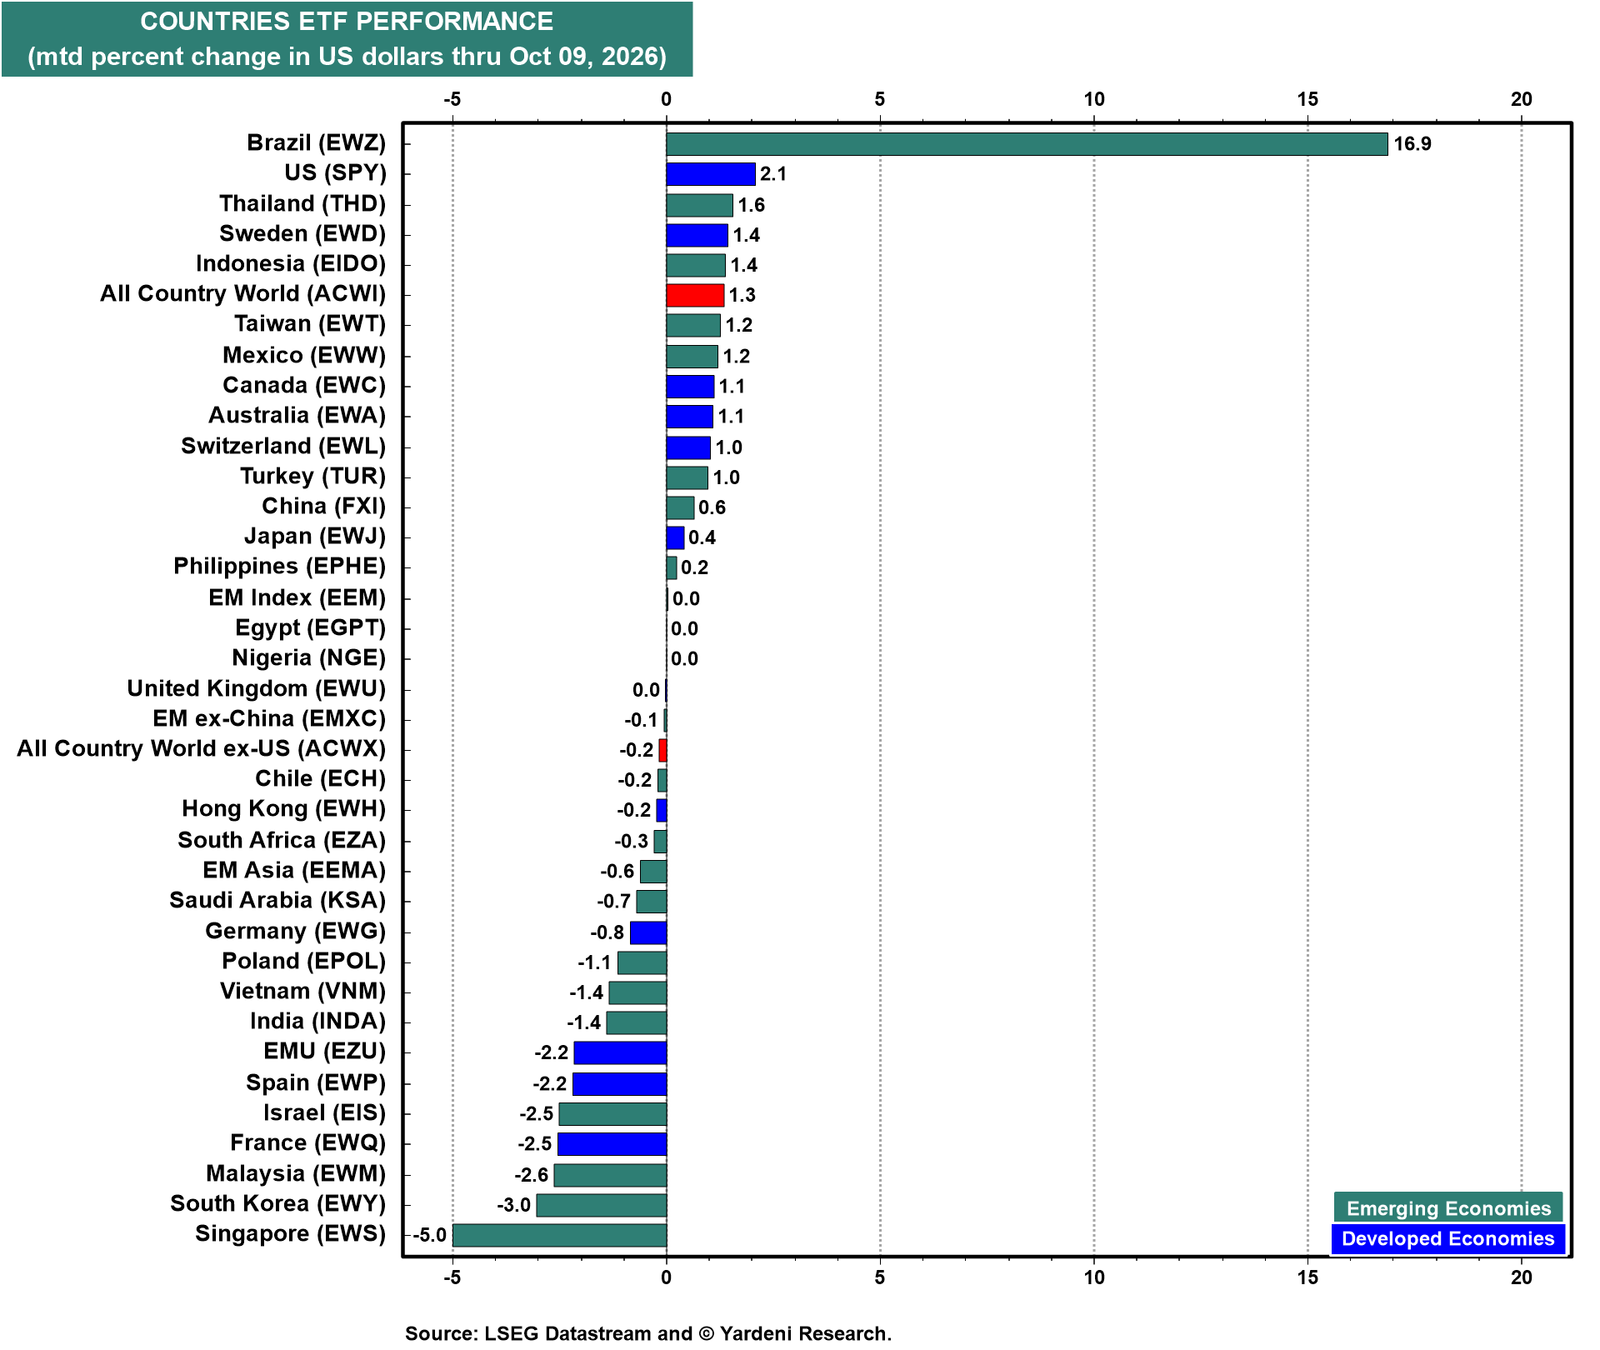
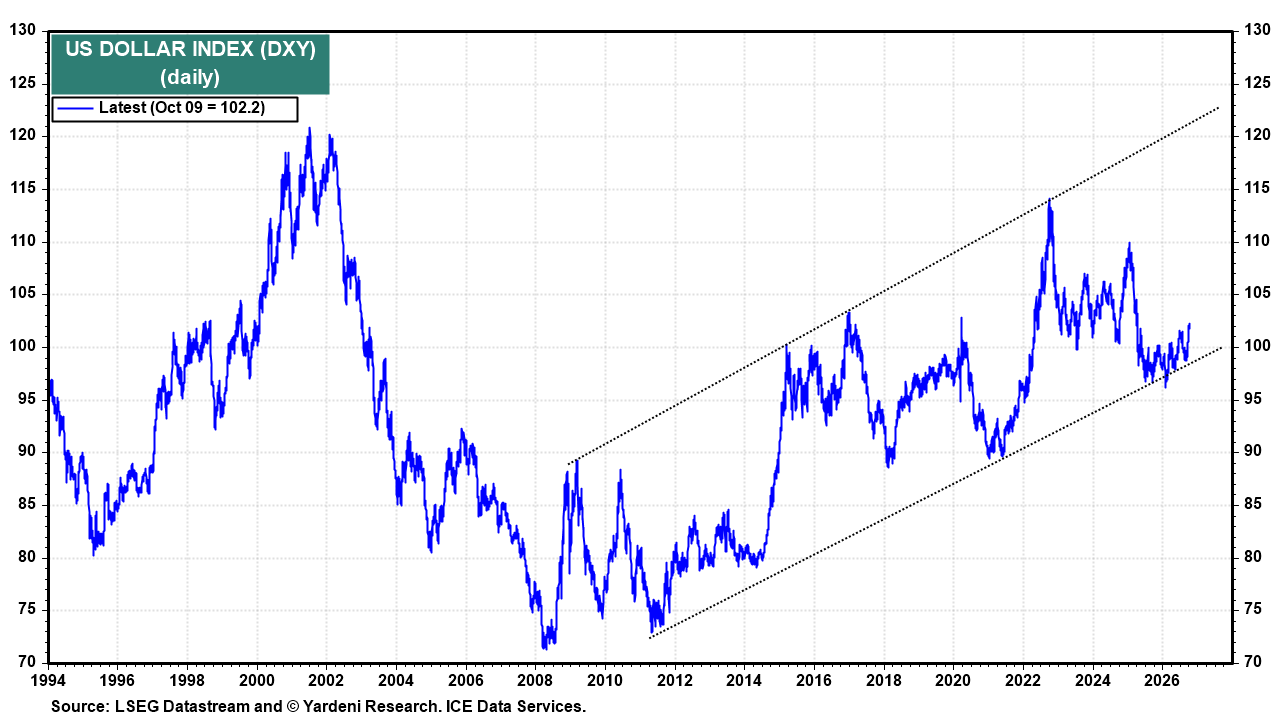
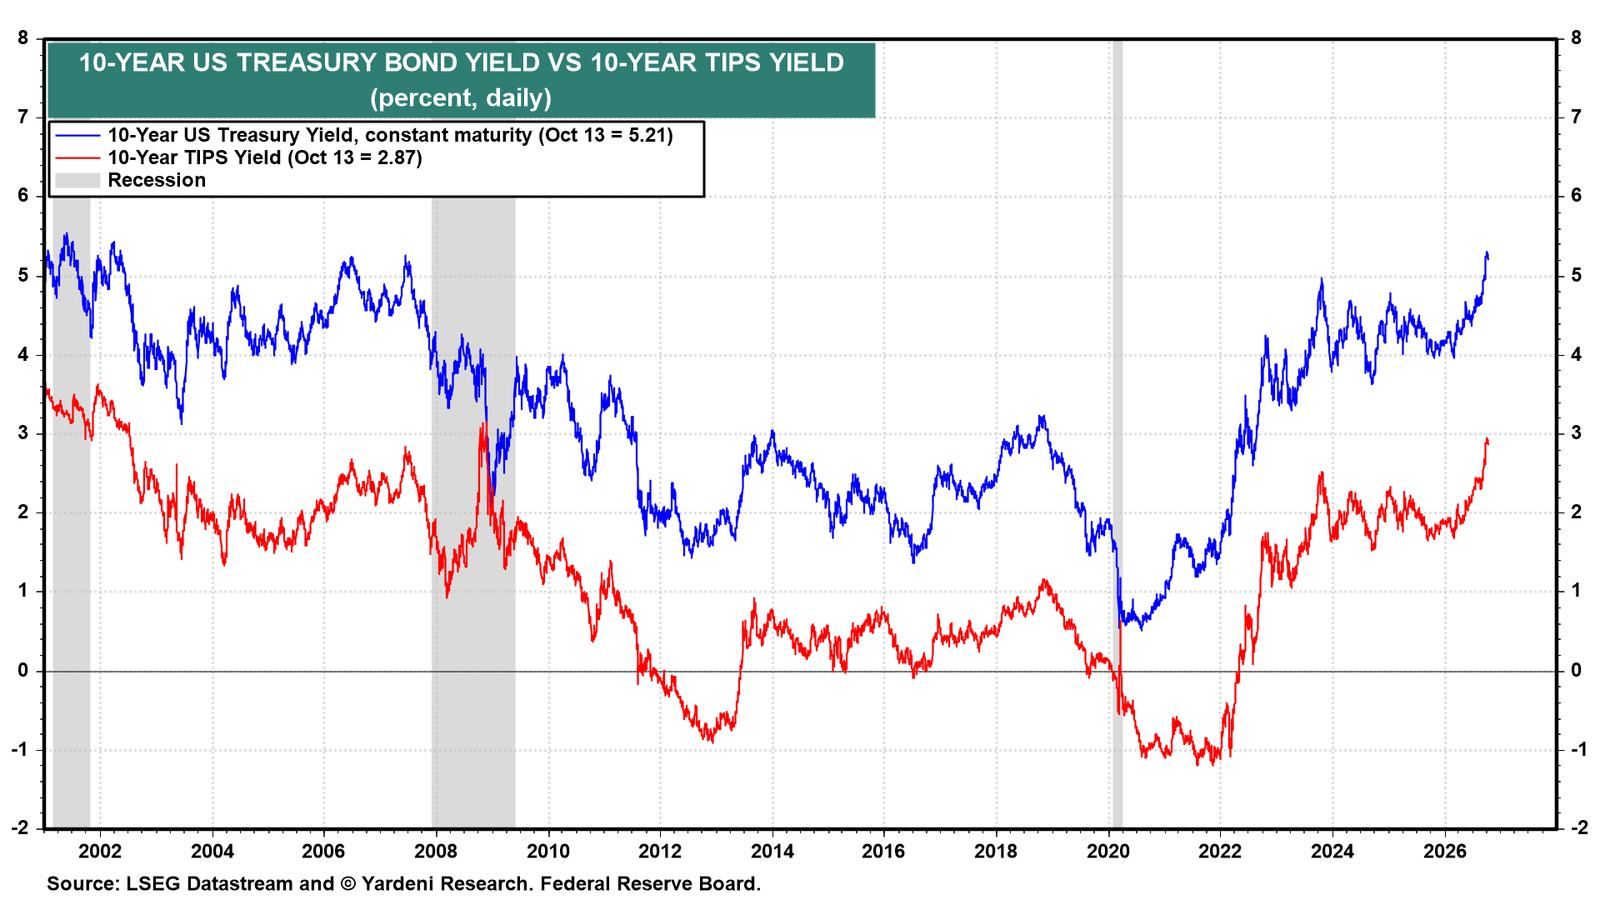
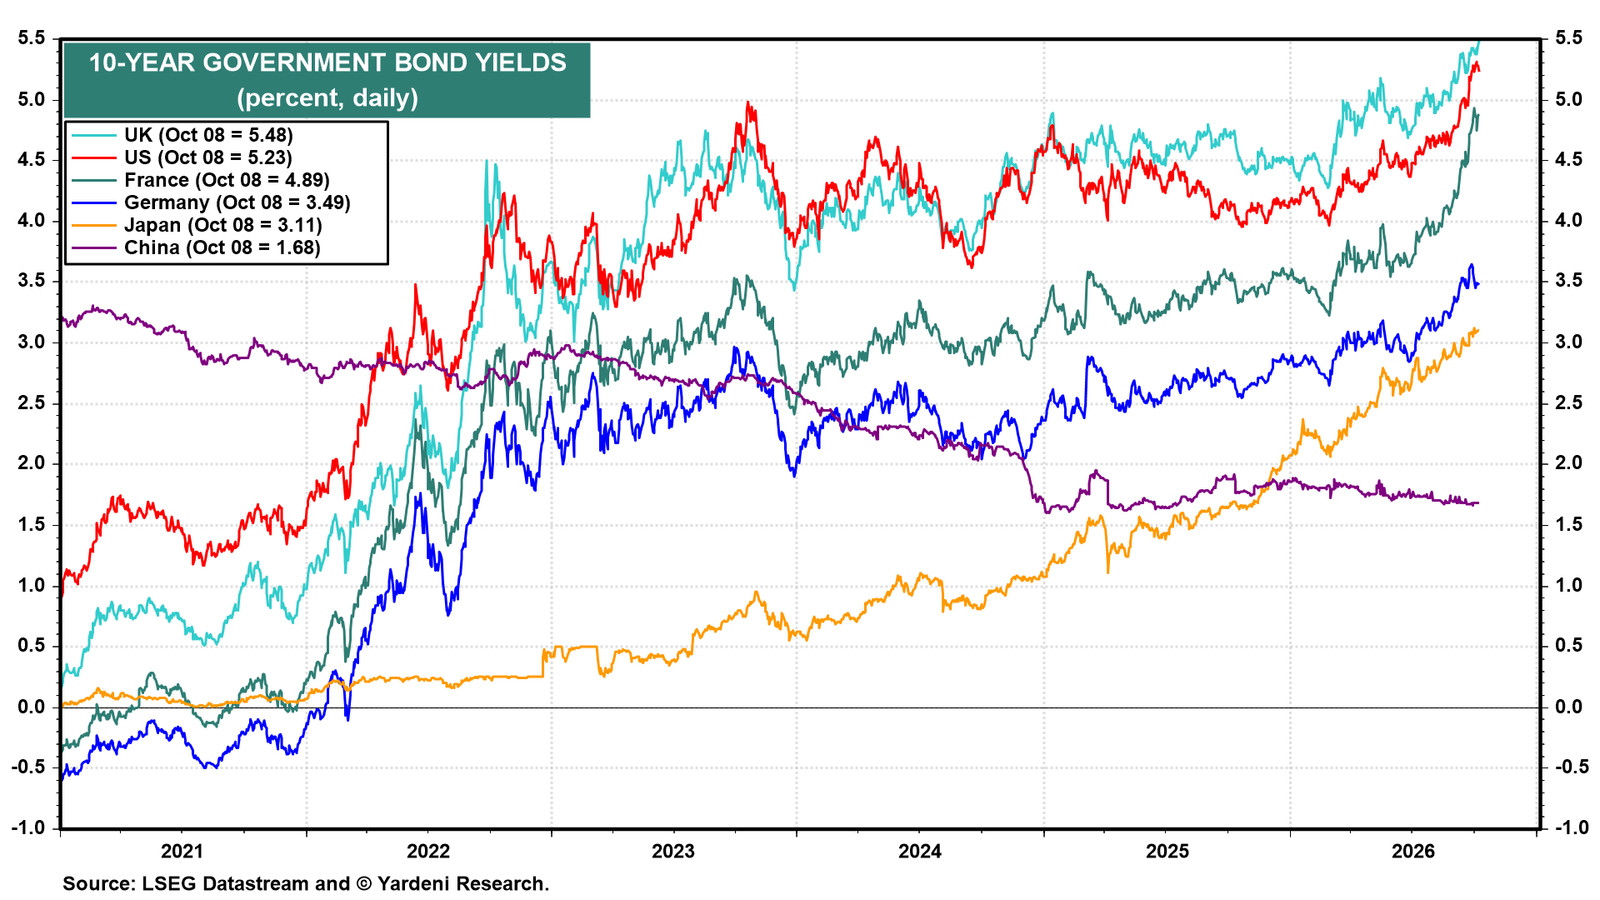
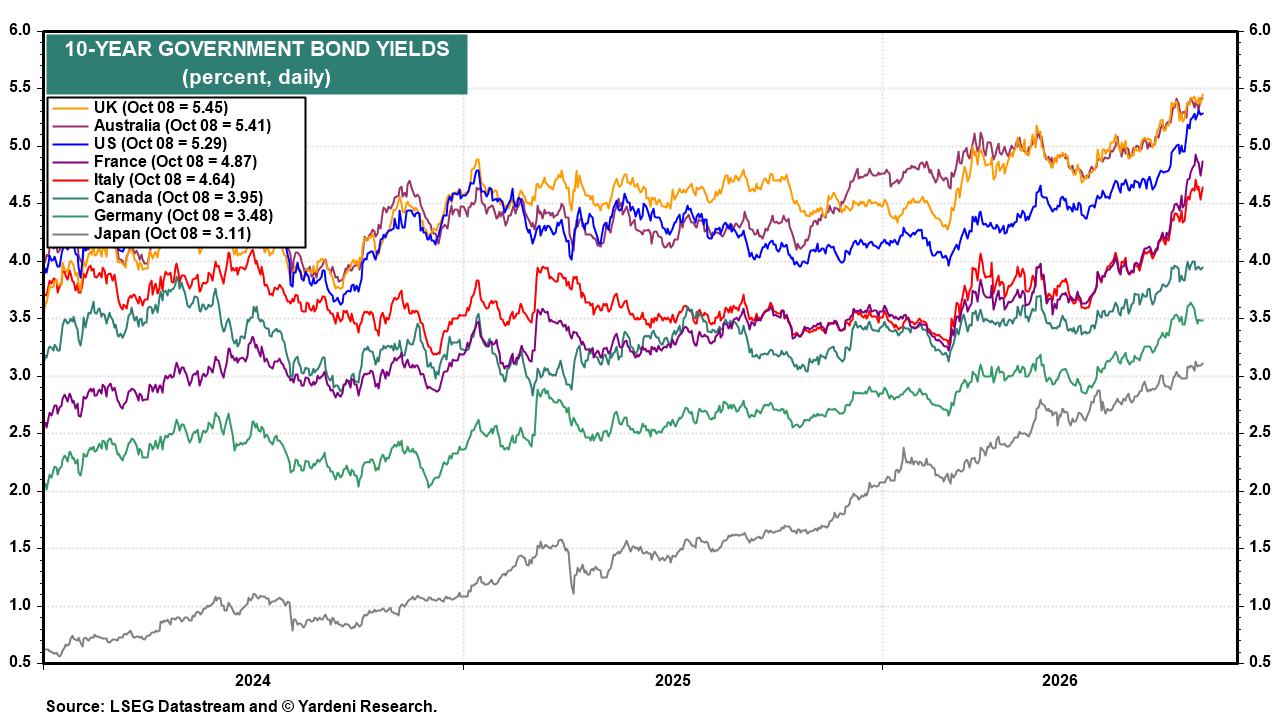
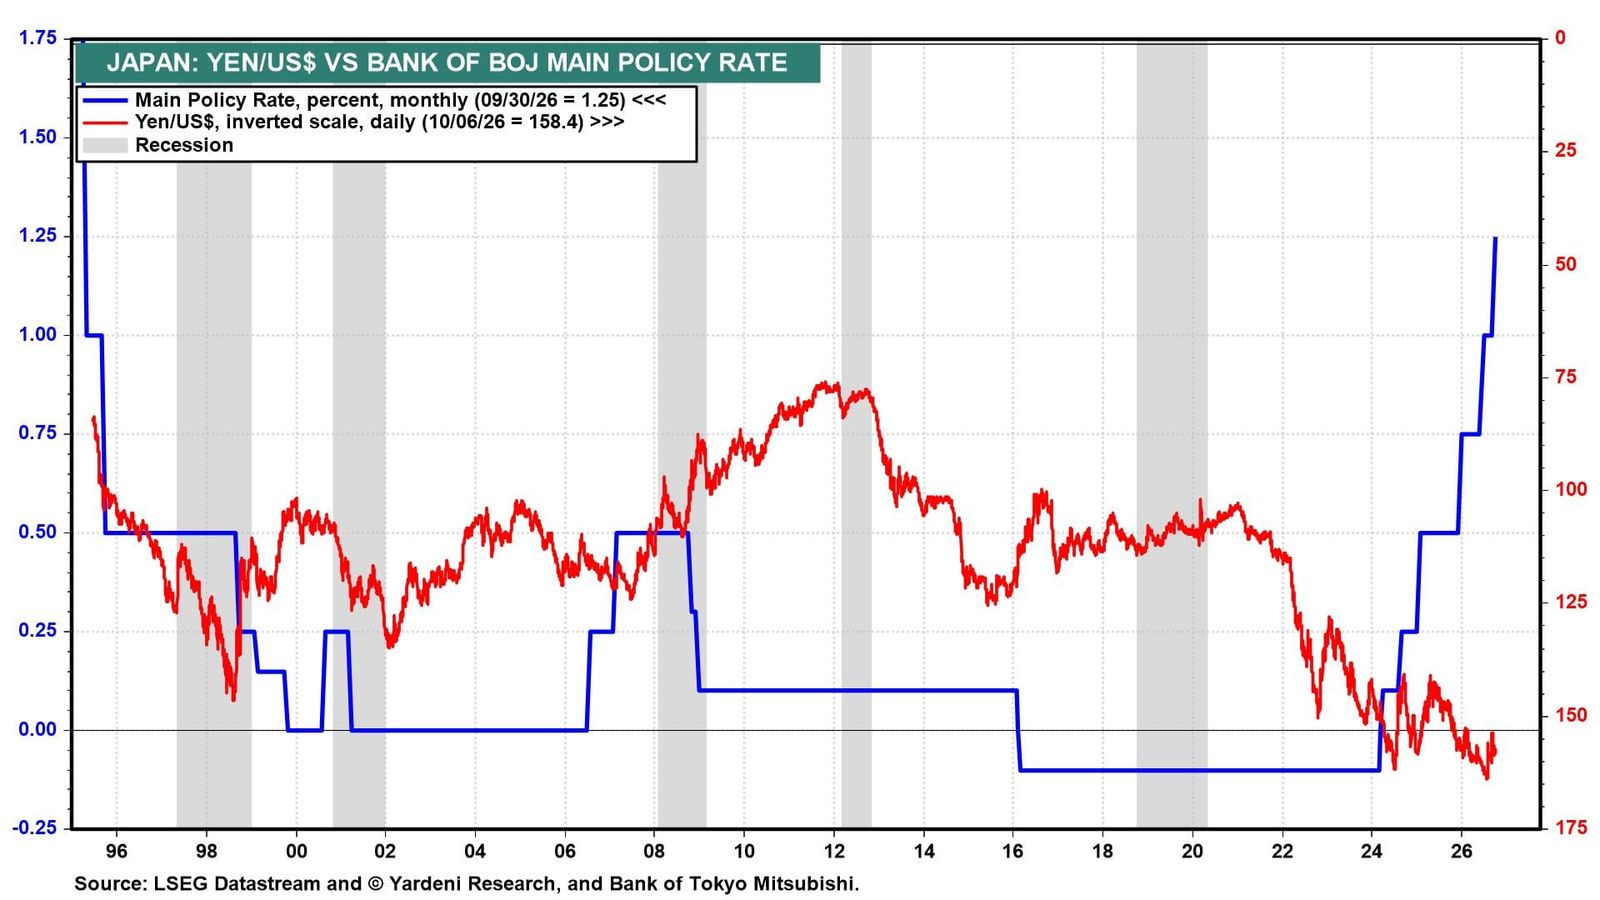
Yardeni QuickTakes GLOBAL MARKET CALL: The Fog Of War Is Lifting As we’ve flagged in recent weeks, an end to the conflict in the Middle East should see many foreign stock markets outperform the US. Lower oil prices reduce global inflationary pressures, give central banks room to ease policy, and tend to benefit oil-importing economies, particularly in emerging markets, more than the US, which exports oil. Last week’s tape delivered exactly that, with Asia leading the Go Global trade higher. Here's more: (1) Stay Home vs Go Global. EM ex-China (EMXC) dominated the week as the peace dividend filtered through to the regional names most exposed to lower energy prices and the AI capex cycle. The semiconductor trade continues to lead, which is why Korea and Taiwan sit at the top of this week's leaderboard. Korea led with an 11.0% gain for the week, with Taiwan, EM ex-China, the EM Index, Japan, and EM Asia all up between 3.7% and 7.2% (chart). External to Asia, moves were modest in either direction. The US SPY rose 0.7%, while China was the worst in the panel at -5.6%. The US MSCI outperformed the Developed World Ex-US MSCI from 2010 to 2024. Since then, they have performed about the same (chart). Emerging markets are doing the heavy lifting for Go Global (chart). (2) Sectors. In the Developed World, Telecom is up 52.2% ytd, Tech 23.4%, Energy 19.7%, and Basic Materials 18.7% (chart). In the Emerging Markets, Tech is up 35.8% ytd, followed by Industrials, up 19.0% (charts). (3) Yields. Sovereign bond yields are easing on hopes that the ceasefire holds. The US 10-year is at 4.46%, down from the May peak (chart). Falling oil prices give central banks room to lean dovish where the data permit. (4) Forex. The US dollar index rallied to 100.8 after the FOMC’s hawkish reset reinforced the rate-differential advantage in its favor (chart). Dollar strength supports the Stay Home trade at the margin and is a near-term headwind for the price of gold. The EM MSCI currency ratio is at 63.17, still pinned near the bottom of its multi-decade downtrend (chart). EM equities are outperforming despite the currency headwind. (5) Bank of Japan. Following the BOJ’s latest rate hike, the main policy rate is at 1.00%, with the 2-year JGB yield at 1.38% pricing in roughly two more hikes from here (chart). The 10-year JGB is at 2.61%, off its recent peak but still at multi-decade highs (chart). Yet the yen is at 160.86 against the dollar and looks ready to break through 160 despite the BOJ's tightening (chart). Intervention risk continues to surface. A weak yen is a problem that the BOJ can’t ignore much longer. We are sticking with overweighting Go Global, with Asia ex-China leading the way.
Analisi per settore — Materials, Energy, Health Care, ecc.
Nessun file di questo tipo nella finestra temporale.
Analisi macro discorsiva — view strutturale, temi di fondo
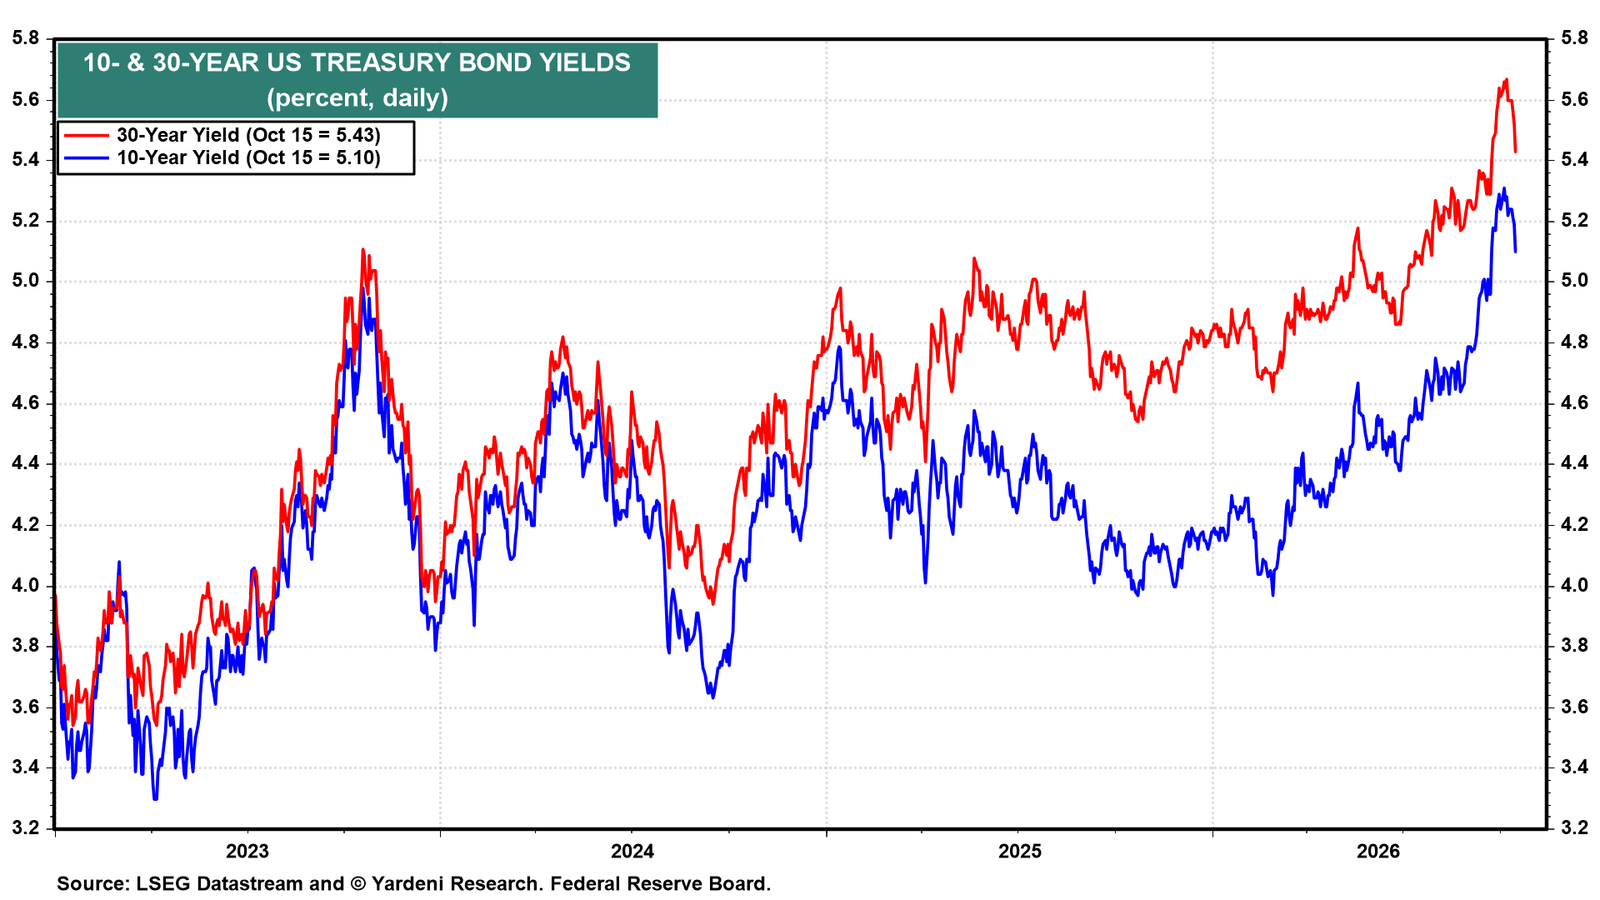
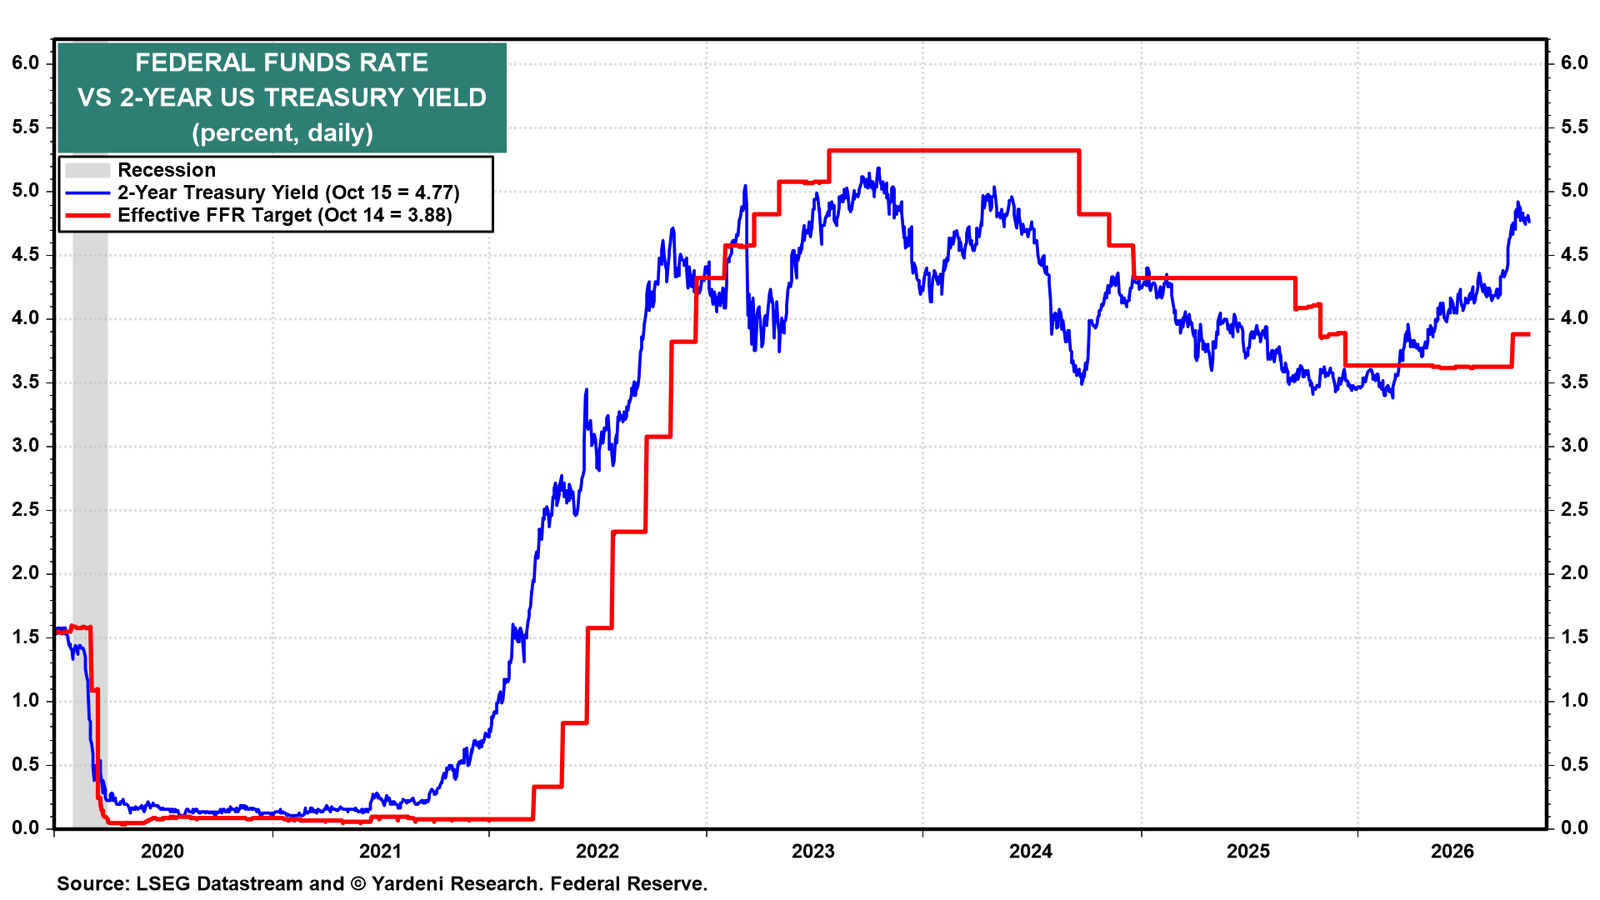
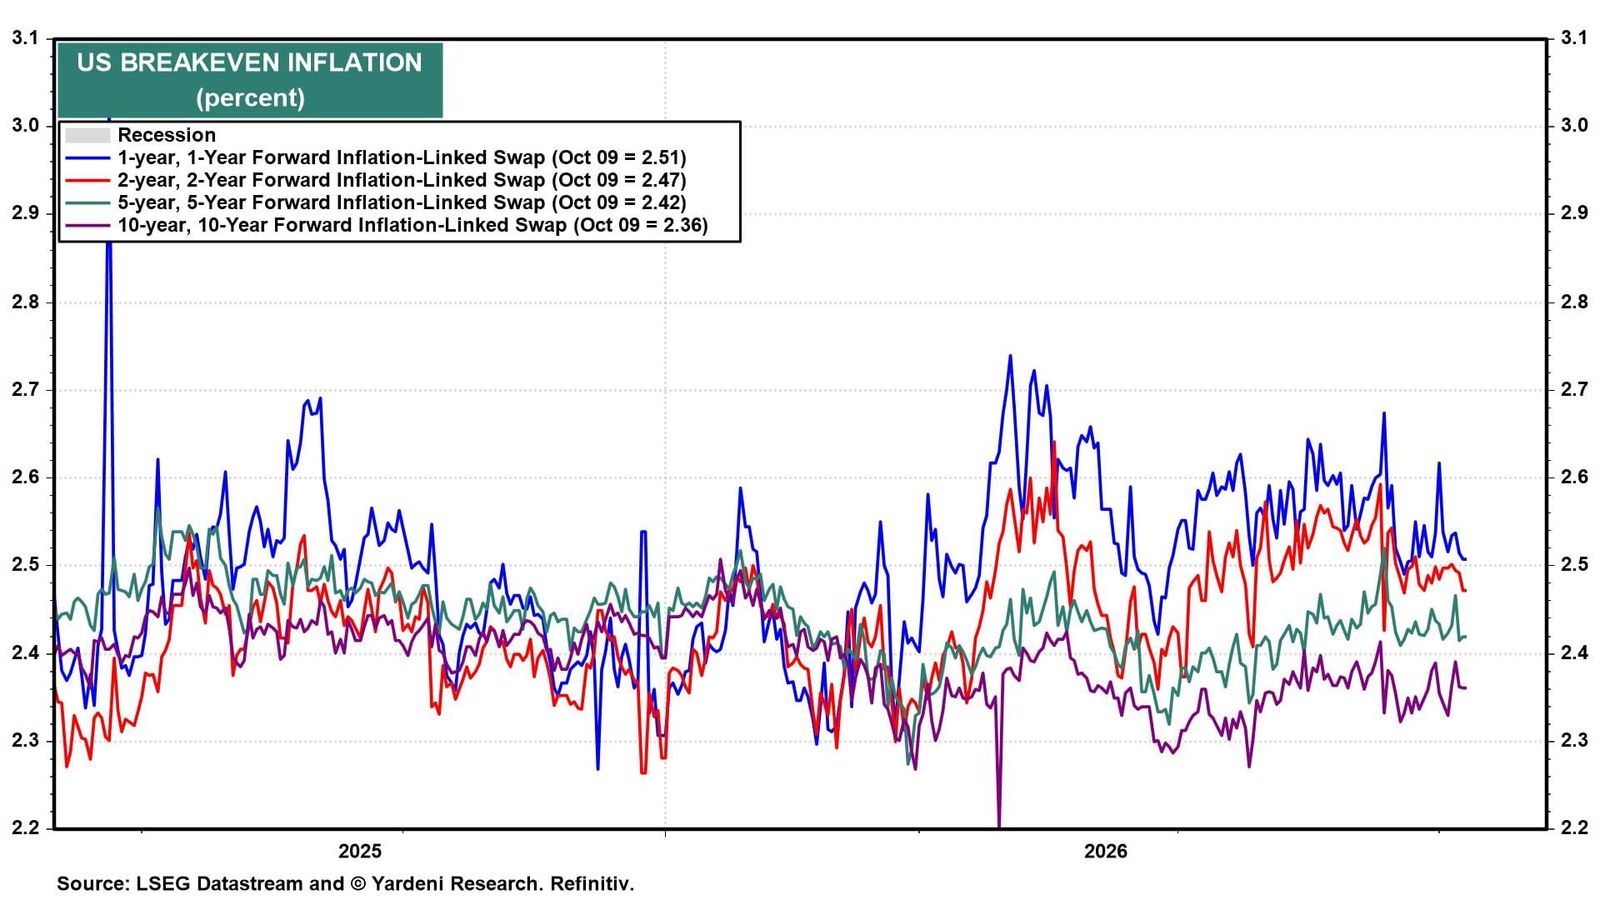
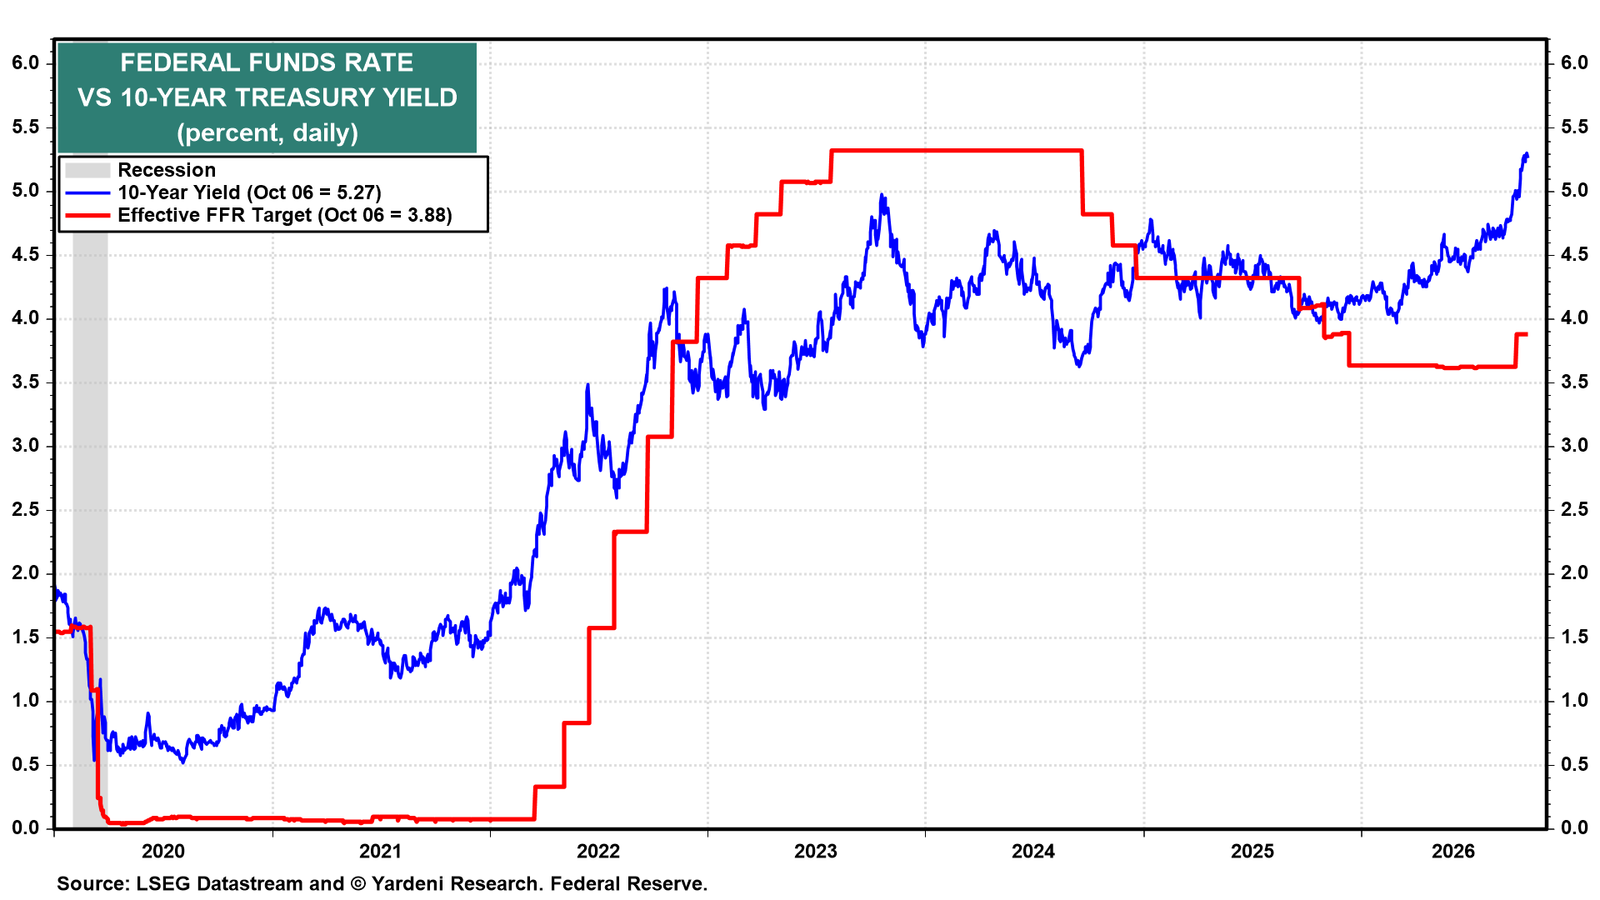
Yardeni QuickTakes A Hawk In Dove's Clothing ... June Swoon Is Back ... 'We Have A Task Force On That' We weren't surprised by most of the news following today's FOMC meeting. We expected the committee to pivot from April's easing bias to a tightening bias, and they did. We expected the committee to acknowledge that, in their dual mandate, the risk of higher inflation had risen, while the risk of higher unemployment had fallen, and they did. The FOMC's Summary of Economic Projections (SEP), including the Dot Plot, unambiguously confirmed the committee's hawkish pivot. We expected a June Swoon in the stock and bond markets because investors hadn't fully discounted our hawkish Fed scenario. The stock market swooned today as yields rose. The 2-year US Treasury note jumped to 4.20% today in response to the FOMC news (chart). On the other hand, we were blown away by Fed Chair Kevin Warsh's press conference. We thought he was a dove who favored lowering the federal funds rate (FFR) because he believes that AI is boosting productivity and economic growth while keeping a lid on inflation. Instead, he hammered home a strict, orthodox message on inflation with a strong commitment to price stability. Here are six key takeaways from June's FOMC meeting and Warsh's first press conference as Fed chair: (1) A more hawkish interest-rate outlook. In the June SEP, the median FFR projection for the end of 2026 increased from 3.4% in March to 3.8% (chart). The 2027 projection increased from 3.1% to 3.6%. The June Dot Plot pulled off a massive hawkish pivot compared to March. Over the rest of this year, nine meeting participants expect hikes: three expect one more, five expect two, and one expects three more (chart). Eight participants see rates remaining unchanged this year, while one still expects a cut. Warsh abstained, so there are 18 rather than 19 dots. (2) No more easing bias in the policy statement. In the FOMC's policy statement, the April language hinting at future rate cuts was replaced by a much shorter, blunter sentence committing to inflation control: "This Committee will deliver price stability." Warsh stripped the document down from over 300 words to a very brief 130 words. The text now narrowly outlines present economic facts (e.g., solid growth, energy-driven inflation) without any forward guidance. Nevertheless, the Dot Plot clearly reflects the hawkish shift we expected. (3) Acknowledgment of the economy's resilience. Warsh characterized economic growth as solid, broad-based, and supported by strong fundamentals, stating that “economic activity is expanding at a solid pace despite elevated uncertainty.” He said that “productivity growth and capital investment both [are] strong” and that “job gains have kept pace with the workforce.” He also emphasized that the labor market is “stable” and that “the jobs data has been moving in a good direction.” The SEP's projection for the unemployment rate at year-end was lowered from 4.4% in March to 4.3% (chart). It is projected to remain there in 2027. (4) Acknowledgment of persistent above-target inflation. Again, we were blown away by how often Warsh stressed that the FOMC's number-one goal was to bring inflation down to 2.0% y/y. He described inflation as persistently elevated, noting that it has been “running well ahead of the Fed’s … 2% [goal] … for more than five years” and said it “remains elevated … in part reflecting supply shocks.” While acknowledging uncertainty around inflation’s “first- and second‑round effects,” he stressed that the key risk is the prospect of inflation broadening. At the same time, he emphasized that inflation is controllable, arguing that it is “primarily determined by monetary policy” and that “inflation is a choice,” underscoring his view that any potential build‑up in inflation pressures reflects policy decisions rather than an embedded acceleration dynamic. The SEP projections for the core PCED inflation rate were raised from 2.7% to 3.3% this year and from 2.2% to 2.5% next year (chart). (5) The restrictiveness of the policy rate. Warsh suggested that the current policy stance is unevenly restrictive rather than uniformly tight. Overall, his remarks imply that the FFR is partially restrictive but not broadly so, with tightening effects concentrated in certain areas rather than the economy as a whole. The SEP shows that the "longer-run" (a.k.a. the neutral) FFR projection remained at 3.1%, in a 100bps range from 2.9% to 3.9% (chart). Warsh did not reveal whether he gives any credence to the concept of a neutral FFR. (6) Warsh aims to reform the Fed. Warsh announced that he is launching five task forces to overhaul key operational areas of the Fed: monetary policy frameworks, communications, regulatory scope, balance-sheet operations, and data and modernization. Warsh used the exact phrase "we have a task force on that" to deflect questions four times during his Q&A session. Whenever a reporter tried to pin him down on a specific market pain point, economic distortion, or policy prediction, he systematically dodged by pointing to his new five-panel security blanket.
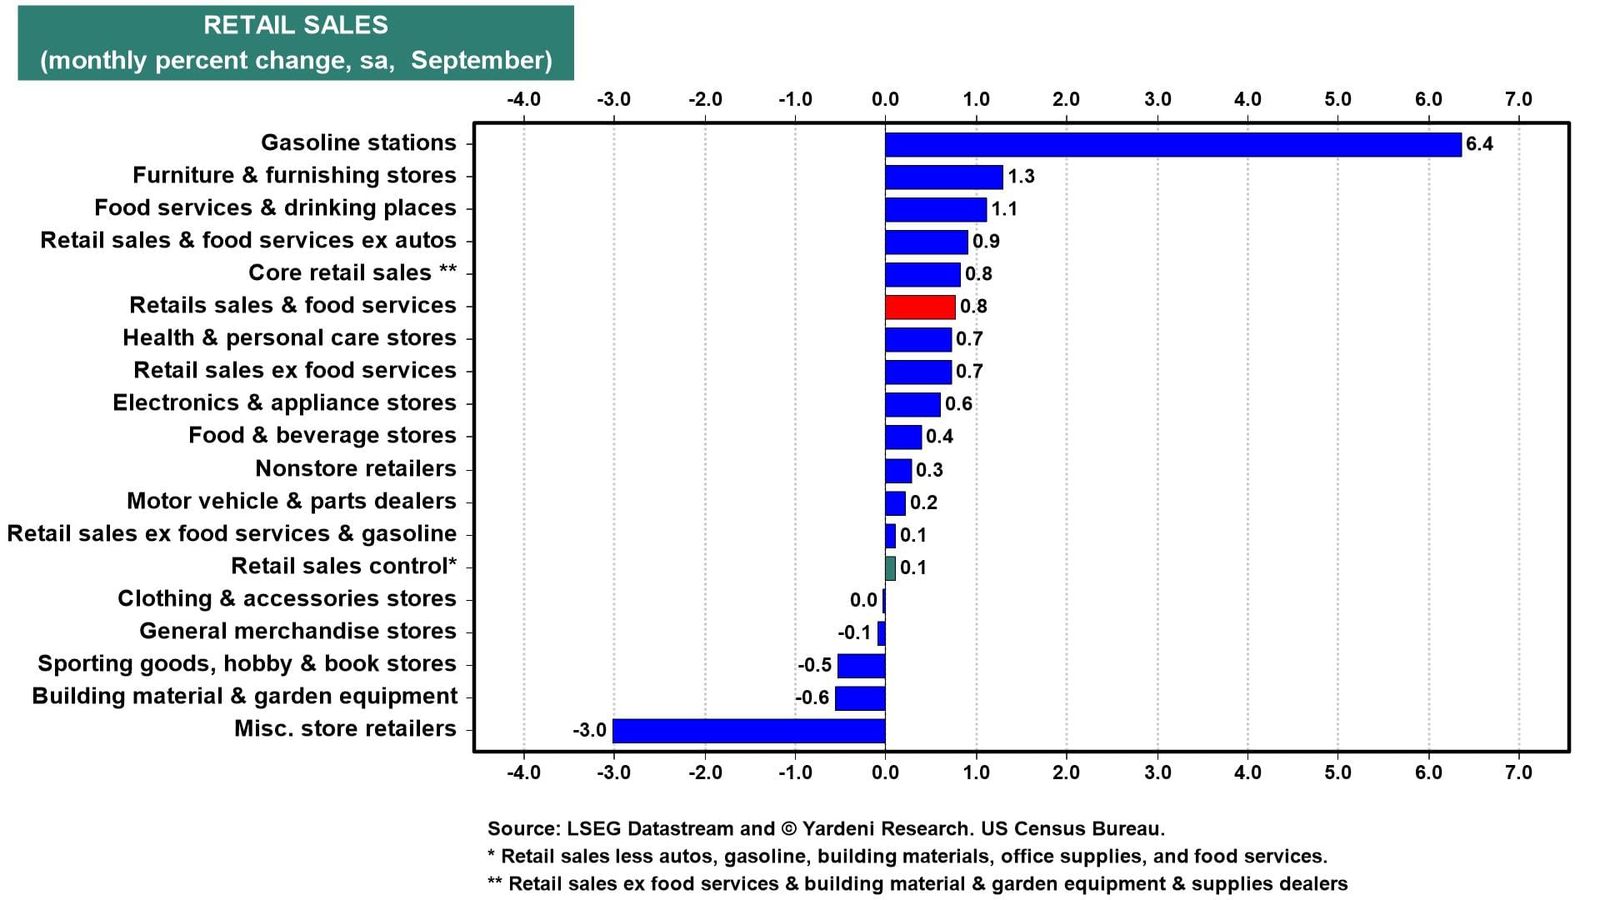
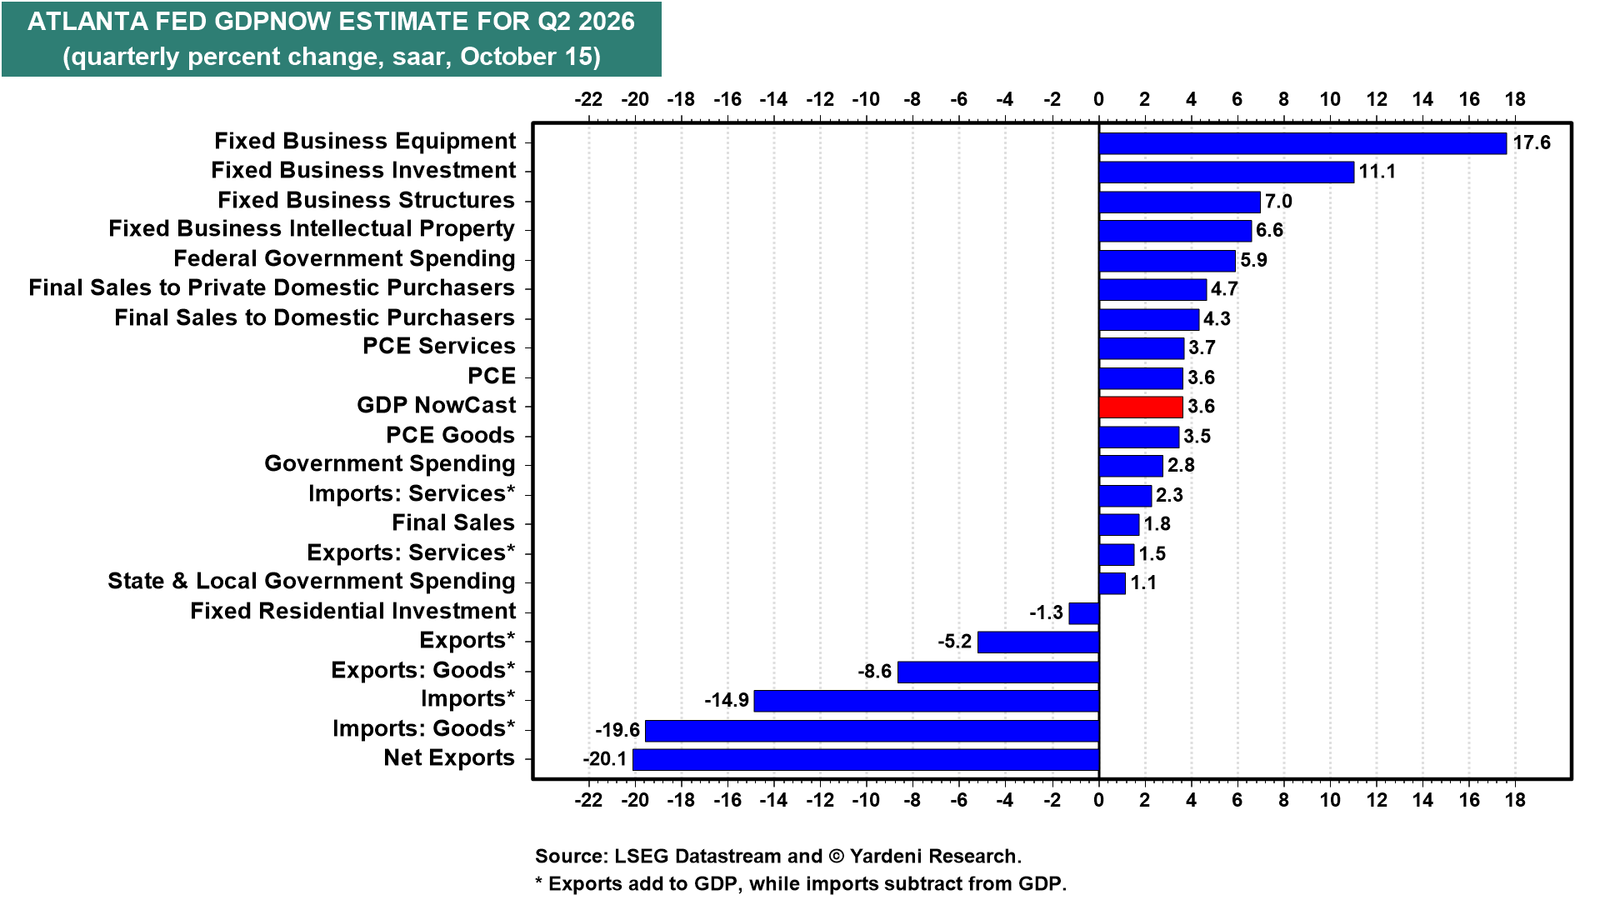
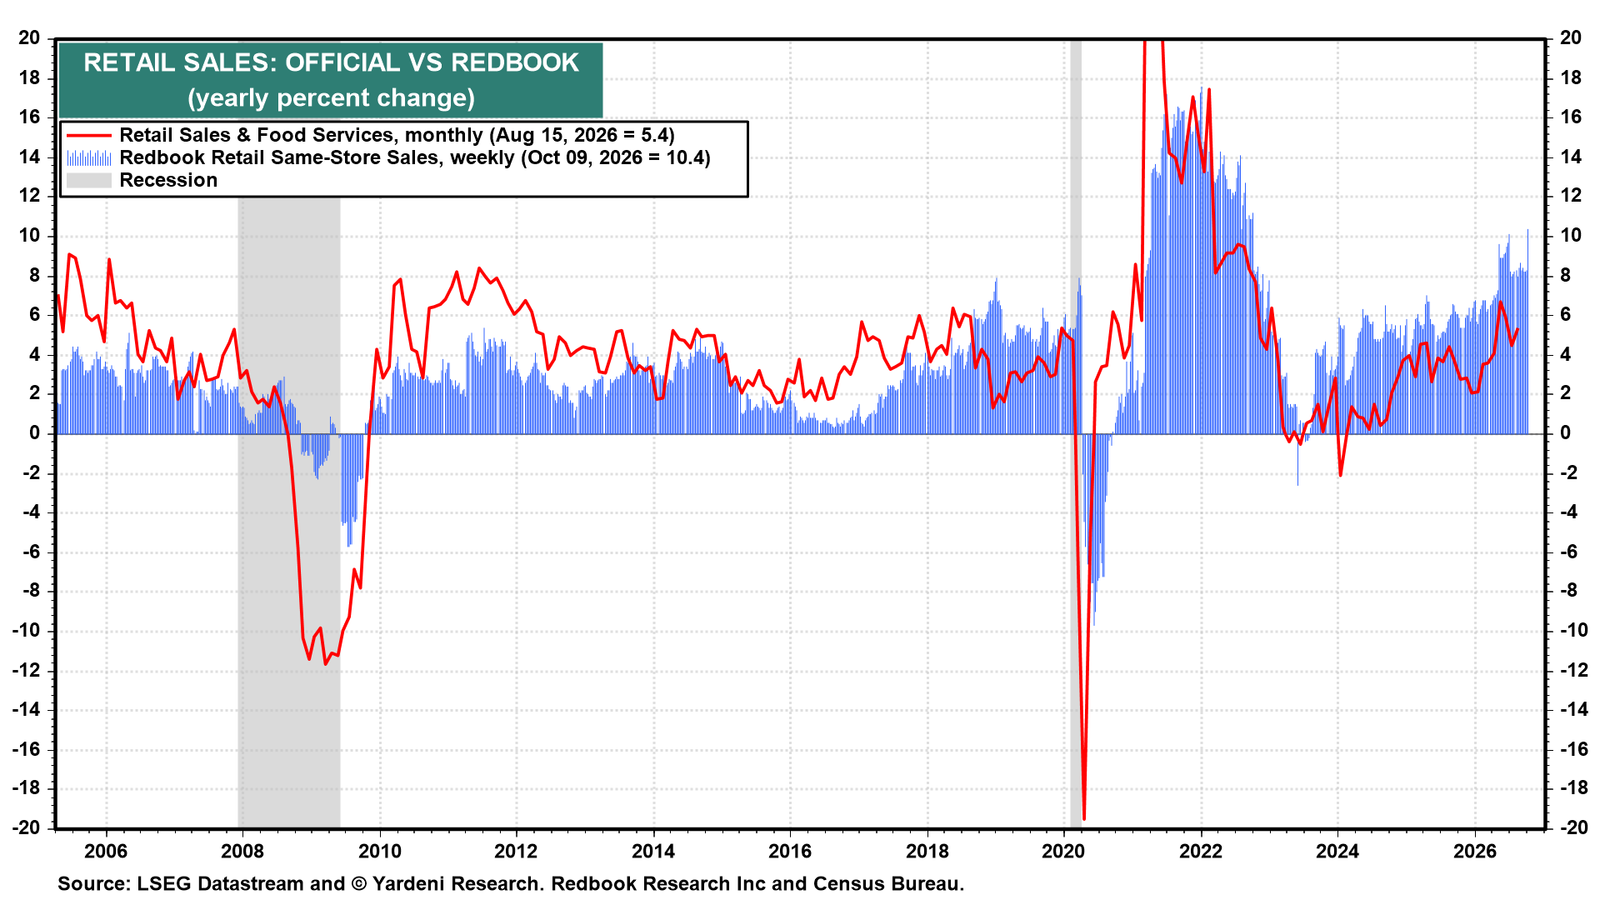
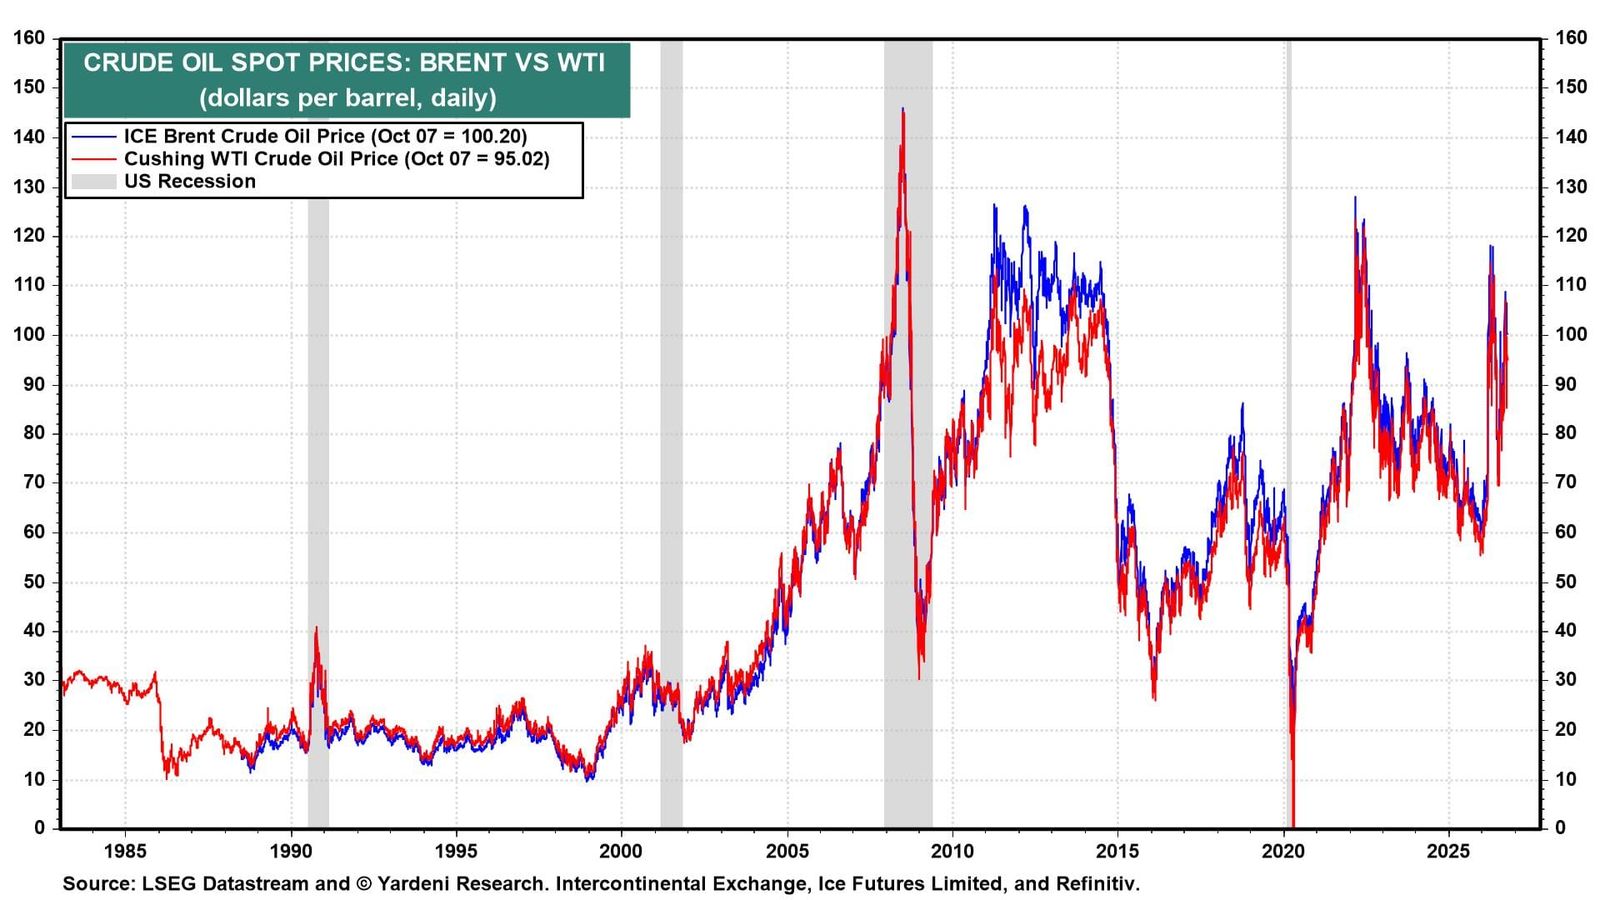
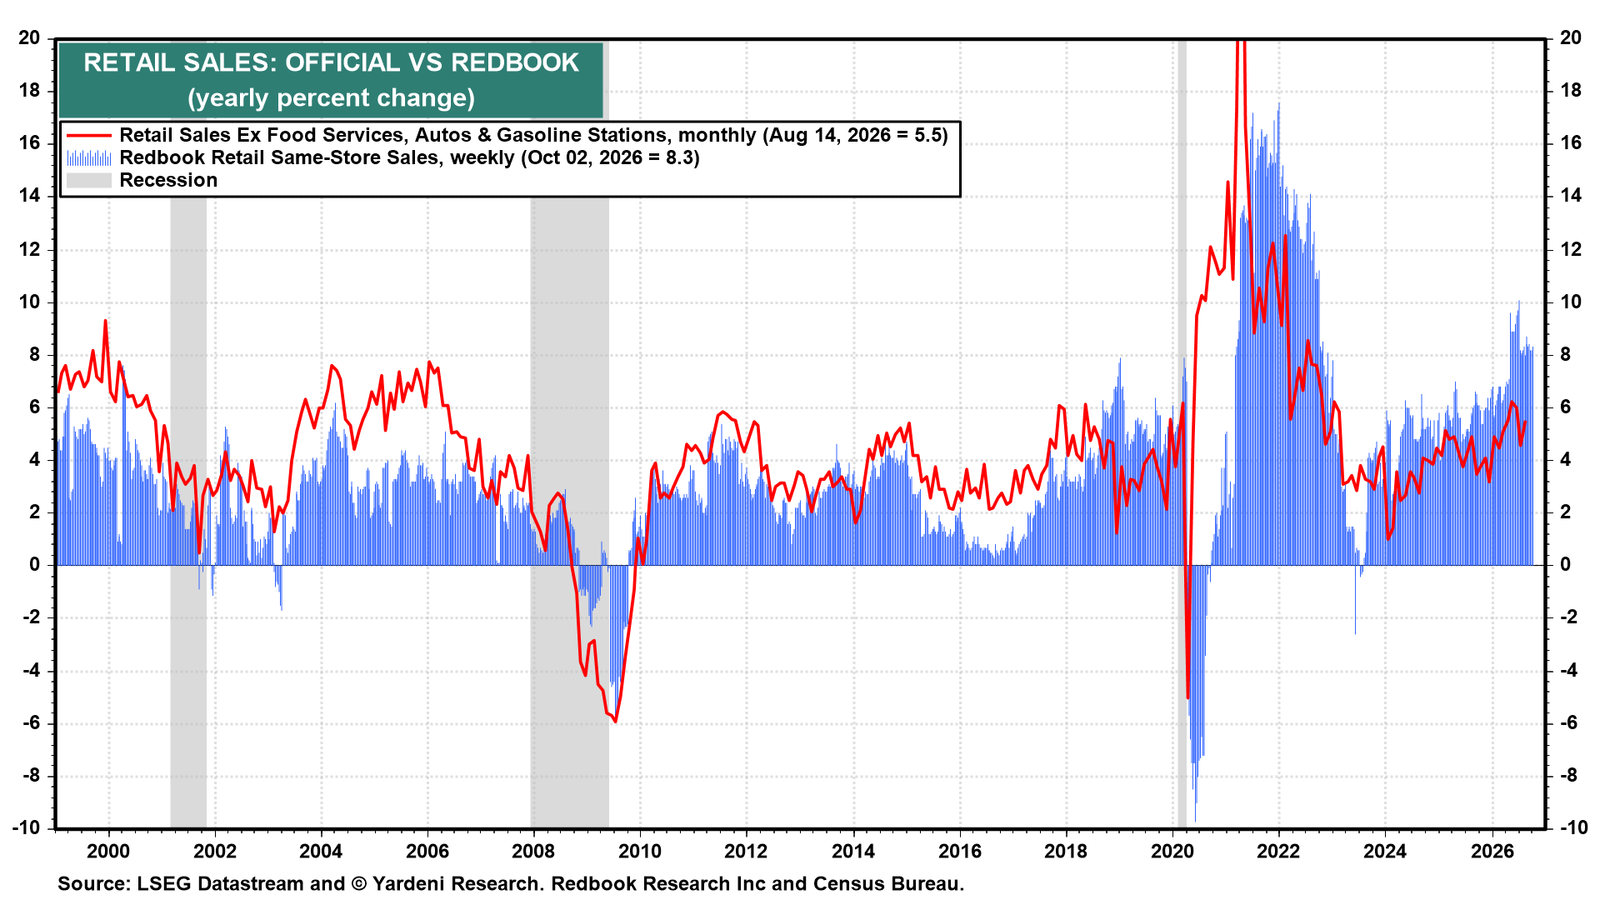
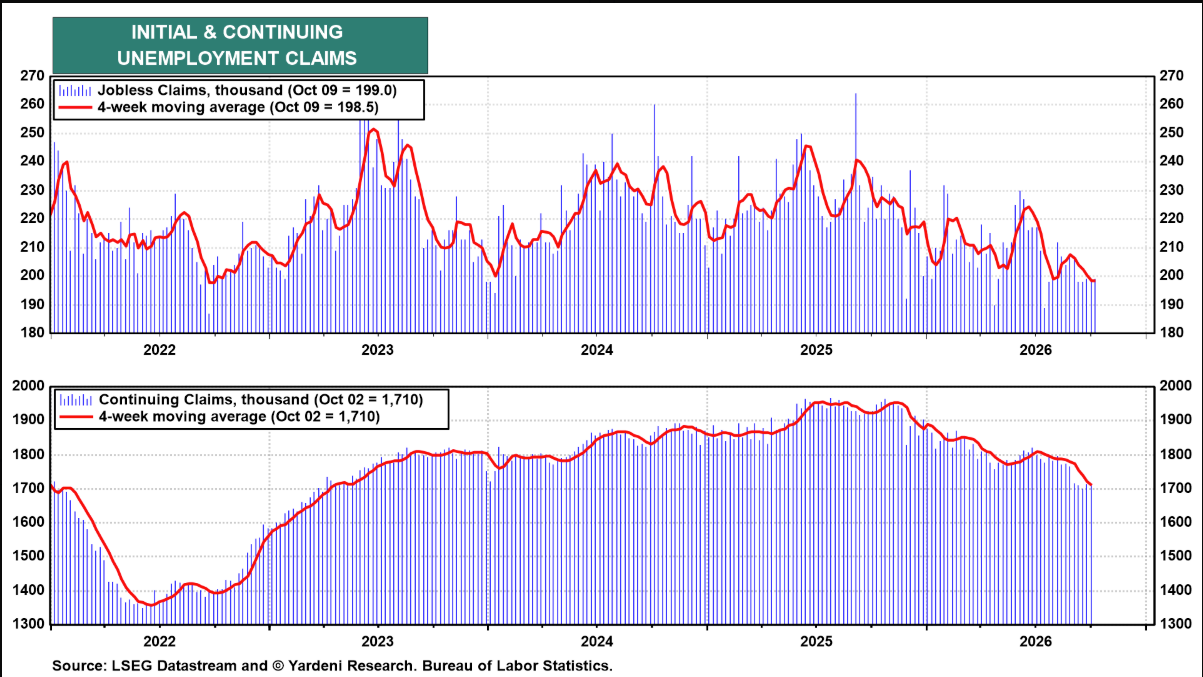
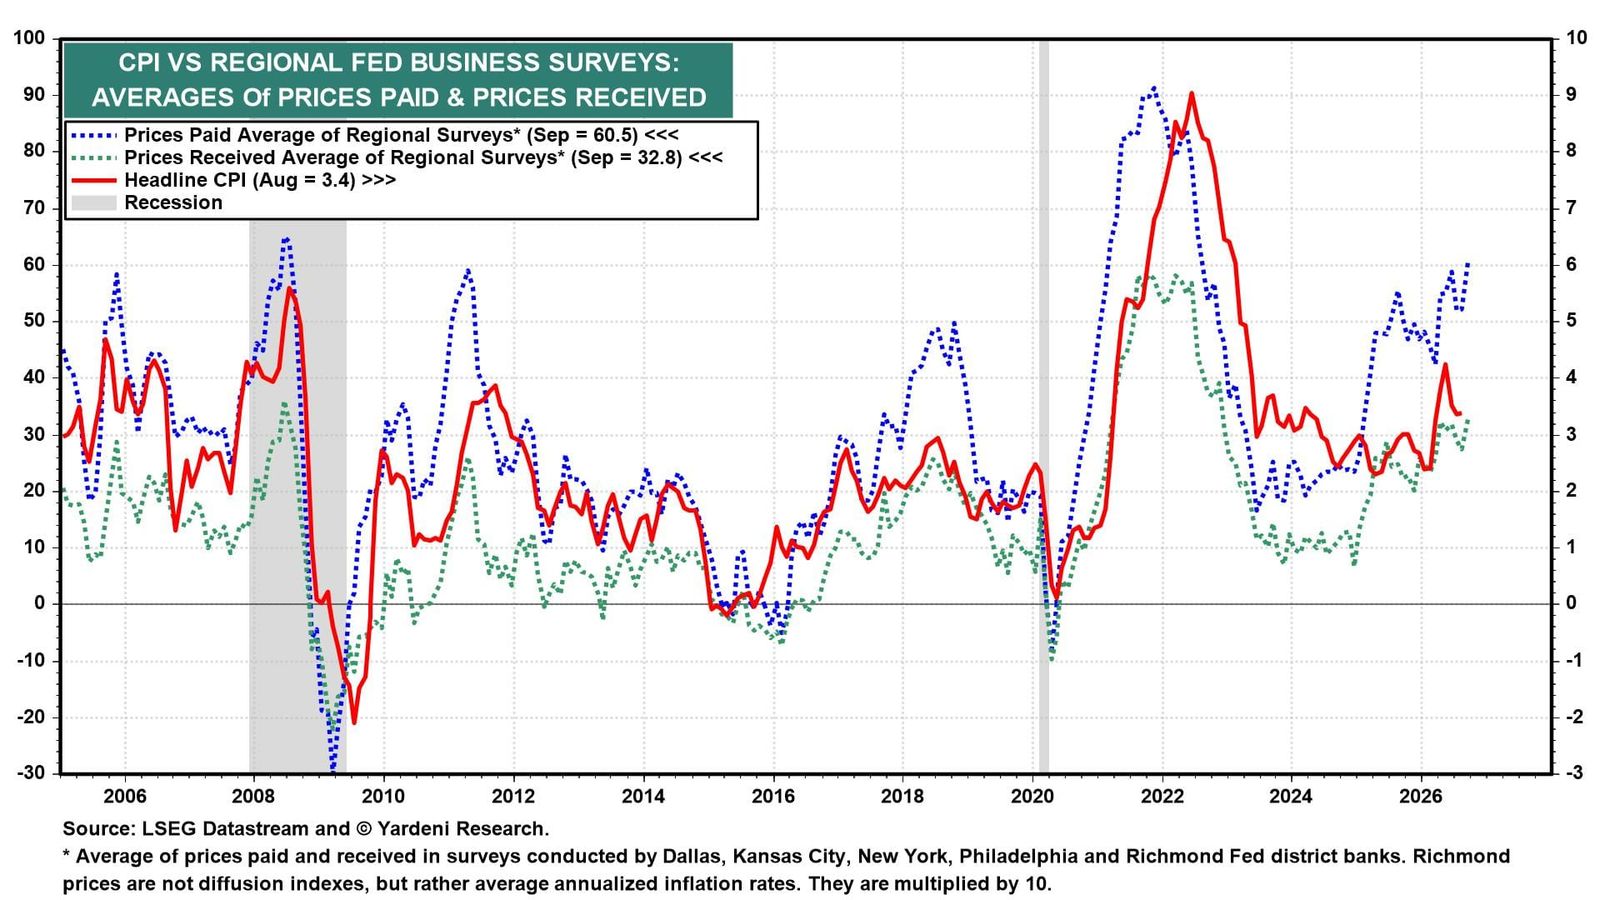
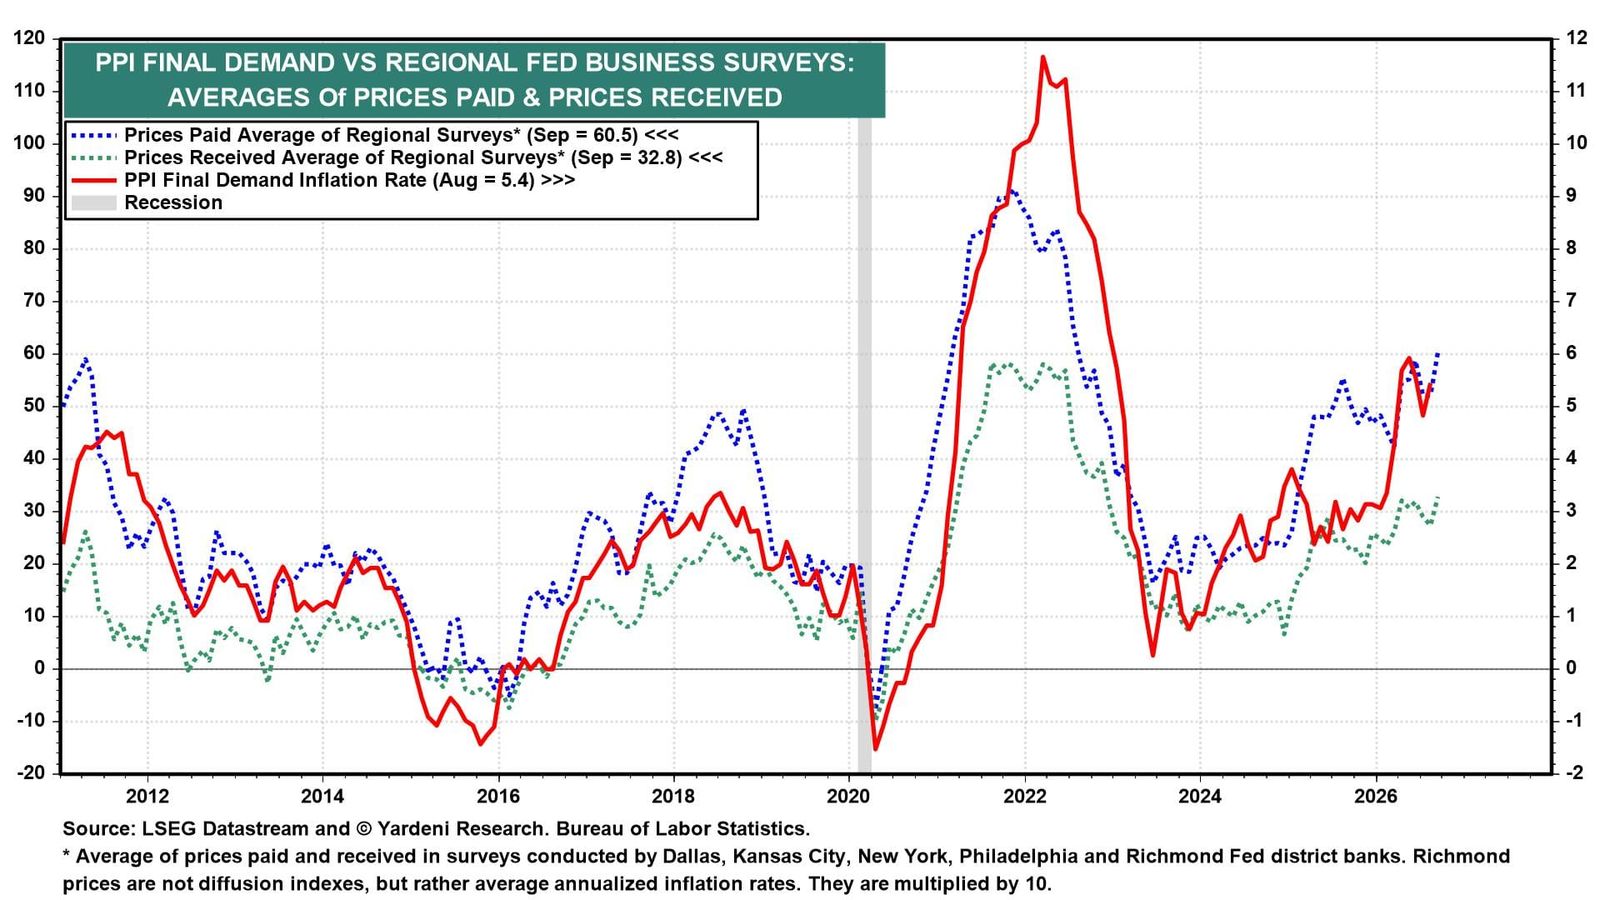
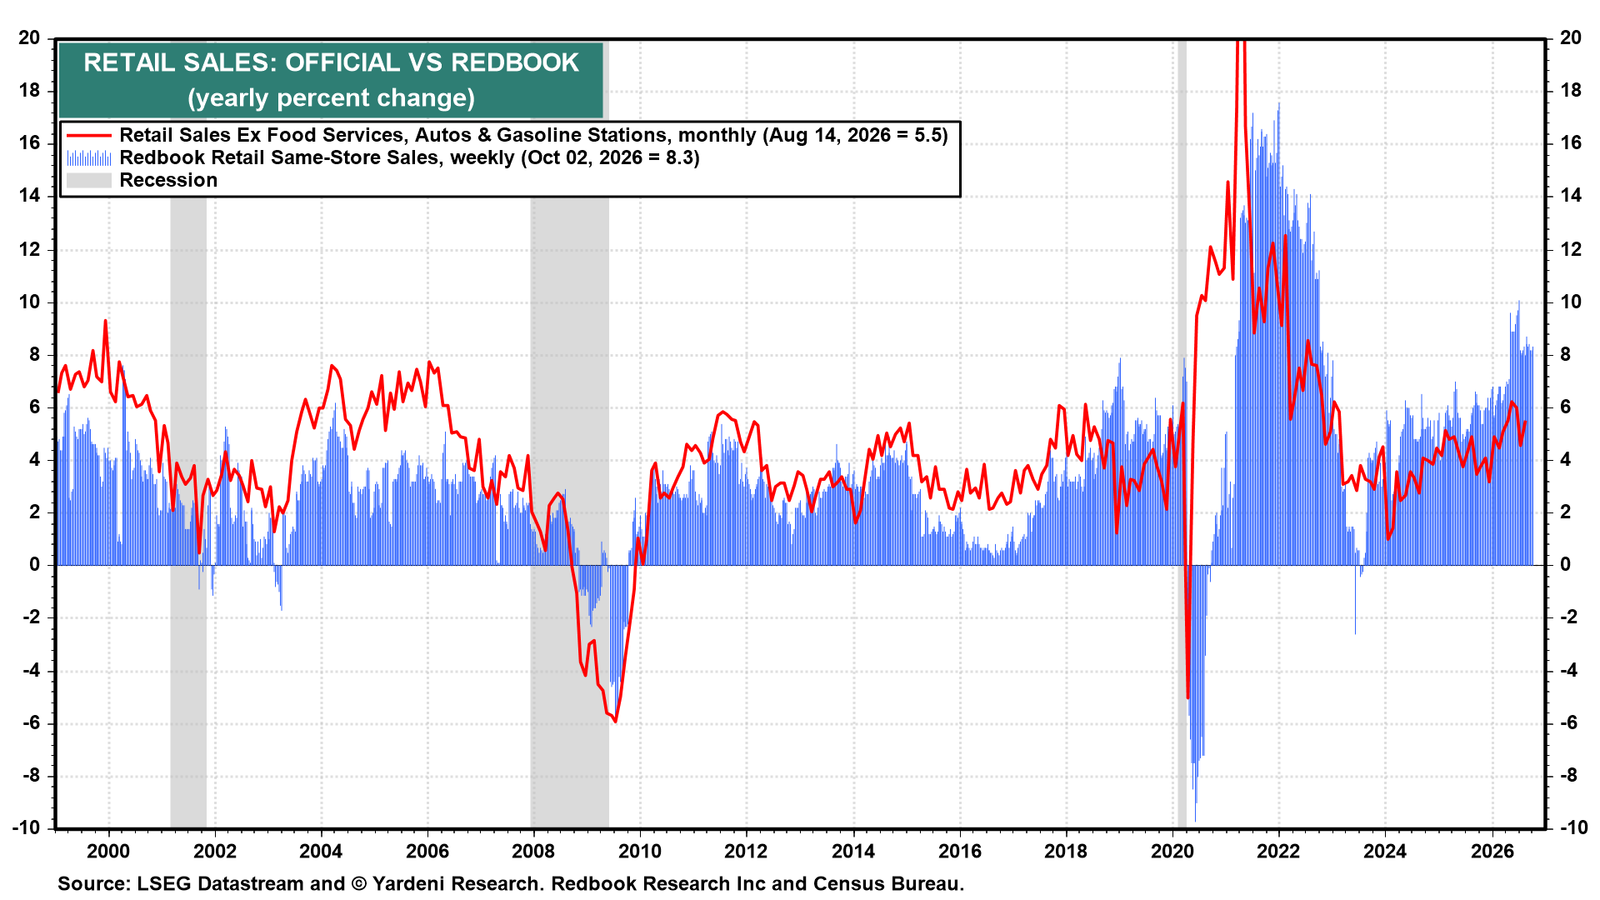
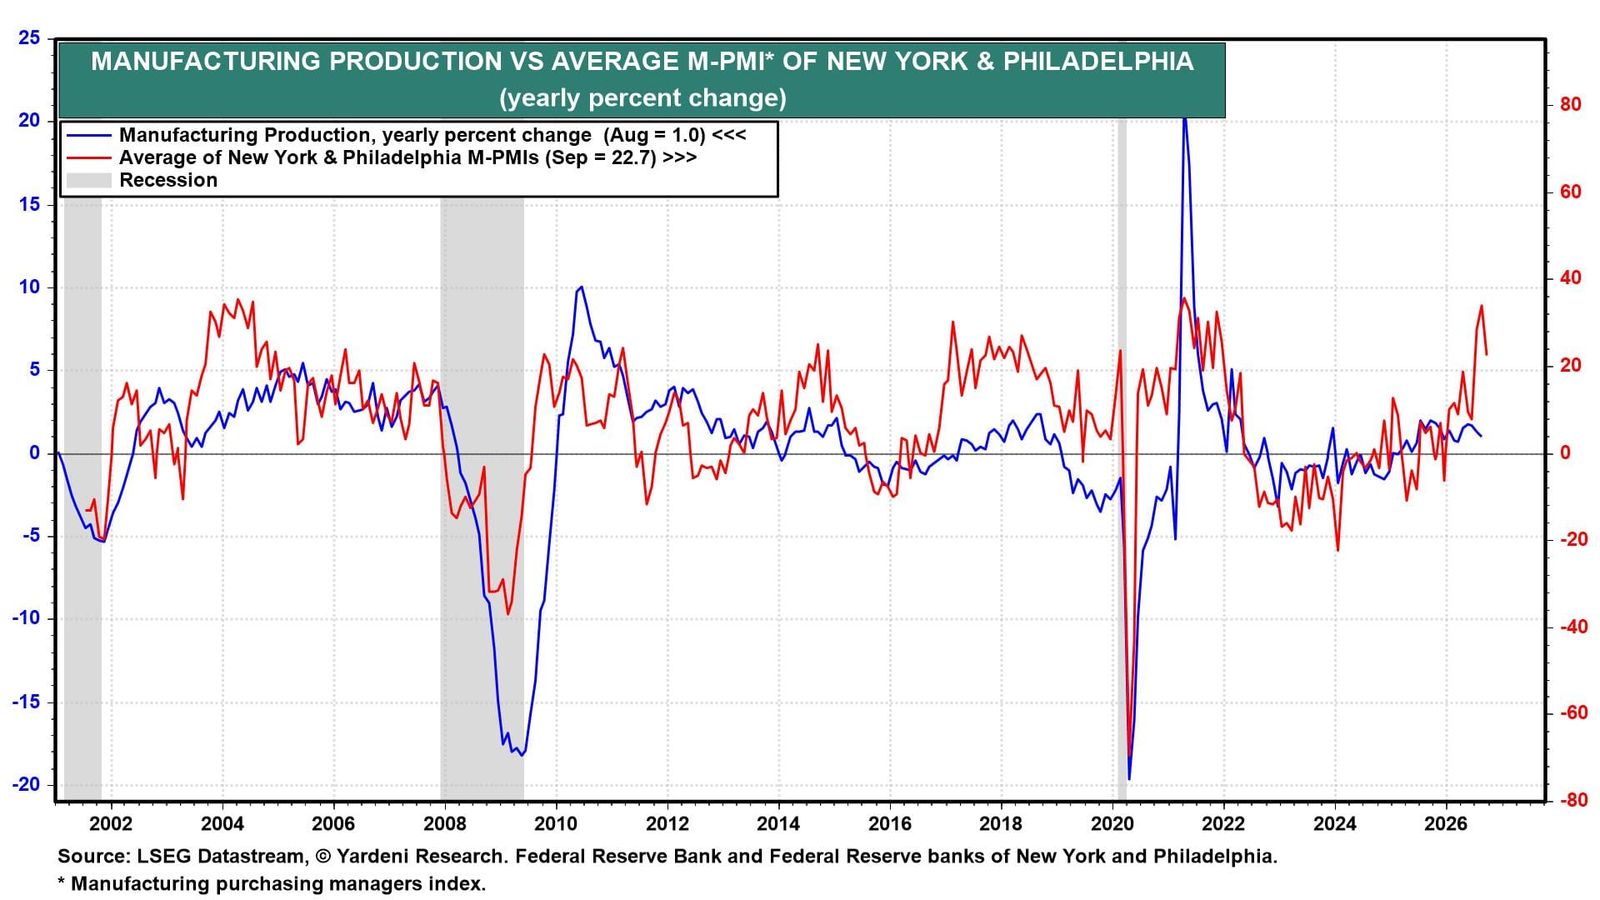
Yardeni QuickTakes Geopolitical Release Valve Taking Pressure Off Resilient Economy The US-Iran interim peace deal is shaky; but if it holds, it will end the US blockade of Iranian ports and reopen the Strait of Hormuz to commercial shipping. Now comes a 60-day negotiating period to hammer out a permanent agreement, centered on restricting Iran's nuclear program. The price of Brent crude oil extended its sharp decline following the peace deal announcement, with markets pricing in the return of Iranian barrels and the normalization of Persian Gulf shipping lanes (chart). With the geopolitical pressure valve beginning to release, the latest economic data tell an encouraging story about how well the US economy has held up under the strain of higher energy prices and elevated geopolitical uncertainty. Consider the following: (1) Retail sales. May retail sales rose 0.9% m/m, marking the fourth straight month of expansion (chart). Much of the headline increase was driven by a 3.4% m/m surge in sales at gasoline stations, as prices at the pump averaged $4.50 per gallon in May. However, even after excluding autos and gasoline, retail sales still rose at a solid 0.5% m/m pace. Eleven of the 13 major categories posted gains, suggesting broad-based resilience in consumer spending. Control-group retail sales, used in calculating GDP, rose a solid 0.7% m/m following a healthy gain of 0.5% in March (chart). We were not surprised by the blockbuster increase in retail sales, given that we have been closely following and reporting on the Redbook same-store retail sales index, which continued to accelerate in May (chart). (2) GDP. Following the strong increase in control-group retail sales, the Atlanta Fed's GDPNow  model estimate for Q2-2026 real GDP growth was revised higher, from 2.8% to 3.0% (chart). The “nowcast” for real consumption growth was raised from 2.4% to 2.7%, and real gross private domestic investment was lowered from 8.6% to 8.5%. These numbers imply that consumer spending growth accelerated in the second quarter and that capital investment remains strong due to the AI infrastructure buildout. (3) Labor market. Initial unemployment insurance claims dropped slightly to 226,000 last week, a low level that is consistent with very subdued layoff activity (chart). Continuing claims ticked up to 1,810,000. The readings suggest that the labor market remains in good shape and continues to support consumer spending. (4) Regional Fed surveys. The average of the business conditions indexes across two Fed regional business surveys ticked down to 8.0 in June but still suggests that manufacturing activity in the US economy remains in expansionary territory (chart). At the same time, the averages of prices-paid and prices-received indexes across the two Fed regional business surveys indicate that inflation pressures have remained elevated in June (chart). These surveys confirm that the balance of risks remains skewed toward the inflation side of the Fed's dual mandate.
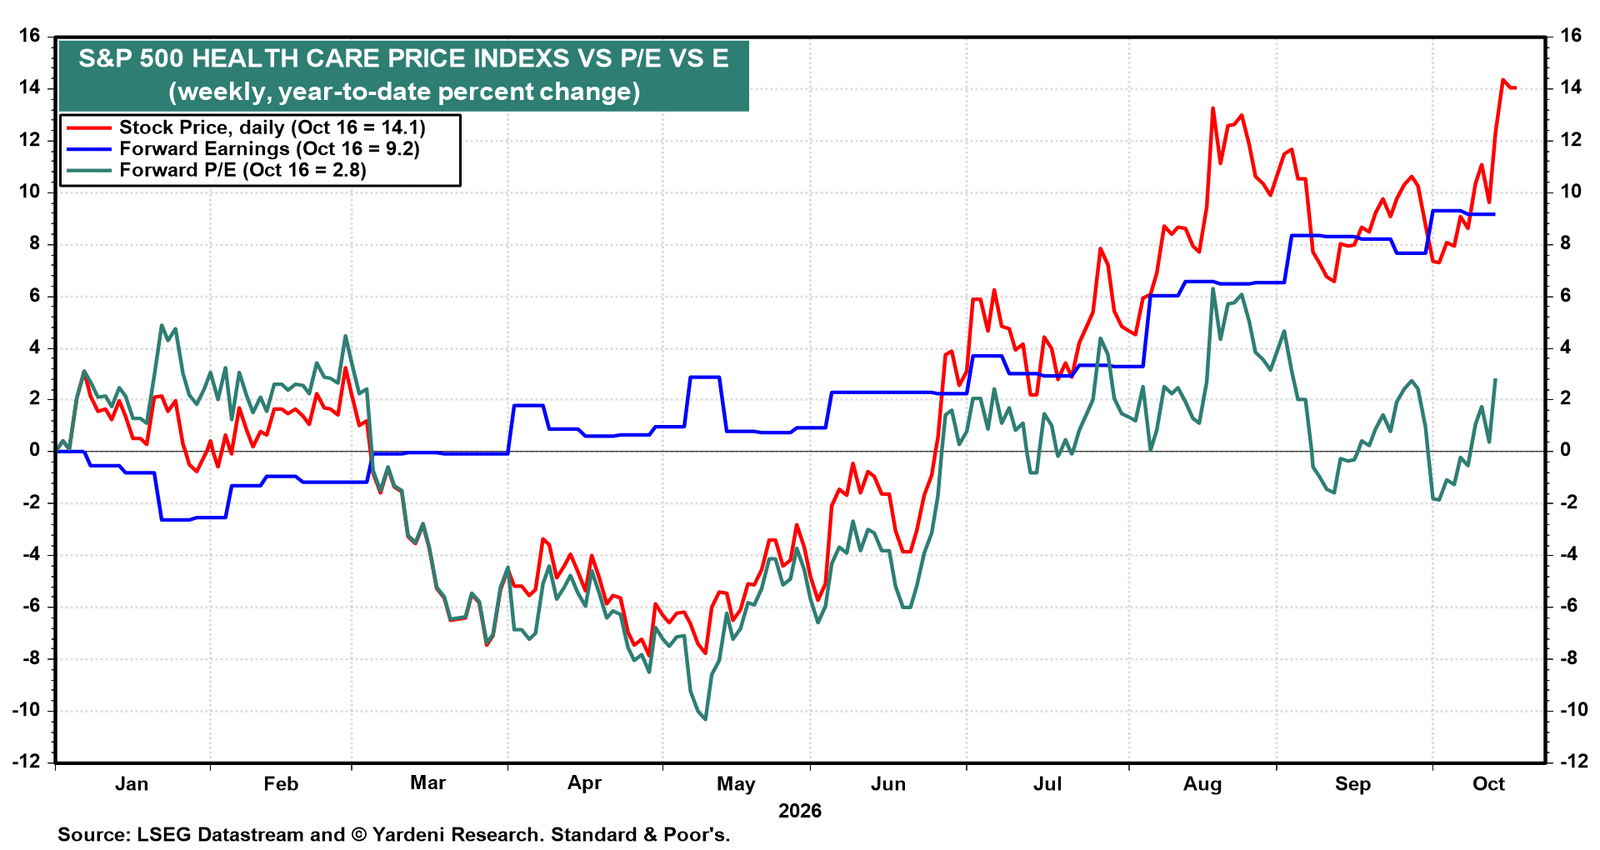
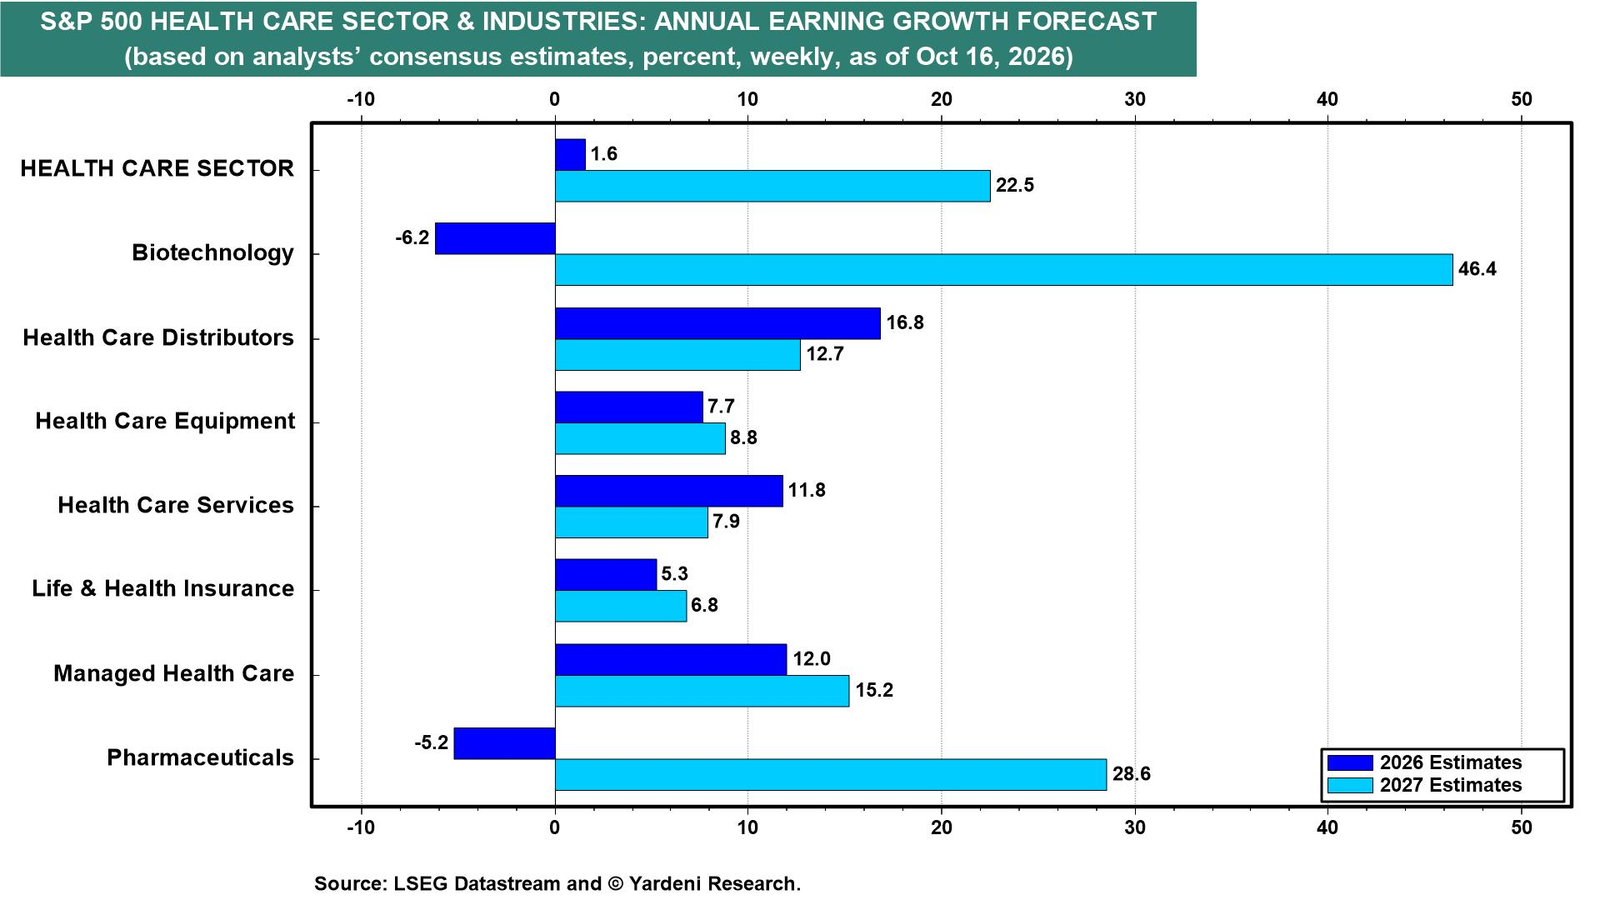
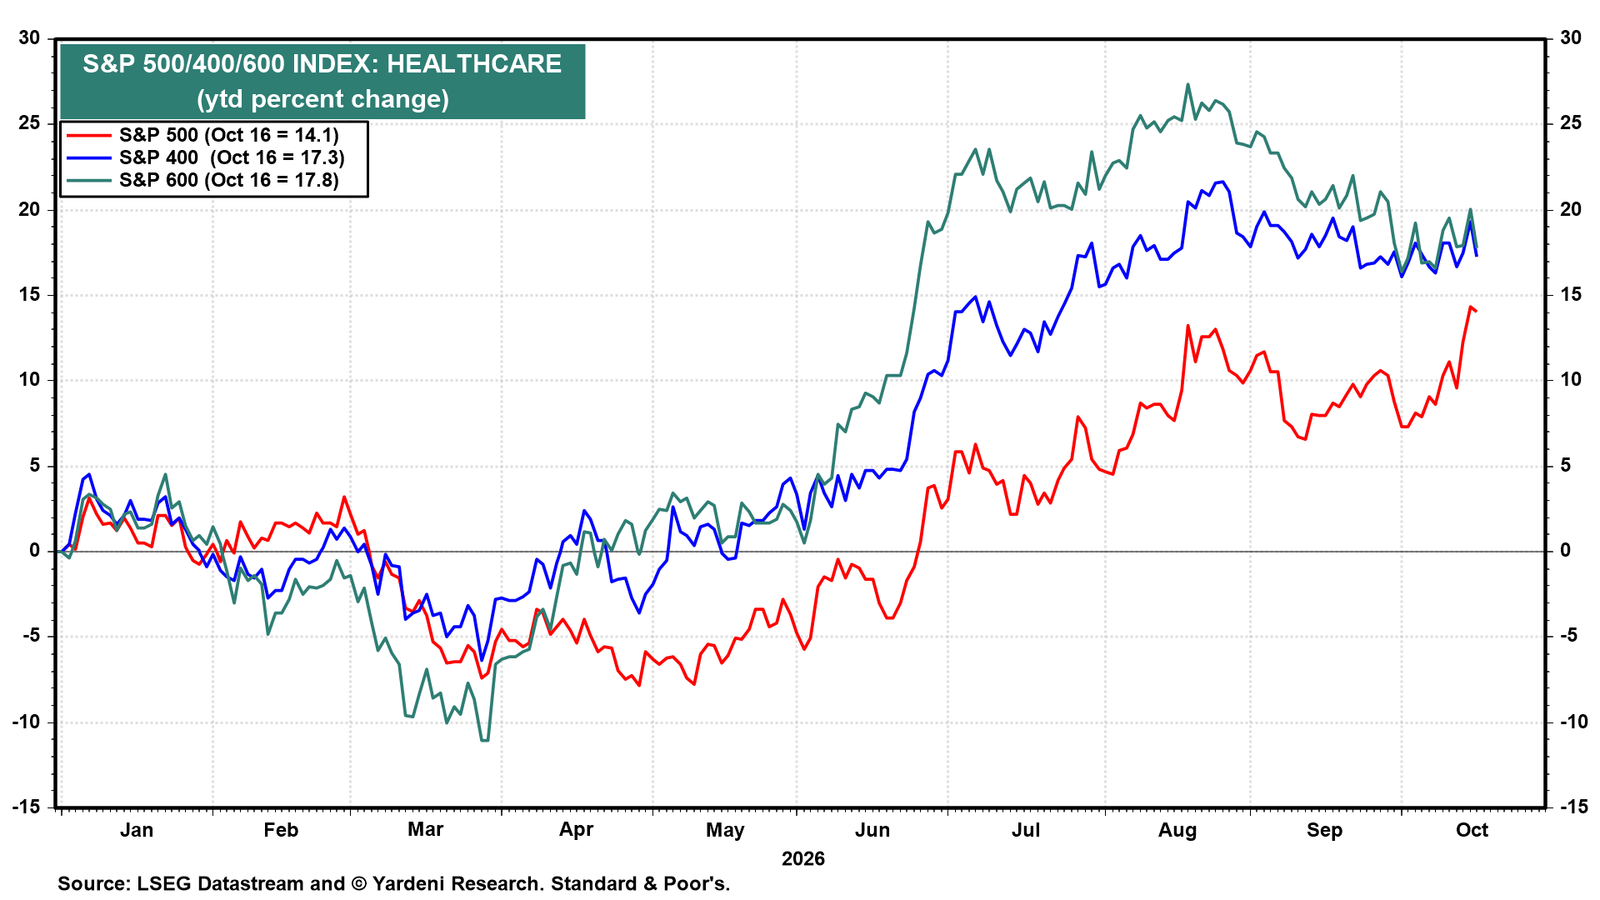
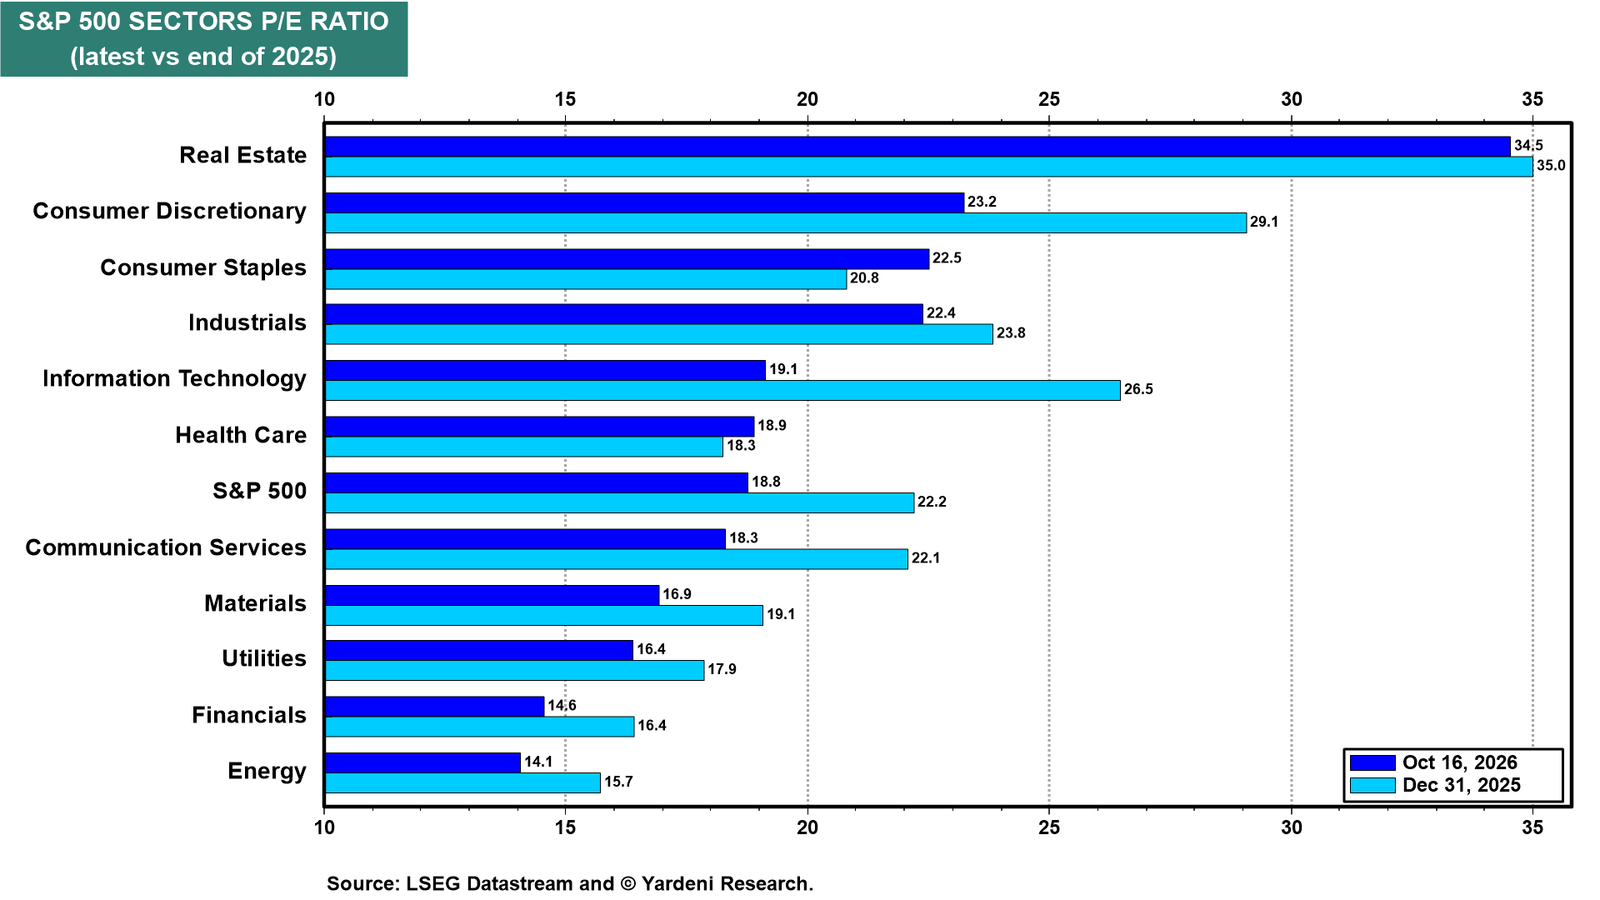
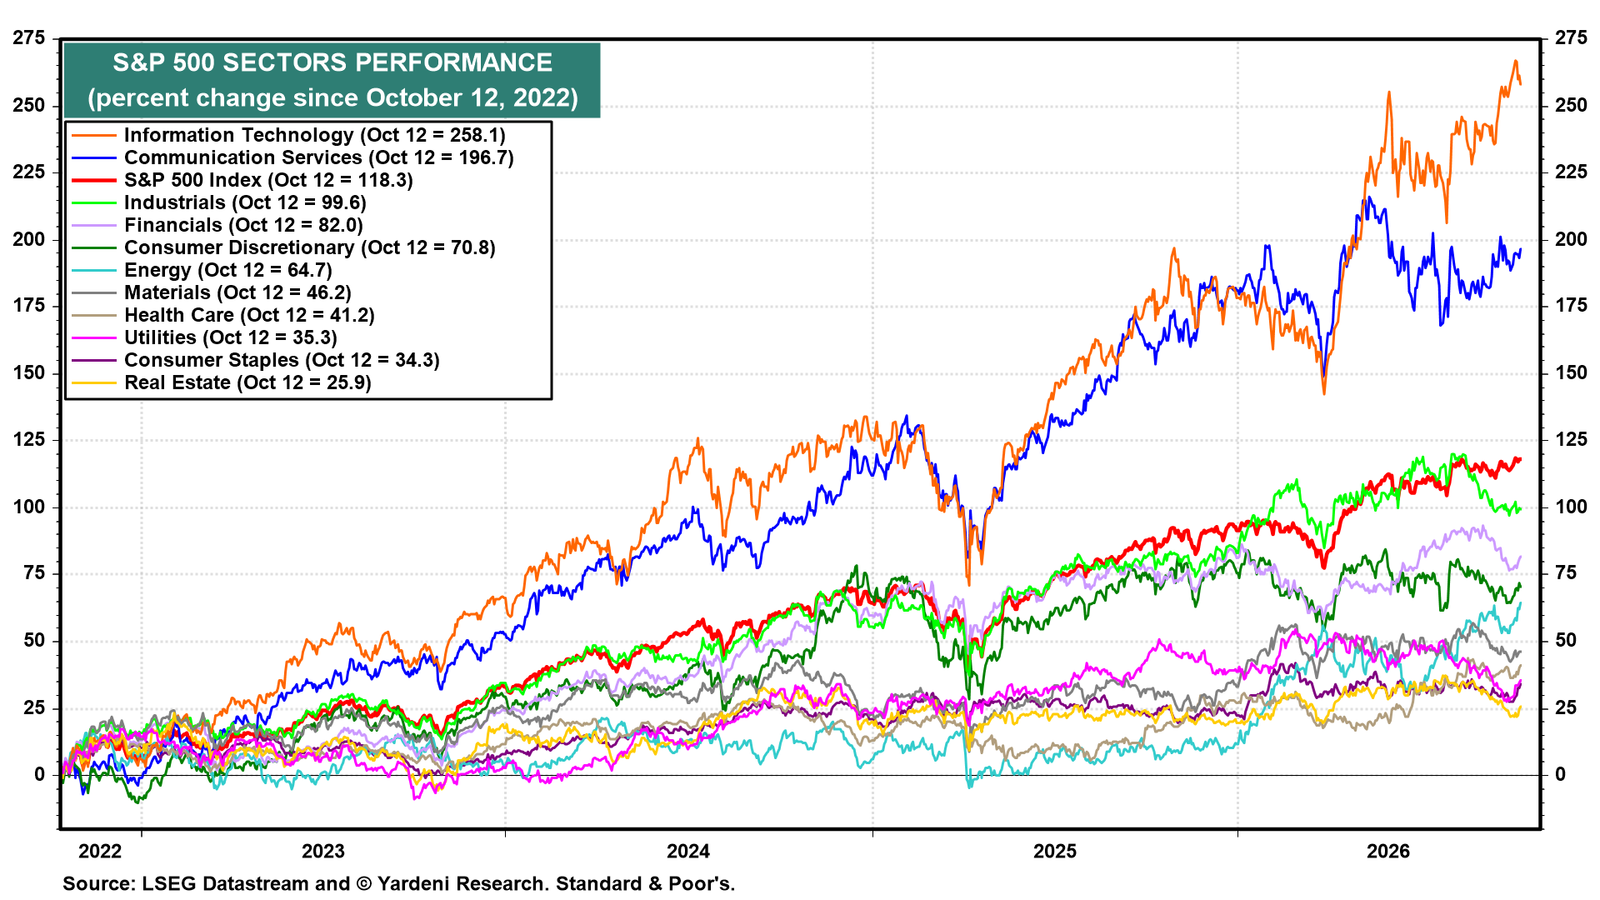
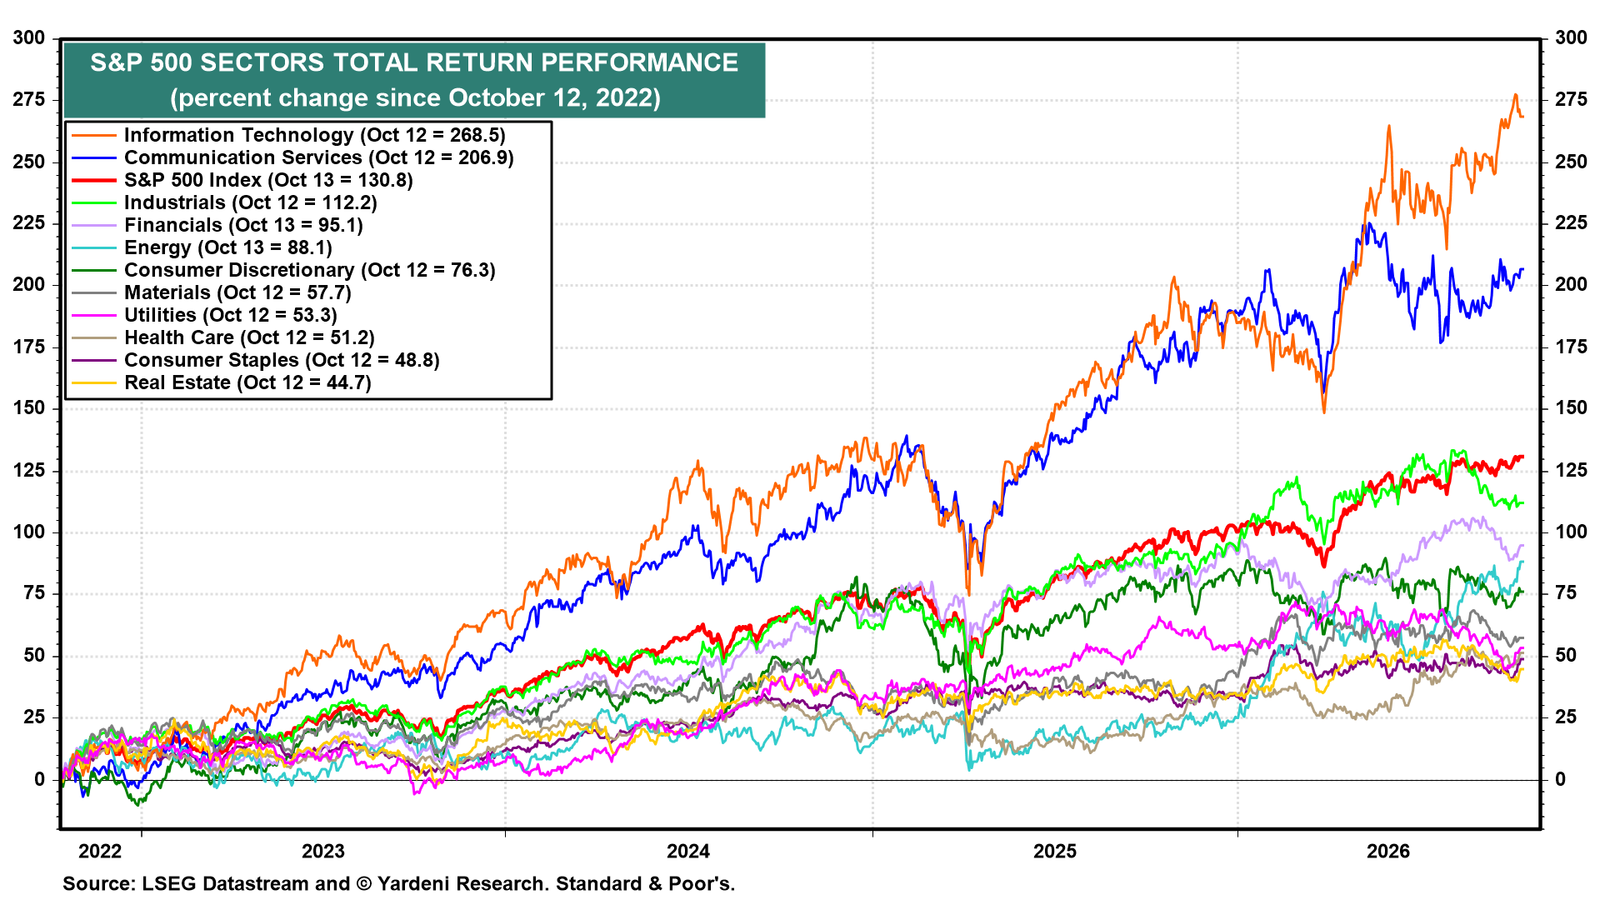
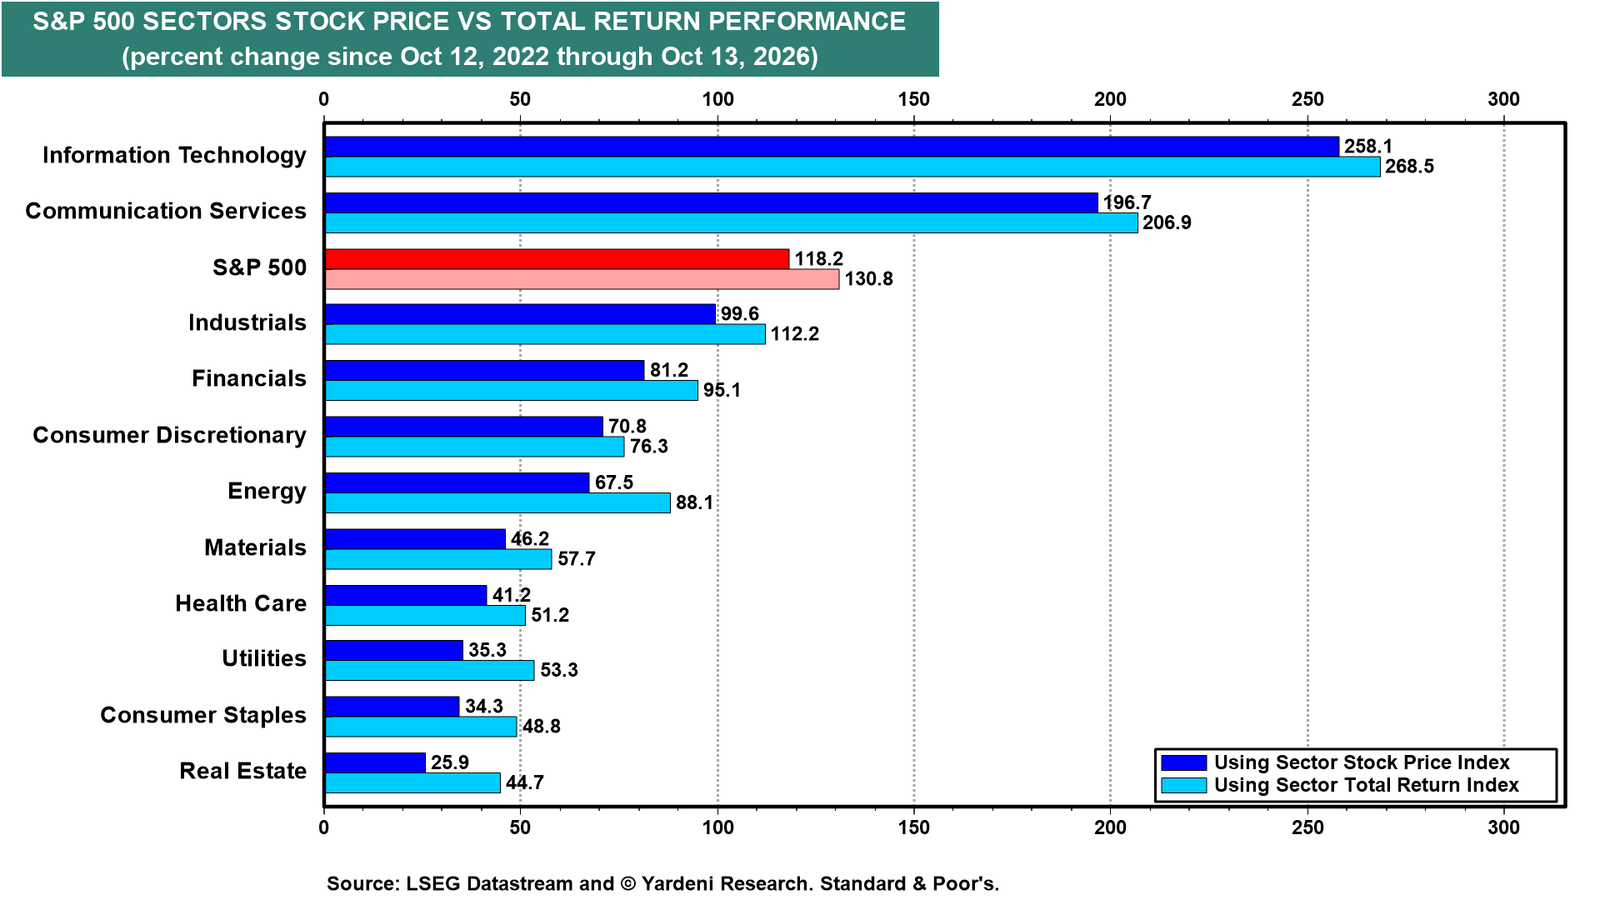
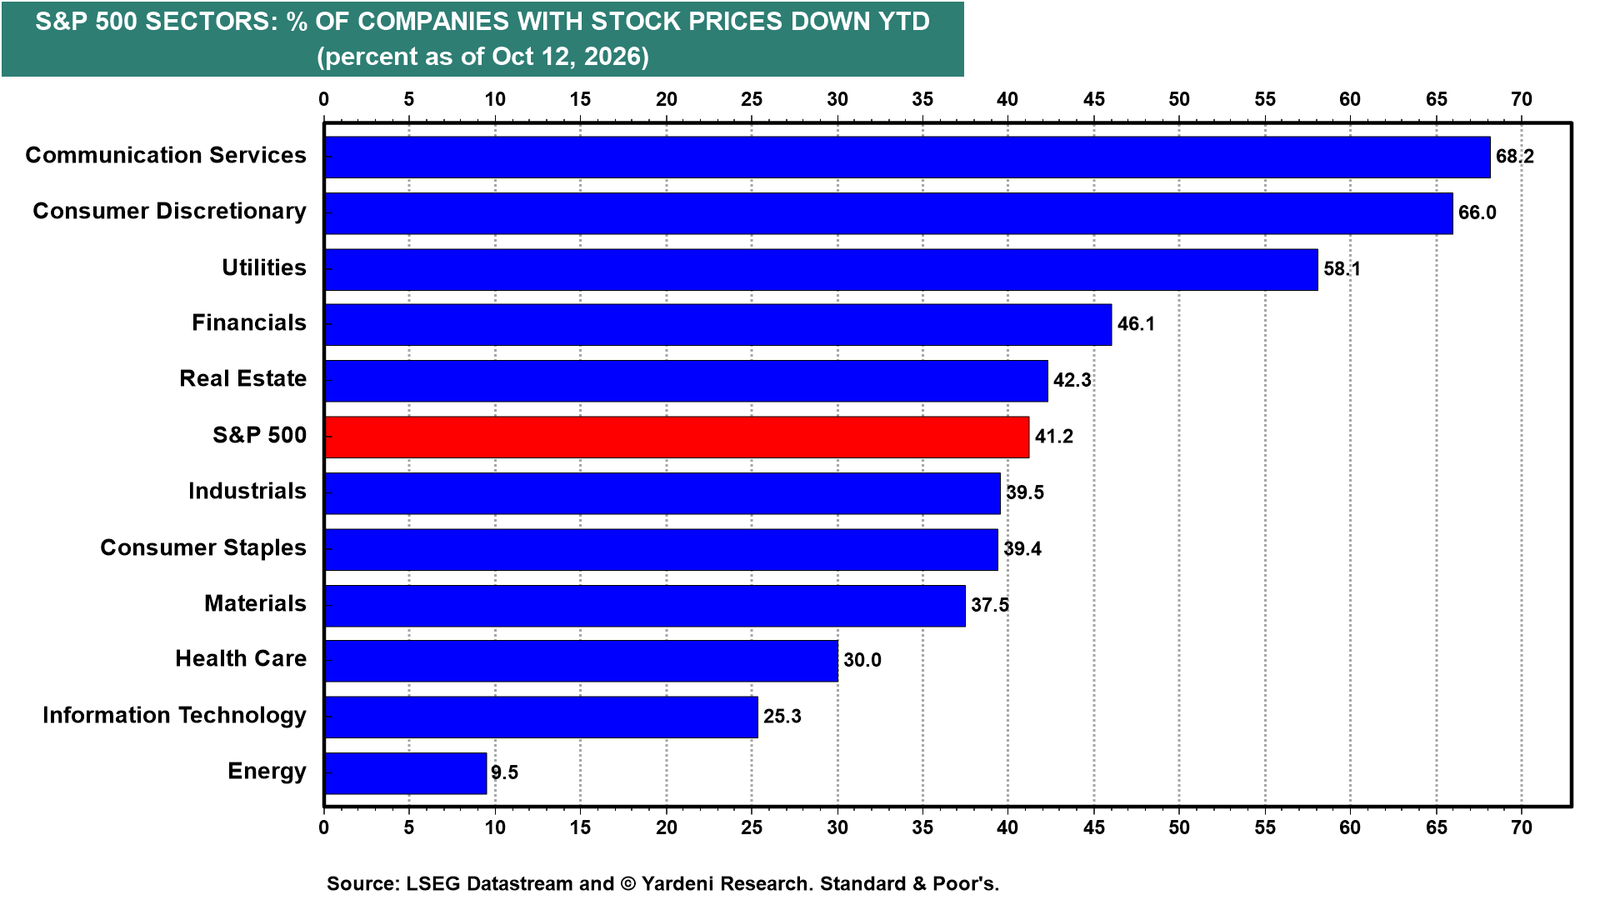
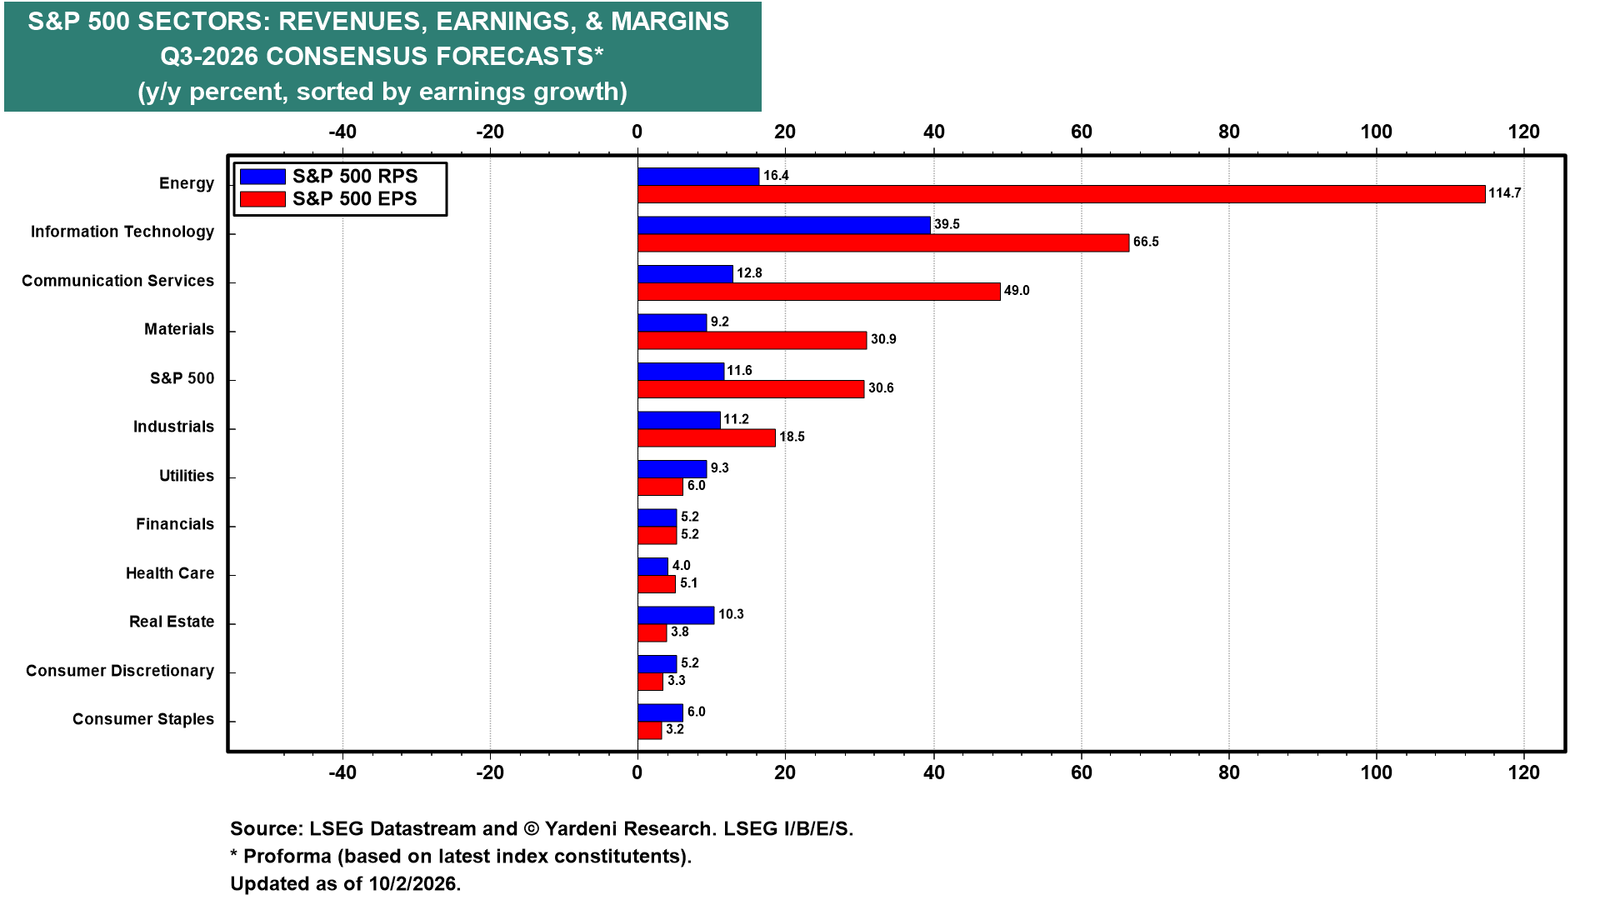
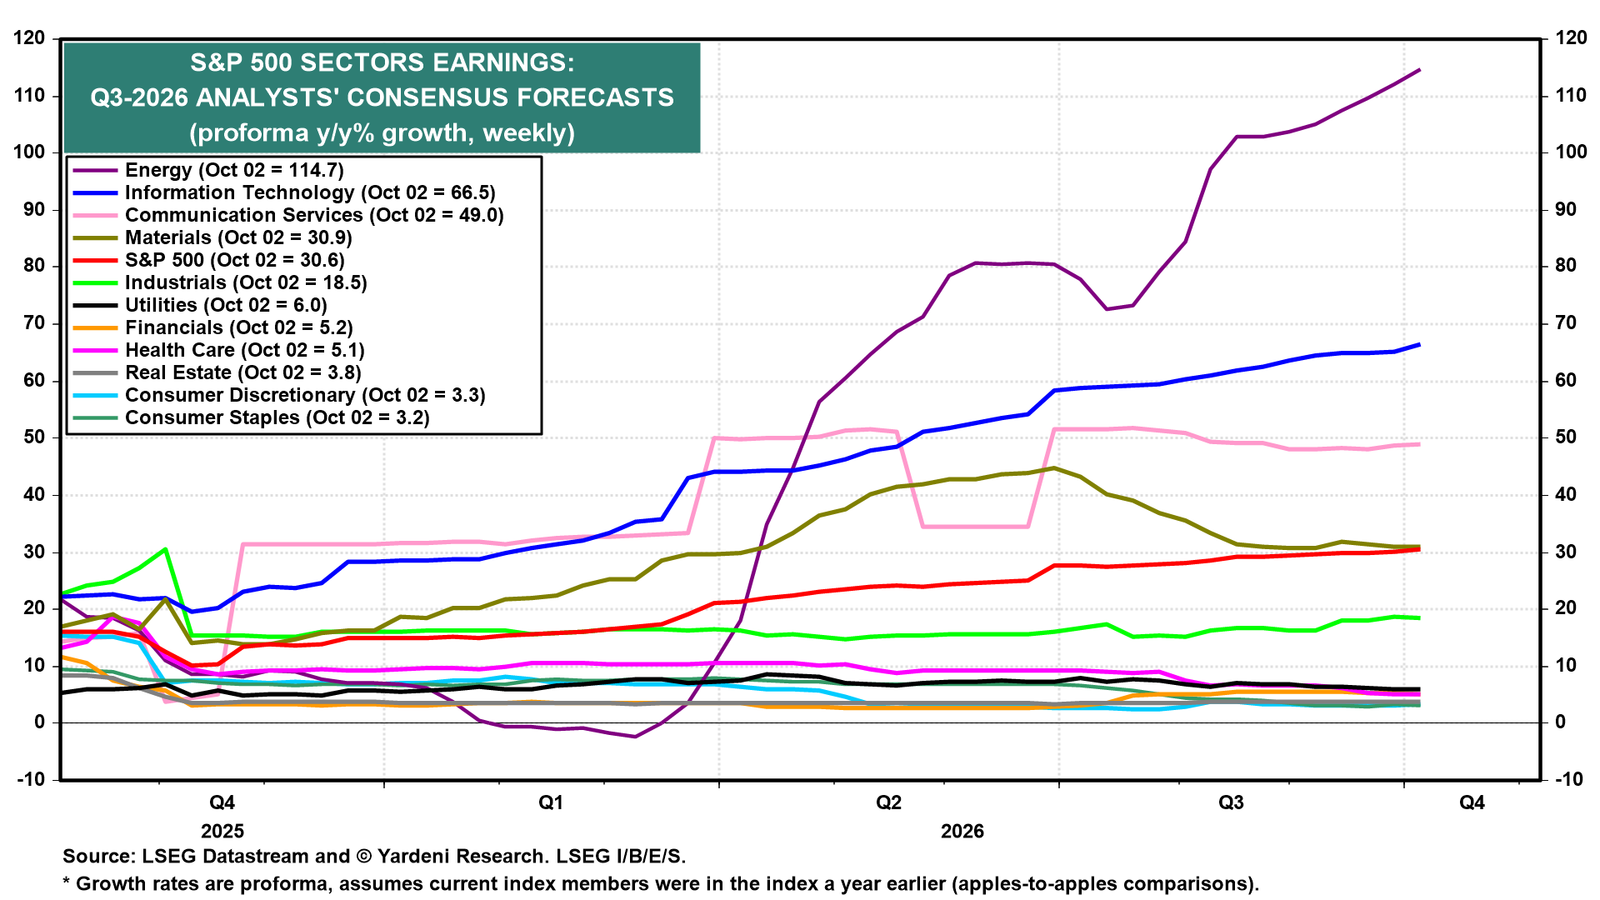
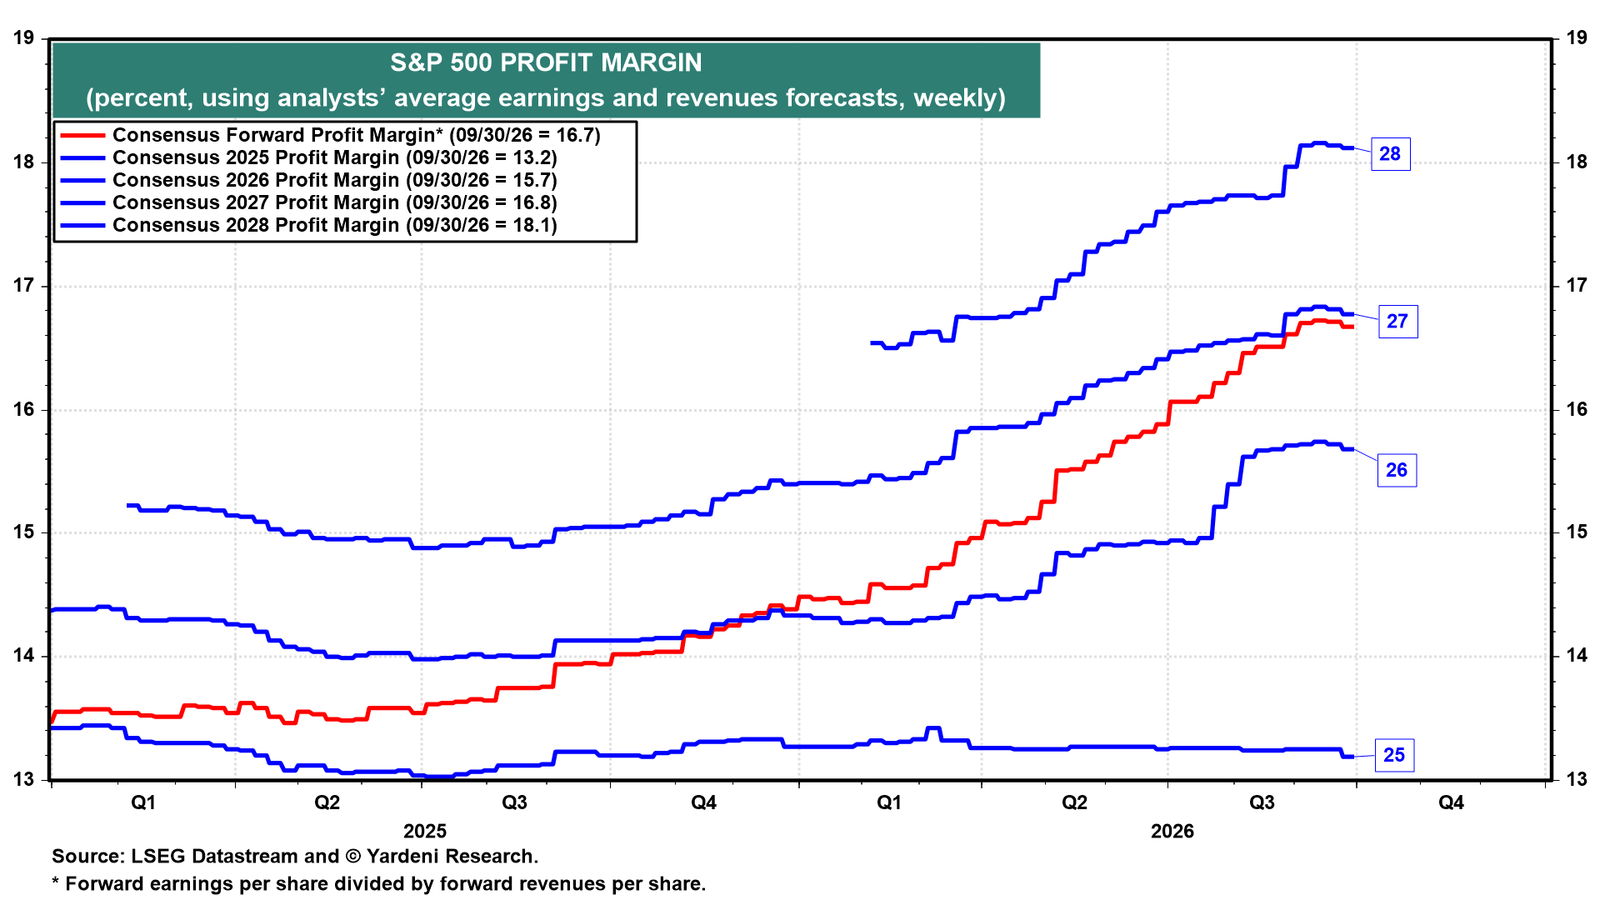
Yardeni QuickTakes Healthcare: Pockets Of Alpha We recommend a market-weight position in the S&P 500 Health Care sector. It is down 3.8% ytd, the worst among all 11 S&P 500 sectors, and remains one of the clear laggards of the bull market that began in October 2022 (chart). That underperformance has created selective opportunities. The aggregate sector still lacks a near-term earnings catalyst, carries the second-lowest forward profit margin in the index, and has the weakest 2026 EPS growth outlook of any S&P 500 sector. However, some of the industries within the sector have improving outlooks. Pharma is rerating as GLP-1 economics mature into a durable earnings base, while Biotech is benefiting from M&A activity, patent-cliff pressure, and improving risk appetite. Health Care has quietly held up month-to-date, eking out a small gain, while the S&P 500 sits modestly in the red and high-beta pockets like the Consumer Discretionary, Communication Services, and Information Technology sectors have all dropped more than 4.5%. The sector also trades at a 17.1 forward P/E, below the S&P 500’s 20.4. We would own the areas where earnings, margins, and catalysts are improving, not the whole index. Consider the following: (1) Composition. Health Care accounts for 8.8% of the S&P 500’s market capitalization, the lowest weight the sector has carried in three decades. The S&P 400 MidCap and S&P 600 SmallCap sectors carry larger weights of 8.9% and 11.5%, respectively (chart). SmallCap Health Care is up 8.7% ytd, and MidCap Health Care is up 4.3%, both well ahead of LargeCap Health Care’s 3.8% decline. Smaller companies have benefited from M&A premiums and are less exposed to the mega-cap pharma and equipment drag. (2) Breadth. Health Care’s performance gap is unusually wide. Managed Health Care leads the sector, up 22.1% ytd, while Health Care Equipment is down 23.8% (chart). Managed Care has rallied on a stronger-than-expected 2027 Medicare reimbursement rate, while Equipment has been pressured by litigation overhangs and dilutive acquisitions. The earnings picture is just as uneven. Health Care Services is up 14.4% ytd, supported by a 2026 EPS growth forecast of 7.2%, nearly triple the sector’s 2.5% forecast (chart). Pharmaceuticals are the exception. The industry’s 4.0% ytd gain rests on only 1.0% expected 2026 EPS growth. (3) Earnings trough. Health Care is in its own earnings cycle. The sector’s 2026 EPS growth forecast of 2.5% is the lowest of any S&P 500 sector and far below the S&P 500’s 24.3% forecast (chart). Prospective growth in 2027 looks better, with expected EPS growth rebounding to 19.2%. The trough reflects Pharma’s compliance reset following 2025’s 32% earnings surge, while litigation continues to drag on Health Care Equipment. Net earnings revisions for 2027 are turning higher. (4) Margin compression. The sector's forward profit margin has fallen to 8.2%, the second lowest in the index, down from a peak of 11.5% in February 2022 (chart). (5) Pharma's rerating. Pharmaceuticals remains our preferred pocket within Health Care. The S&P 500 Pharmaceuticals index is up 4.0% ytd and accounts for 37.6% of the sector's market capitalization. Its forward profit margin has climbed to 30.1%, near a record high, almost four times the sector average (chart). Pharma trades at an 18.2 forward P/E, below its 18.7% expected 2027 EPS growth rate. That makes it one of the cleaner growth-at-a-reasonable-price opportunities in the sector. (6) Biotech. Biotech has recovered, but the recovery has been selective. Equal-weighted XBI and FBT show better breadth than cap-weighted IBB, while speculative ARKG remains far below its 2021 peak (chart). Biotech’s fundamentals are still mixed. Forward earnings has stalled since peaking at $433 per share in January 2022, while the forward profit margin has compressed from above 40% to 30.1% (chart). Longer term, AI-driven drug discovery could lift R&D productivity, but that upside is not yet visible in reported earnings. Health Care is no longer a sector to ignore, but it is still not a broad overweight. The index-level numbers remain weak, with slow earnings growth and compressed margins. The opportunity is underneath the surface.
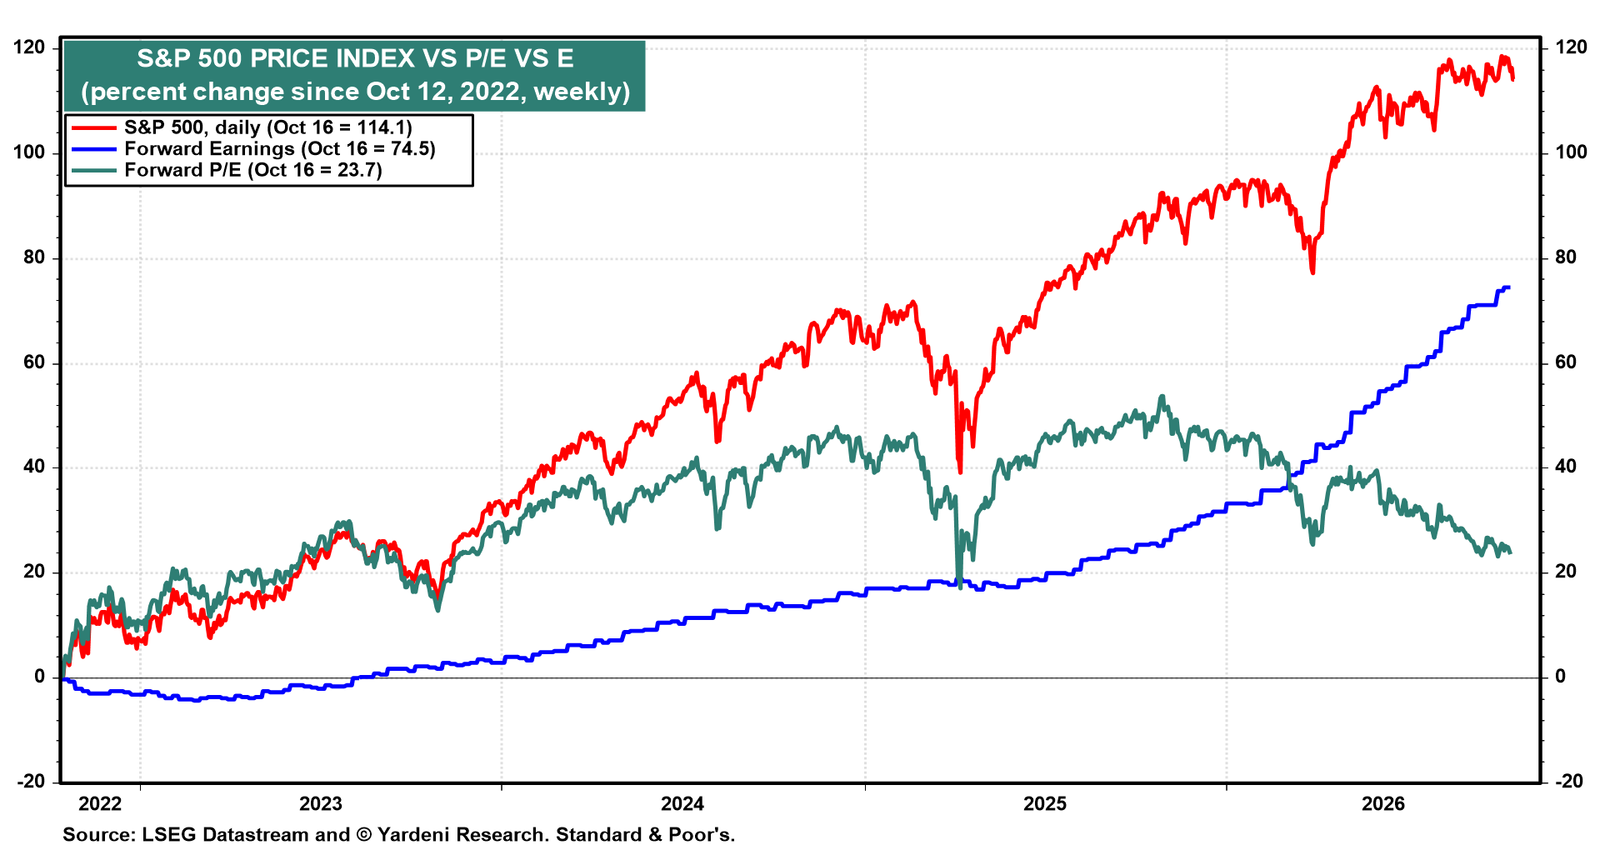
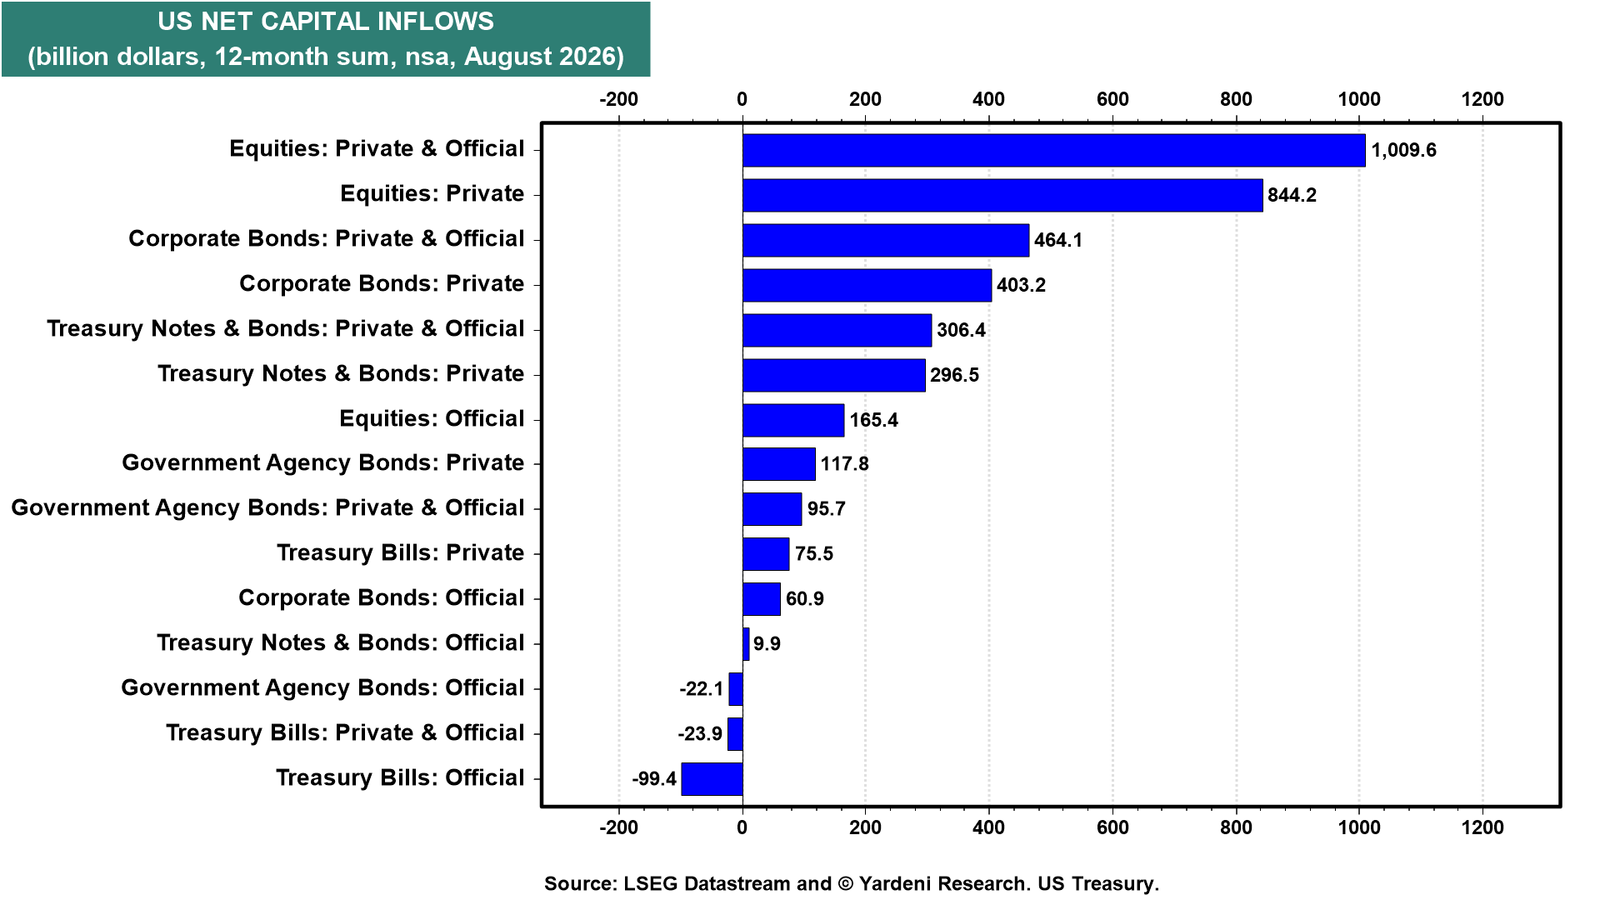
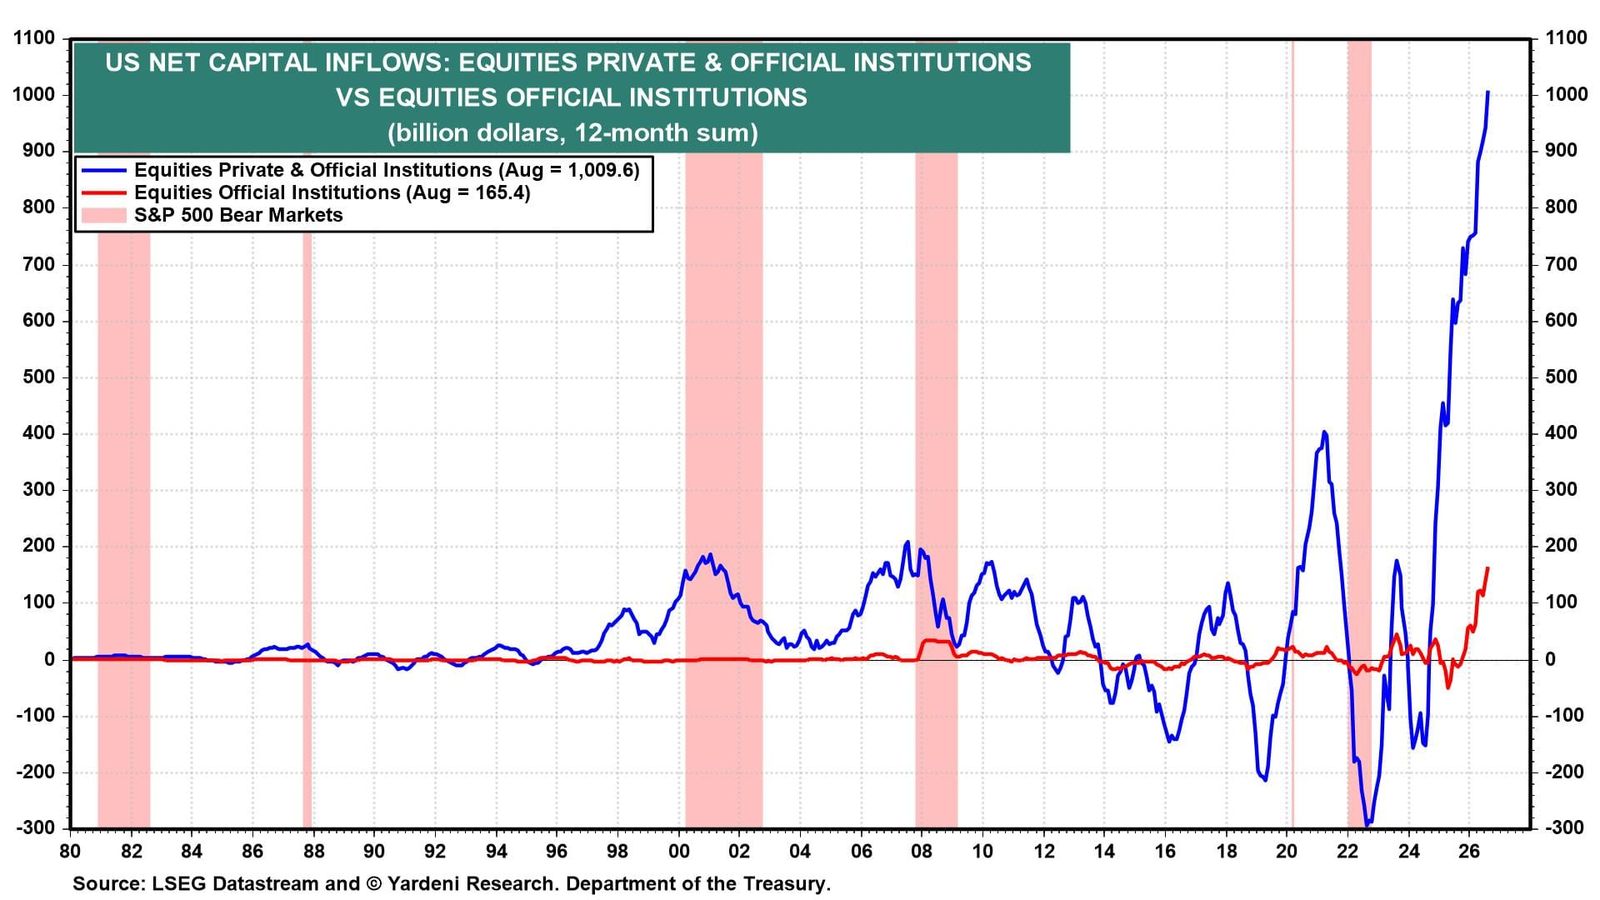
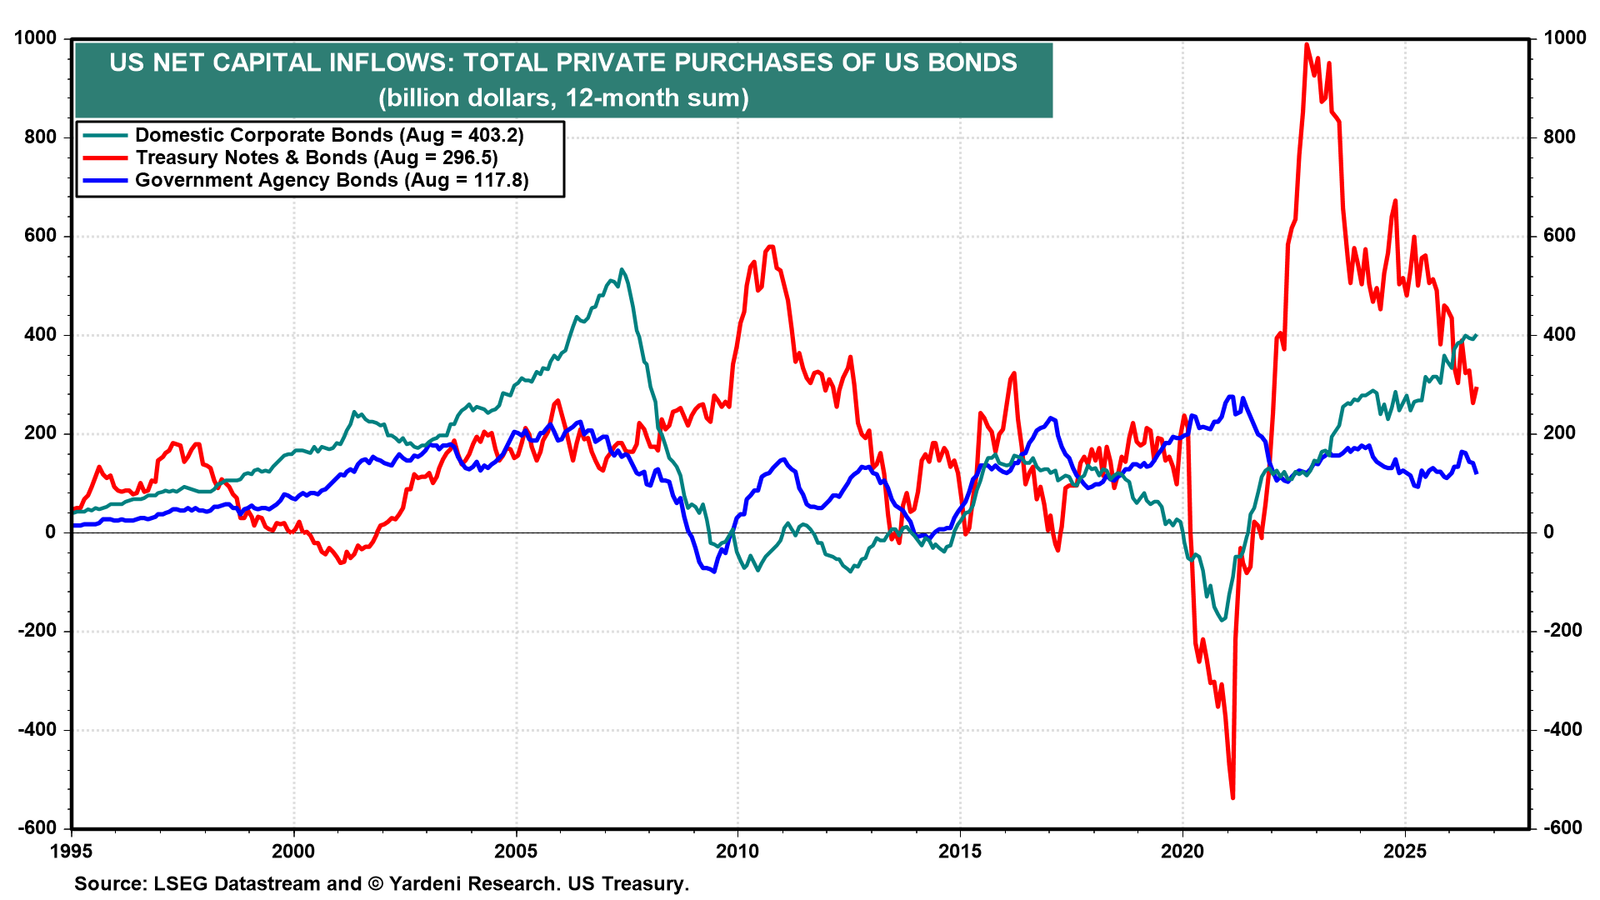
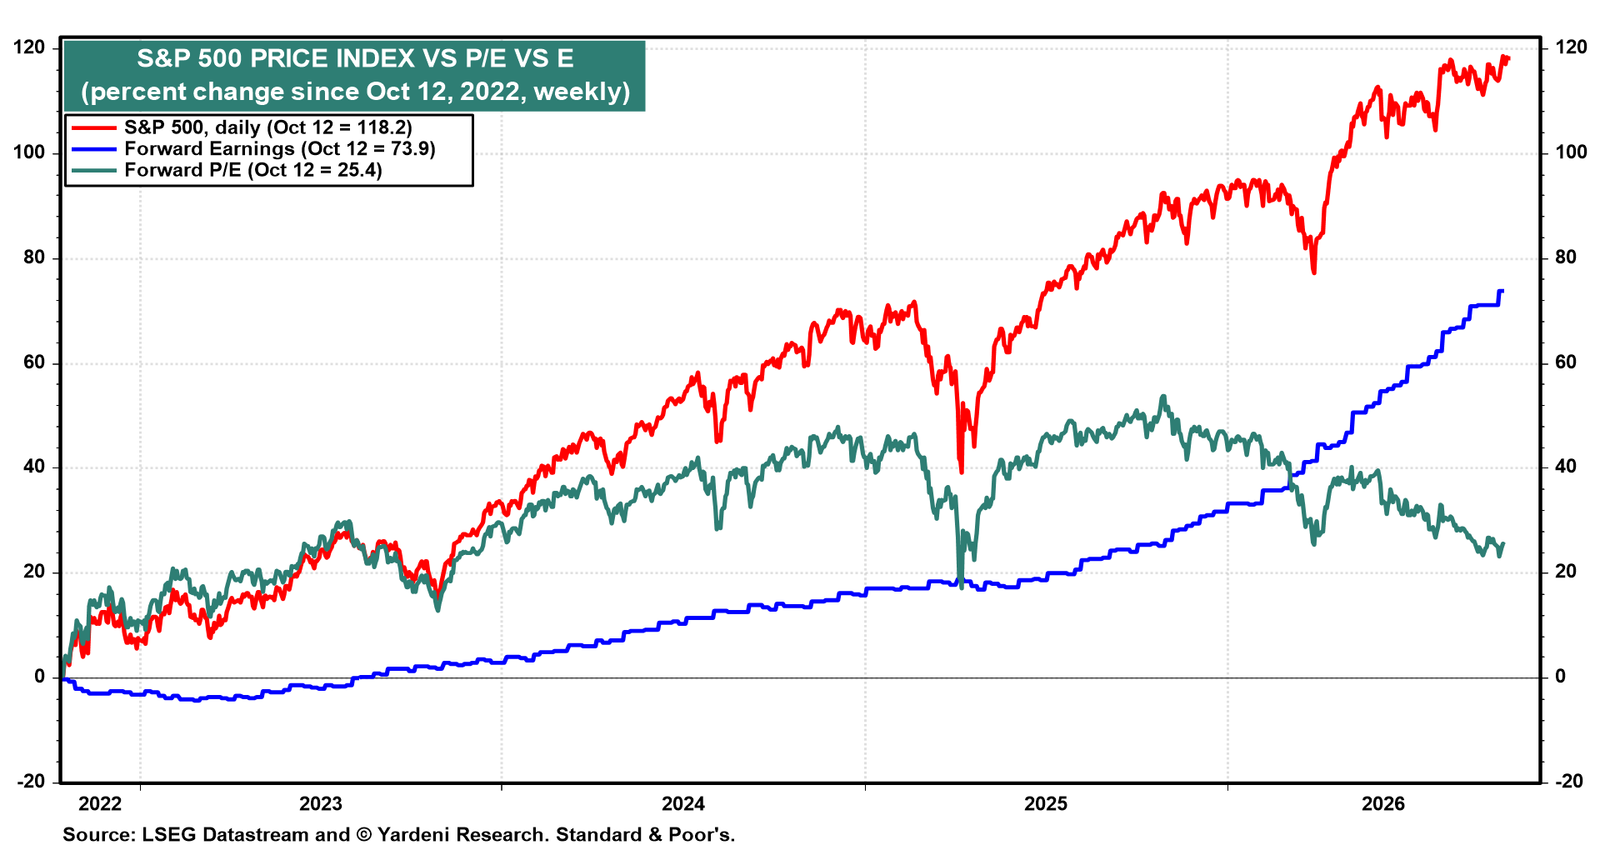
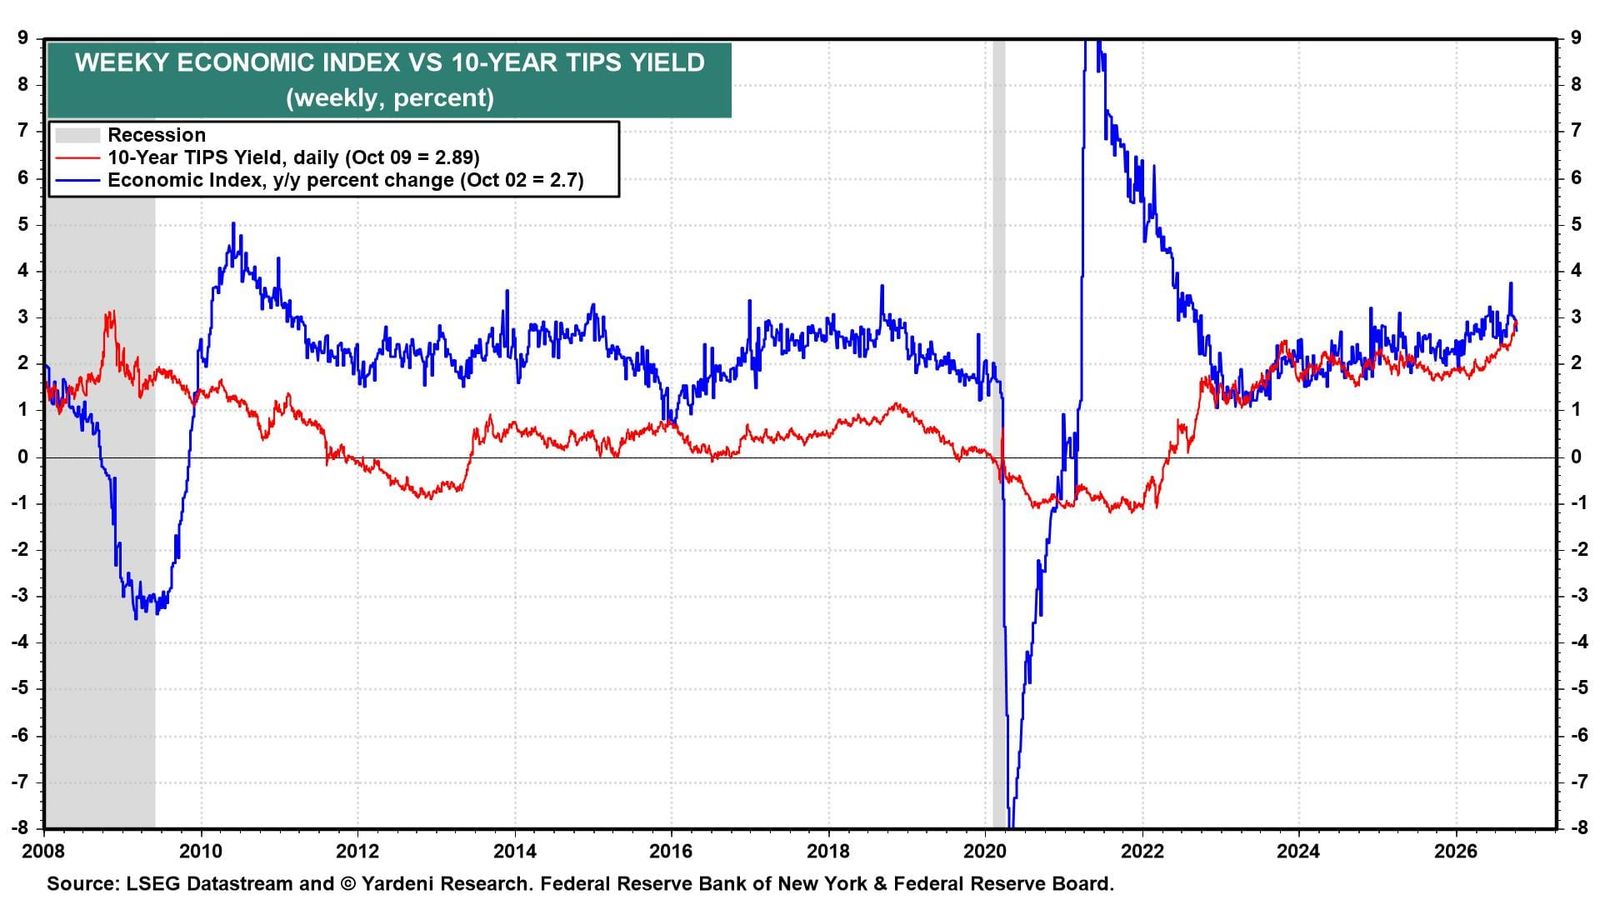
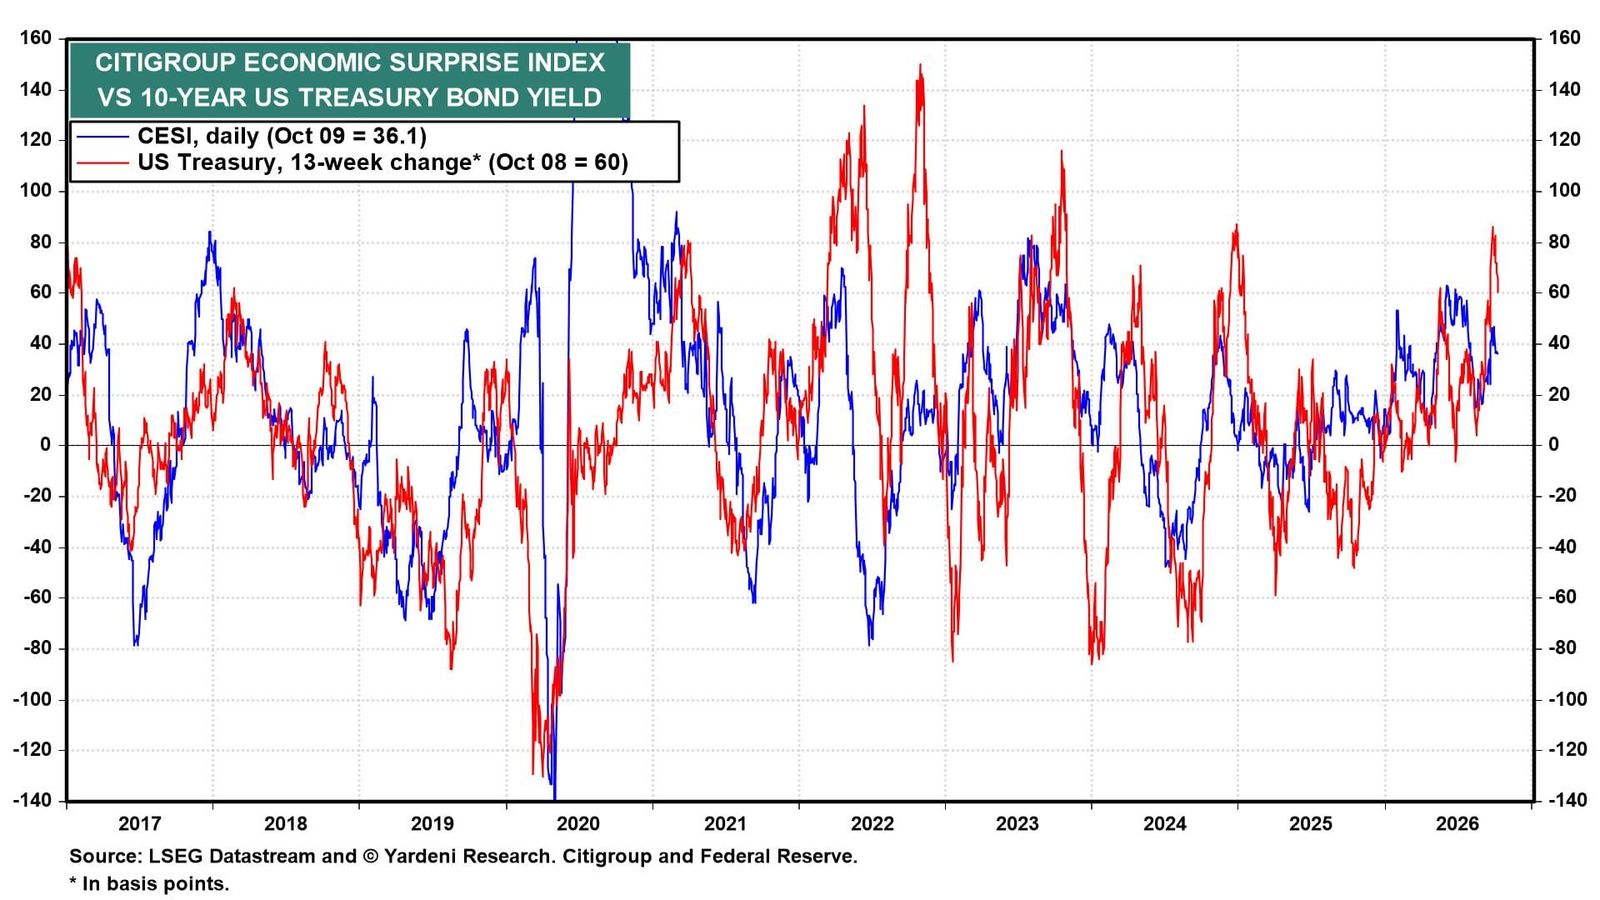
Yardeni QuickTakes FEMO Lifting Economic Growth & Foreigners Lifting US Stocks In the spectrum of bullish stock markets, there are two polar opposites. The first is driven by FOMO, the Fear of Missing Out, which inflates P/E multiples as investors chase hope and hype rather than fundamentals, creating the conditions for a bubble. The second is driven by FEMO, or Fabulous Earnings Momentum, which works the other way around: Corporate earnings grow faster than stock prices, compressing P/E multiples rather than expanding them, and analysts raise their estimates because the fundamentals justify doing so. The current bull market has been in the middle of the spectrum, but has moved more toward the FEMO variety this year. It is being driven by real, measurable, and record corporate profits. And it is lifting not just stock prices but the entire economy. Consider the following: (1) FEMO & the Index of Coincident Economic Indicators. S&P 500 forward earnings multiplied by a constant forward P/E of 15.0 tracks the S&P 500 price index remarkably well over time (chart). The two series have moved together through every cycle since the mid 1990s, confirming that earnings drive the stock market. Since the bull market began in October 2022, the S&P 500 has risen above the forward earnings series multiplied by 15.0. That gap is multiple expansion: Investors are paying more per dollar of forward earnings as confidence in the upward trajectory has solidified. The current bull market has been driven by rising forward earnings and also by multiple expansion. The index is up 105% since October 22, 2022, while forward earnings is up 56%. However, this year, the index has been led mostly by FEMO. FEMO is lifting the economy through two channels. The first is the wealth effect: Rising stock prices increase household net worth, boosting consumer spending. The second is the profit channel: Profitable companies expand operations, hire more workers, pay higher wages, and invest in new productive capacity. Workers spend their wages, companies respond to demand, and a virtuous cycle takes hold. Both channels currently show up in the economic data. The Citigroup Economic Surprise Index stands at 48.7, firmly in positive territory (chart). Meanwhile, the Weekly Economic Index has accelerated meaningfully, pointing to real GDP growth of around 3.1% y/y (chart). On the other hand, the index of Coincident Economic Indicators (CEI) is growing at just 0.8% y/y, well below the real GDP growth of 2.6% y/y in Q1-2026 (chart). In the past, their growth rates tended to coincide more often than not. At the same time, S&P 500 forward earnings per share has grown much faster than the CEI since mid-2025, a deviation from their historically tight relationship (chart). S&P 500 forward earnings per share is up 31.0% y/y through June, while the CEI is up 0.8% through May (chart). In fact, the ratio of forward earnings to the CEI has reached an all-time high of 3.1 (chart). The rising ratio reflects a structural shift: Technological innovation is expanding profit margins across many sectors, and since profits drive investment, hiring, and consumer spending through the wealth effect, GDP follows corporate profitability. That is why S&P 500 forward earnings is a better leading indicator of the real economy than the CEI, in our opinion, especially recently (chart). (2) Treasury International Capital System. Just as domestic investors are following FEMO's lead, so too are foreign investors. Net capital inflows into US equities from private and official institutions reached a record $883.9 billion over the past 12 months through April (chart). Private foreign investors purchased a record $763.0 billion in US equities over the same period (chart). Purchases of US bonds, including Treasuries and corporate debt, added an additional $942.5 billion to net capital inflows. Net capital inflows into US equities from private and official institutions have surged to $883.9 billion, a record high that dwarfs anything seen in prior cycles and reflects the sheer scale of foreign conviction in the American earnings story (chart). Total net capital inflows from private and official sources combined to $1.40 trillion over the past 12 months through April (chart). Foreigners have been buying US securities, not selling them as the sell-America naysayers have claimed.
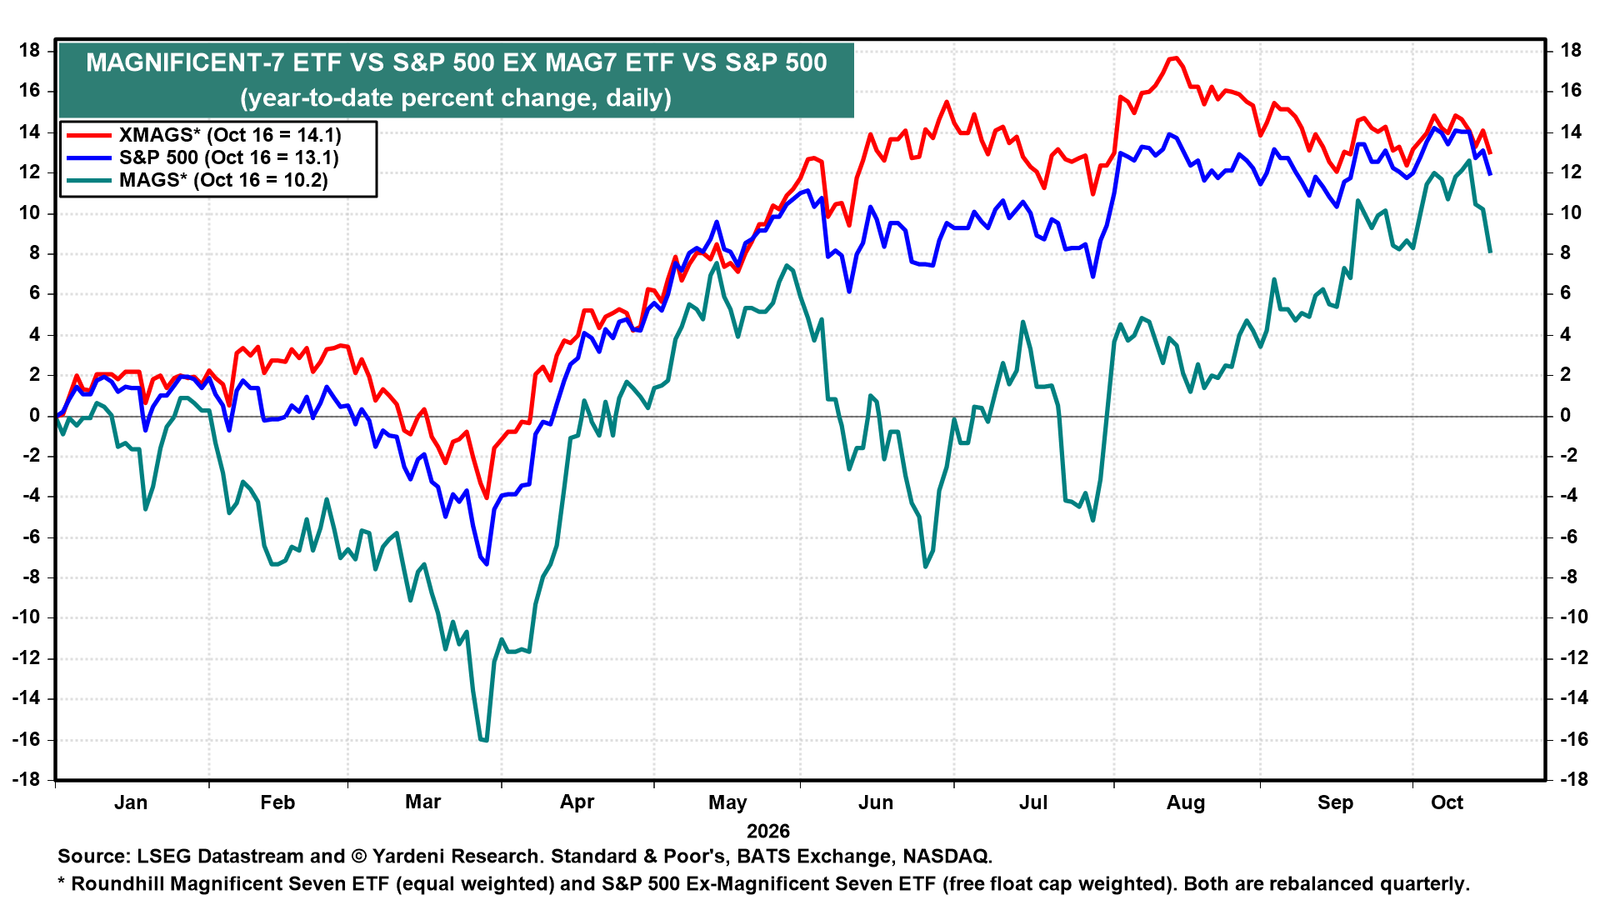
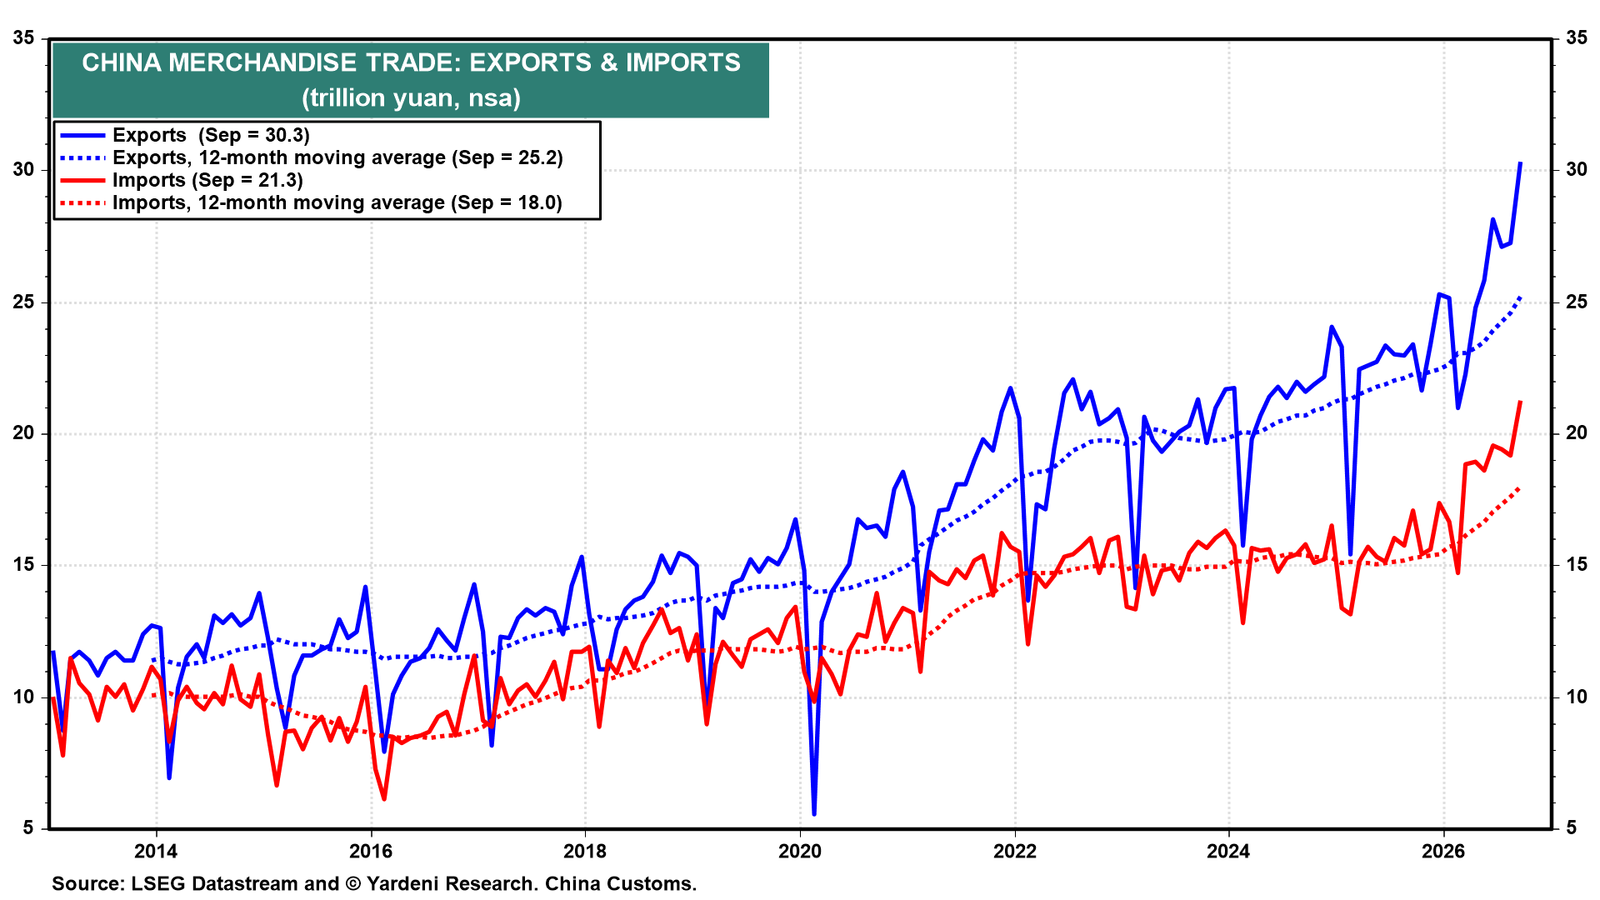
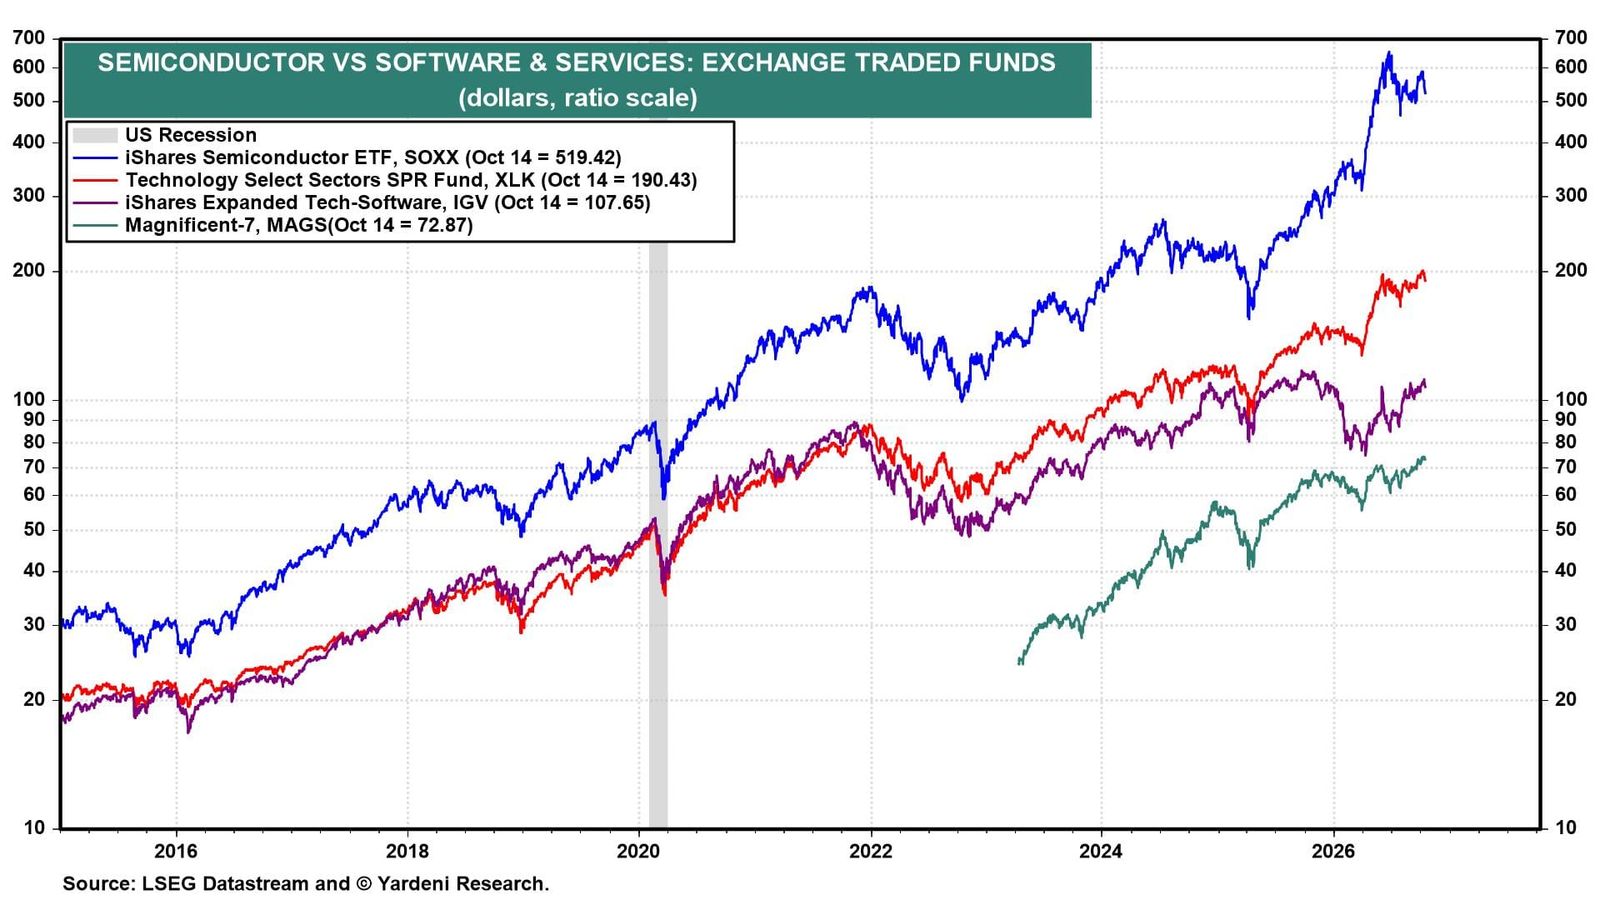
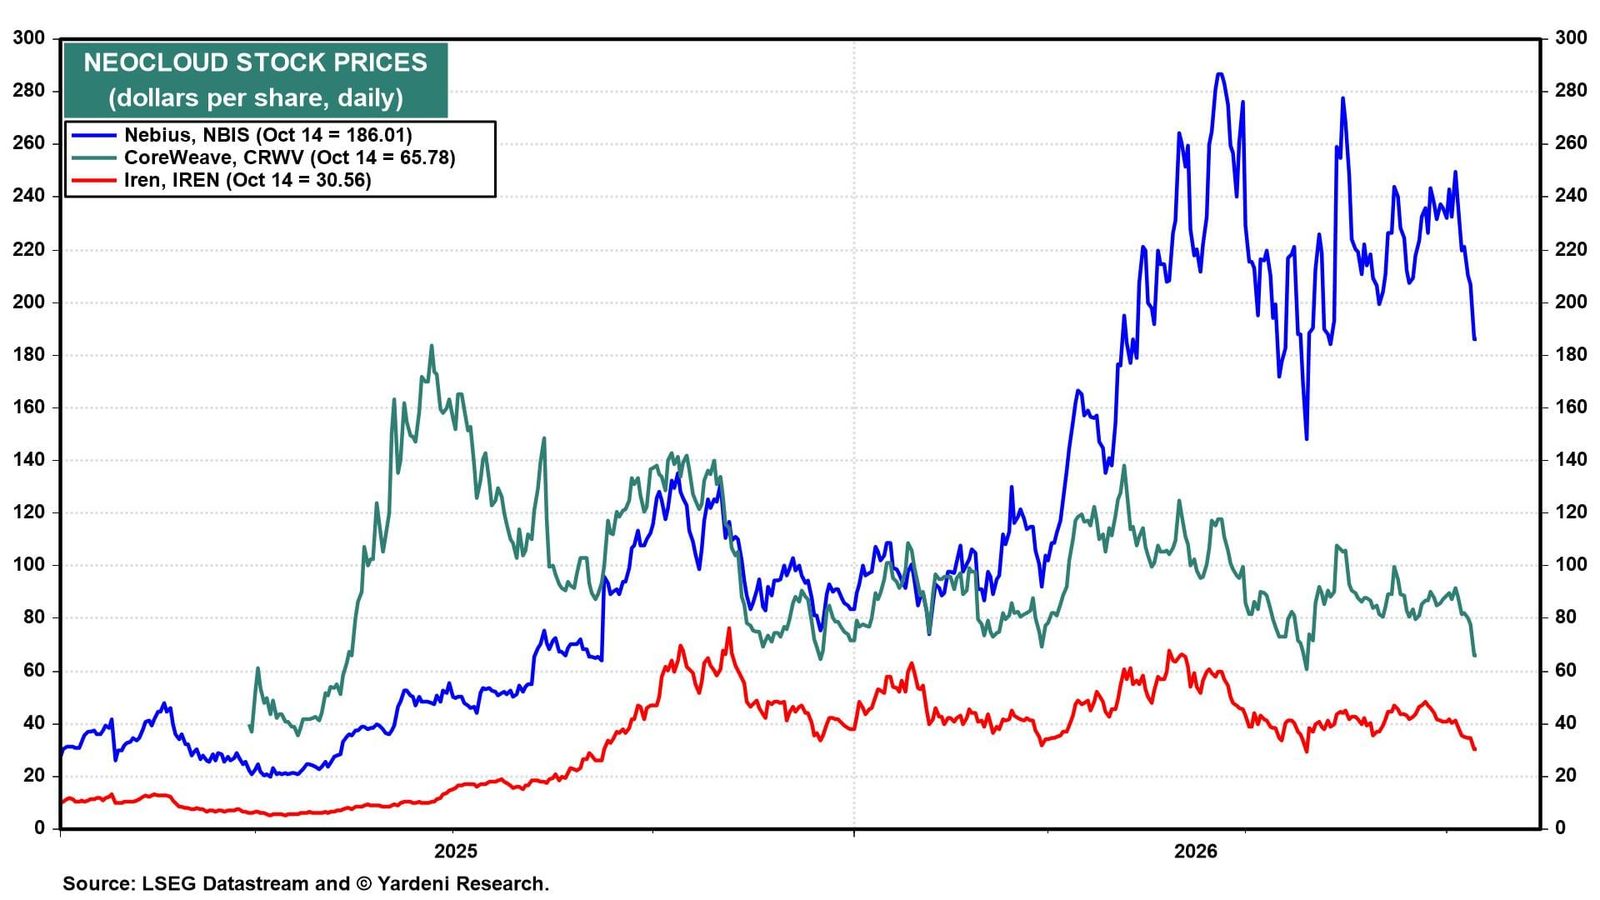
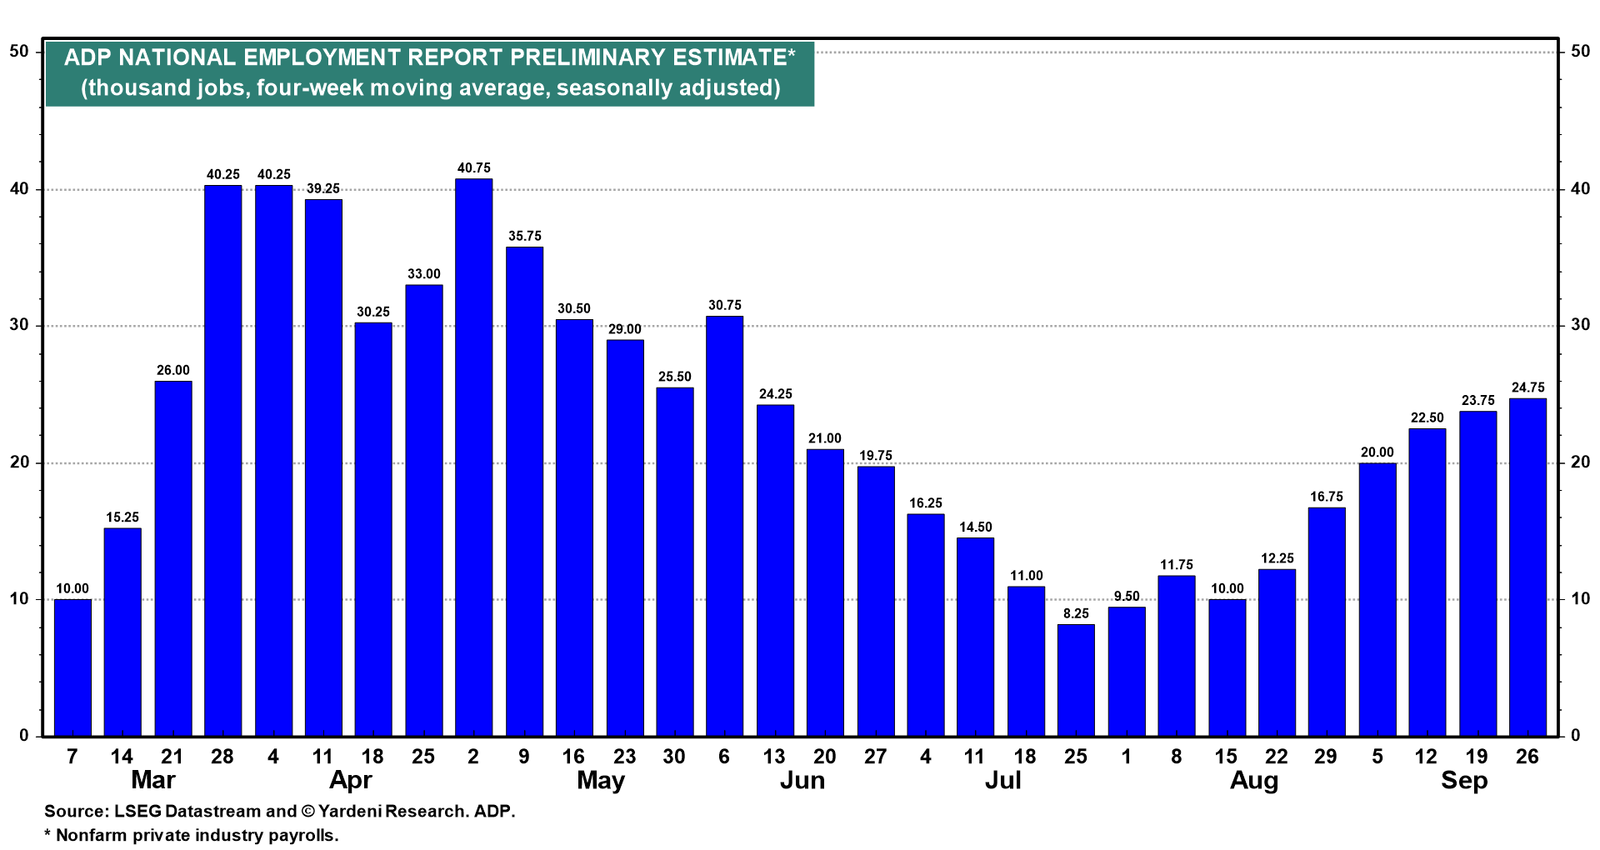
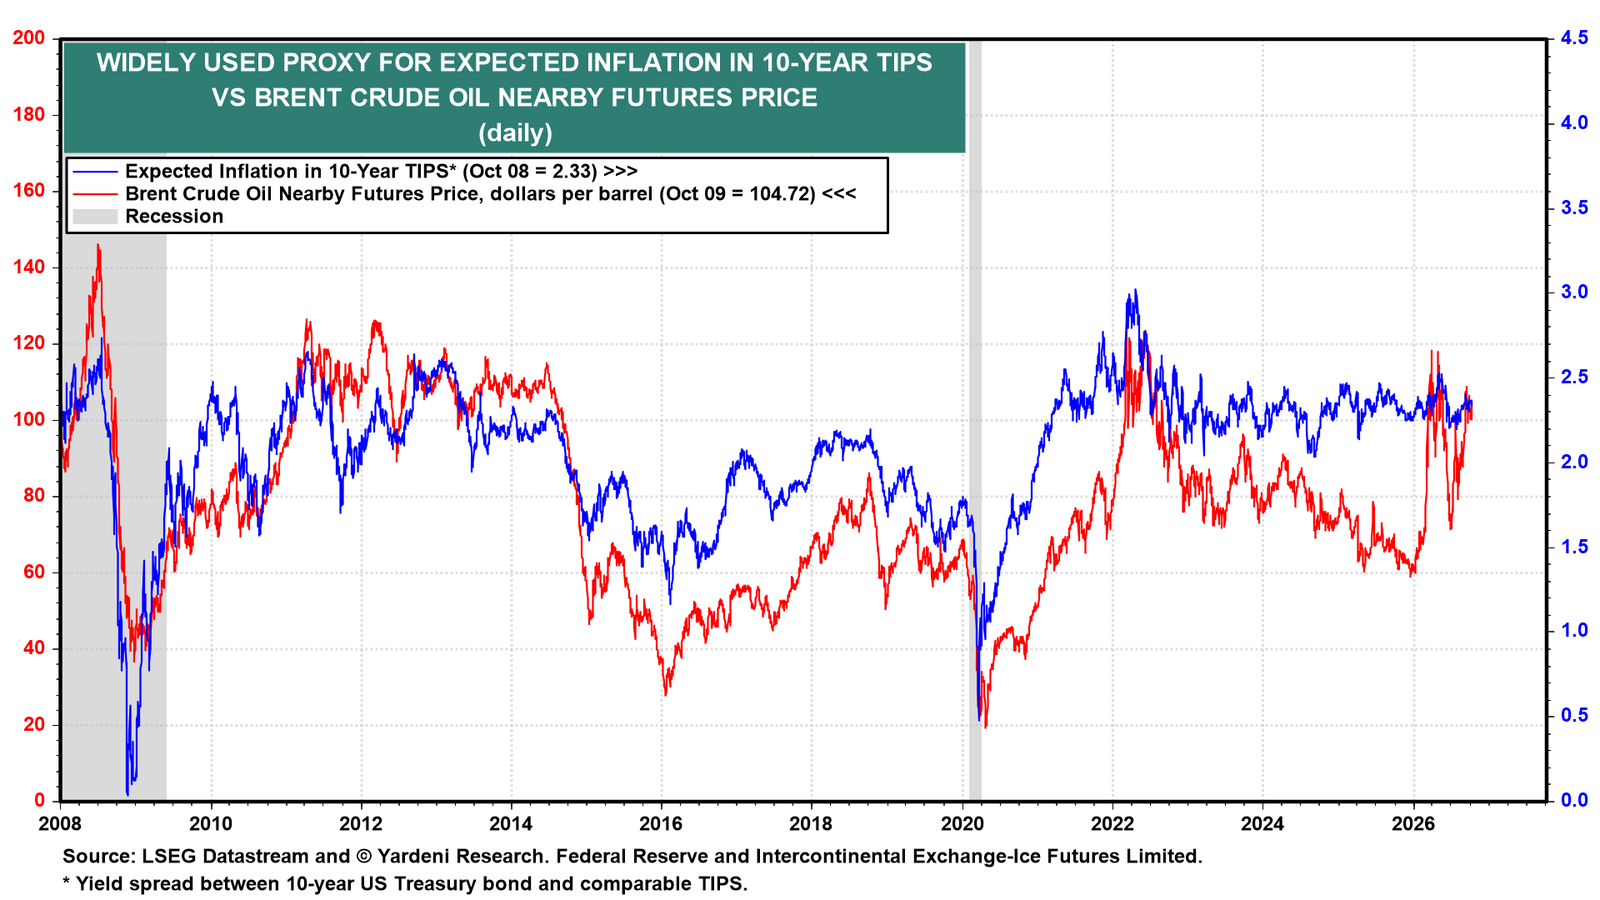
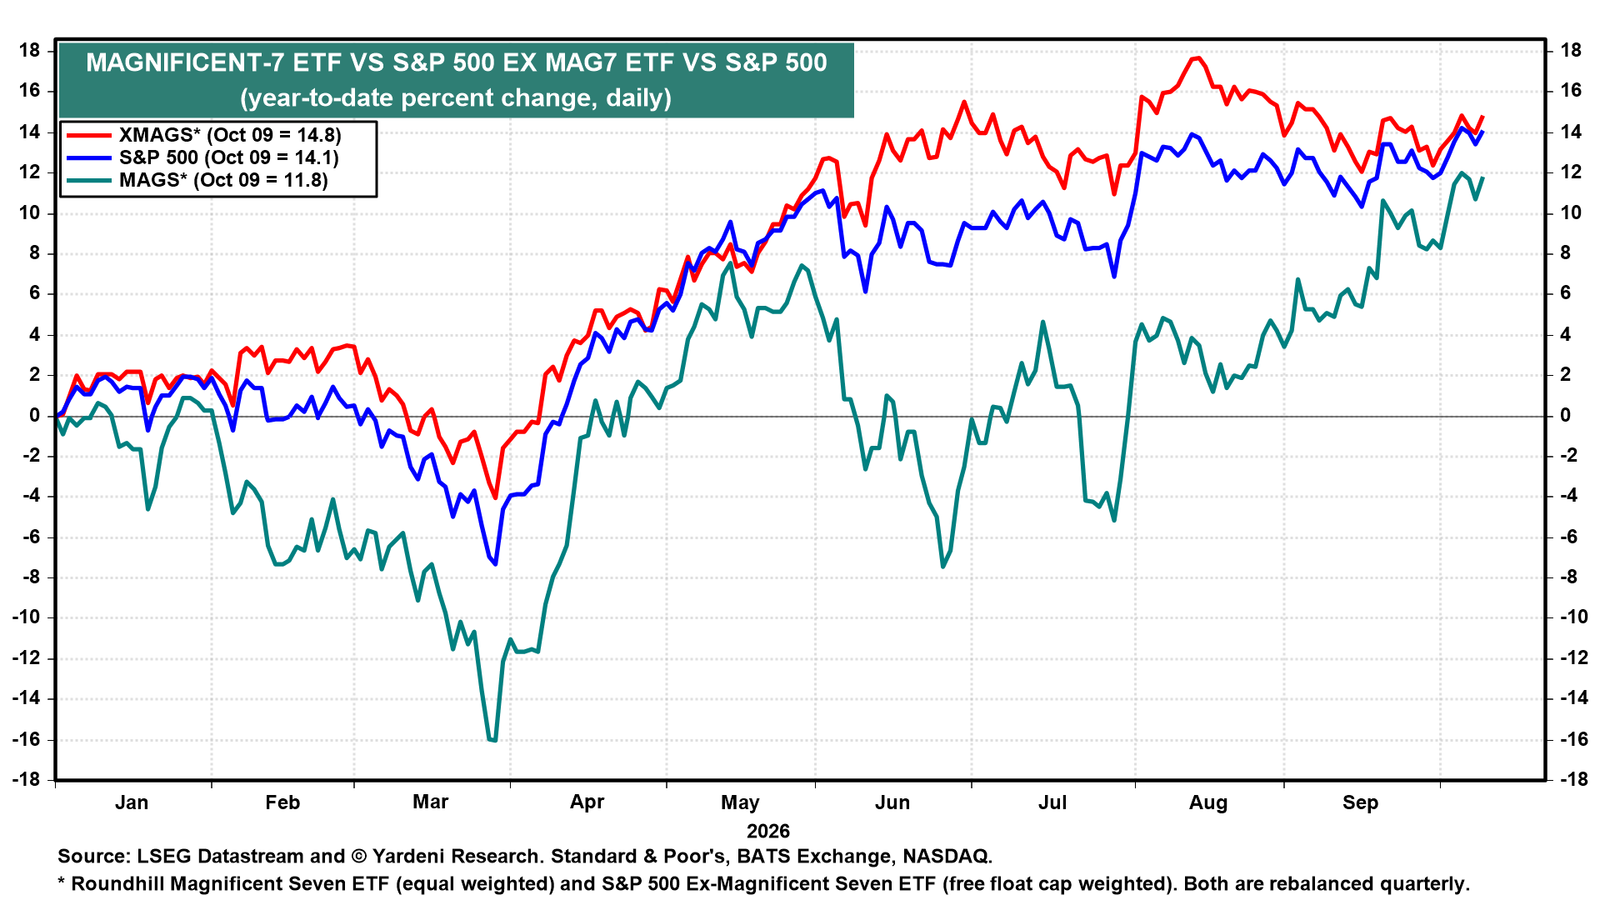
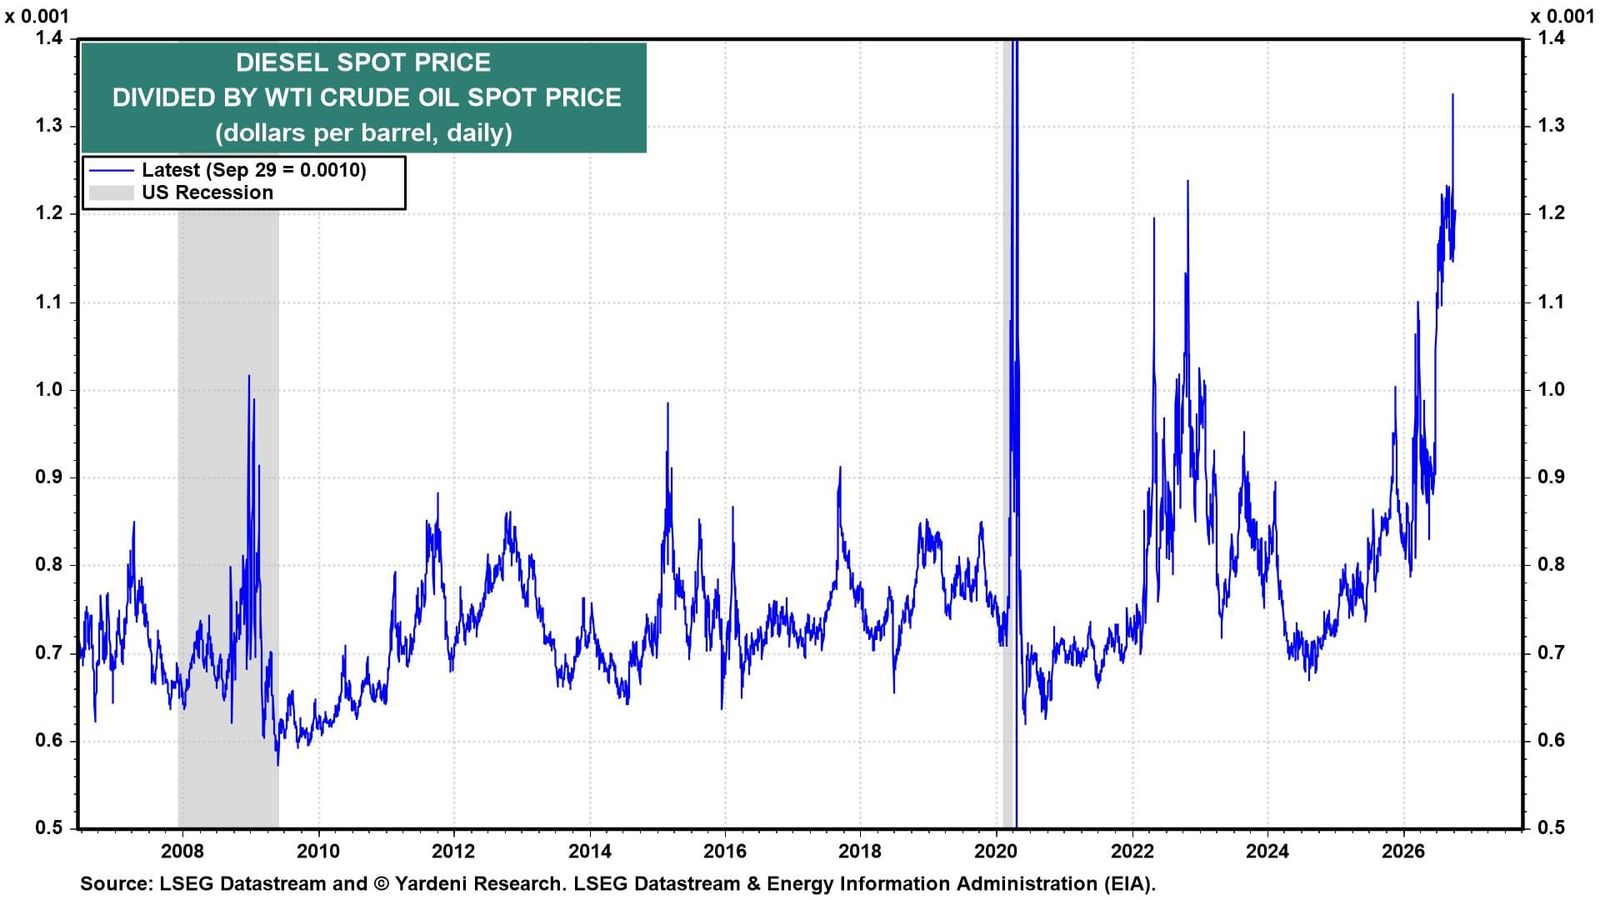
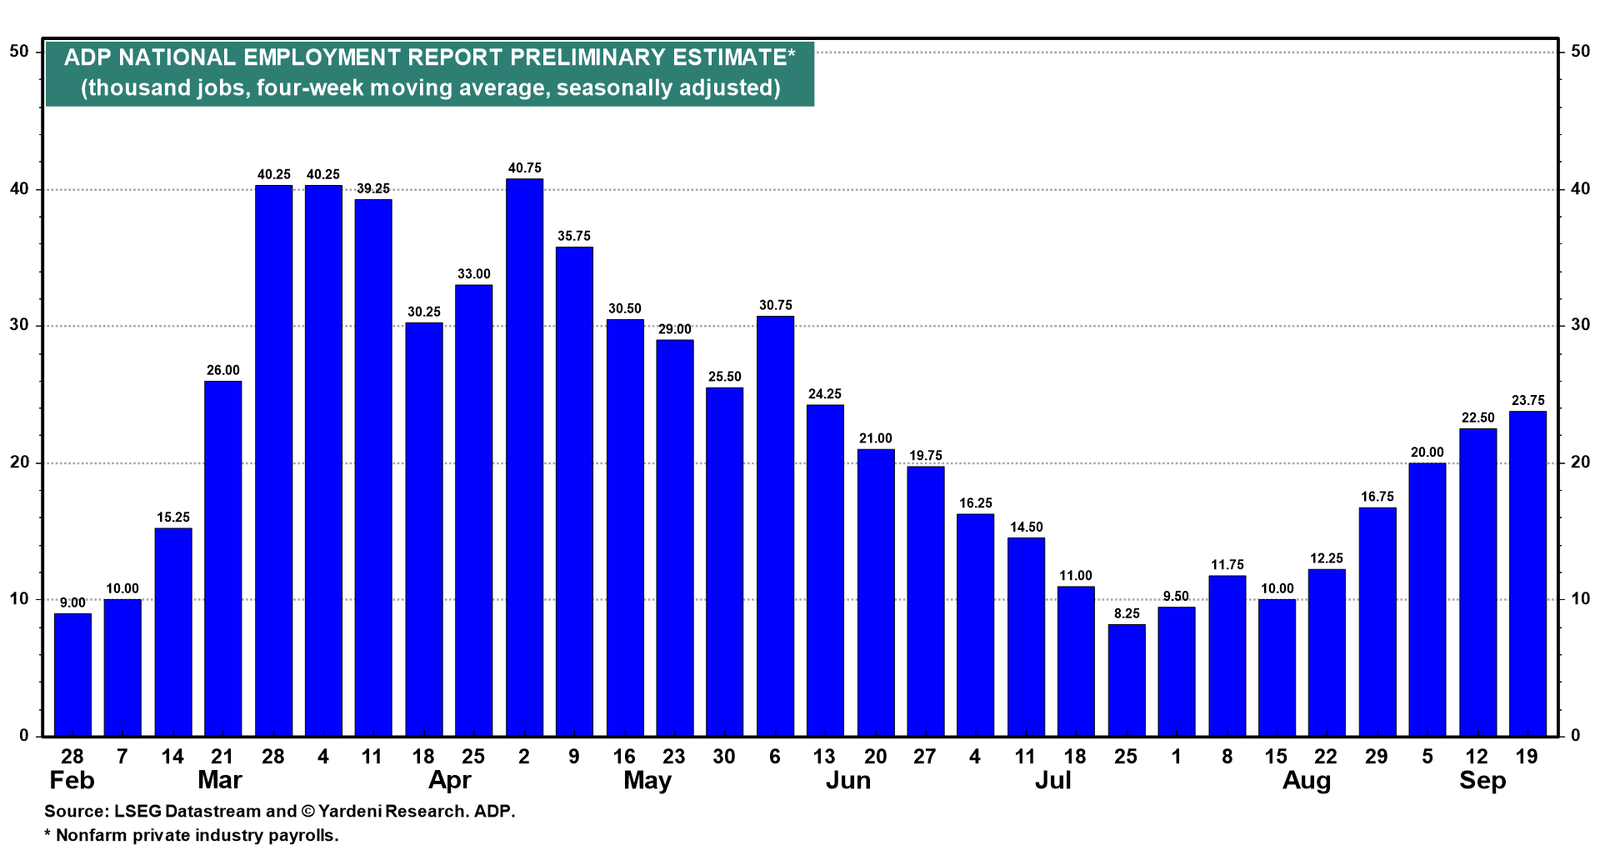
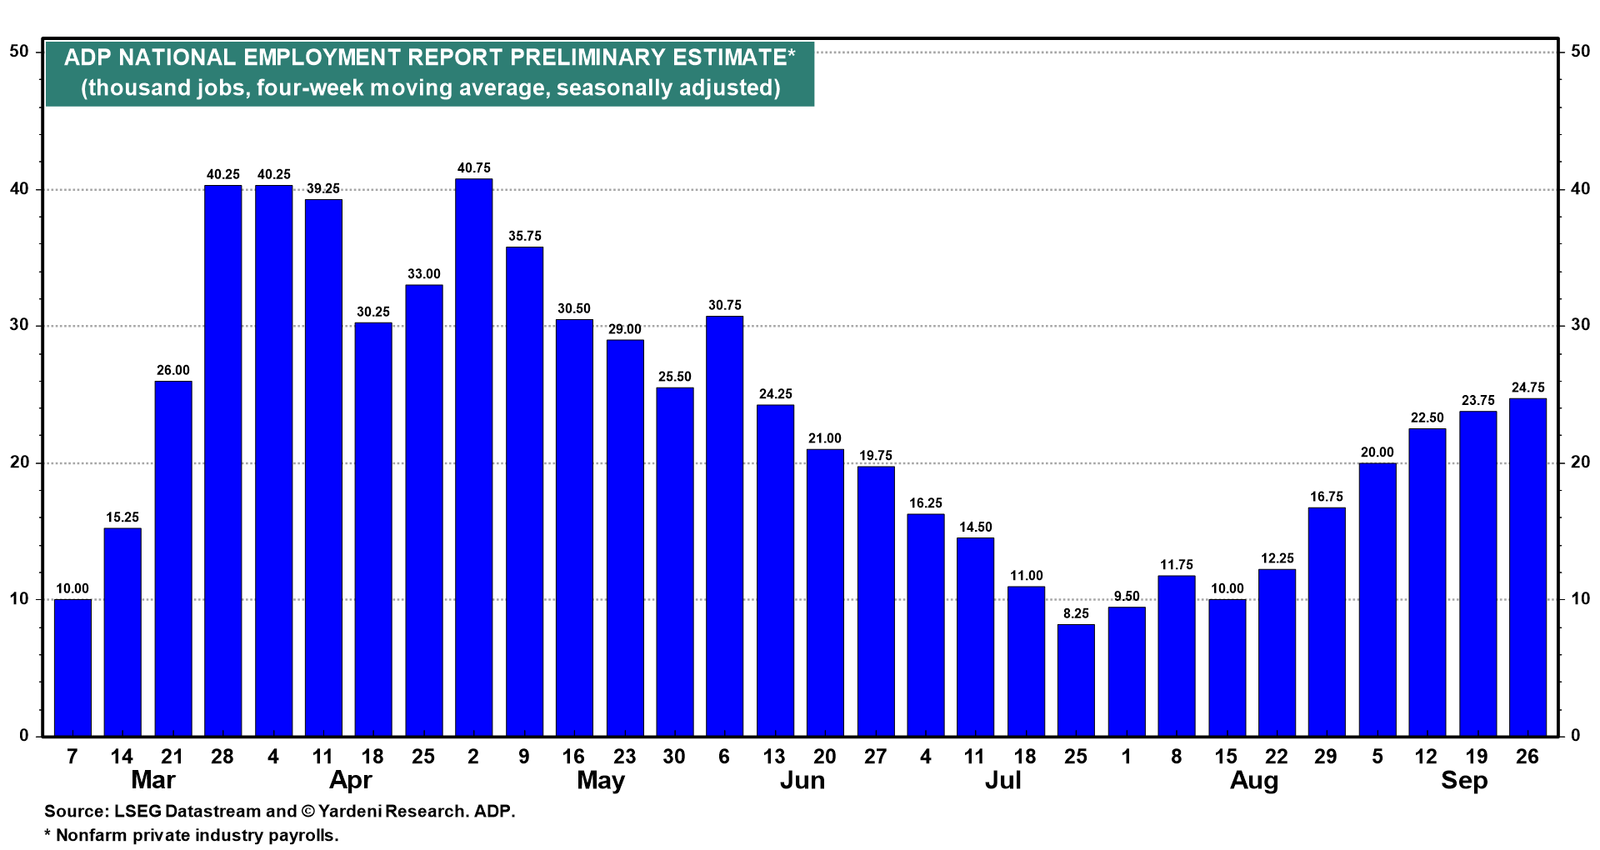
Yardeni QuickTakes June's Swoons The stock market was hit by another June swoon today. Investors were unnerved by the outcome of last Wednesday's FOMC meeting. The committee participants were more hawkish than expected, according to their Dot Plot. Fed Chair Kevin Warsh abstained from providing his dot, but he came across as very hawkish during his presser, repeatedly stressing the importance of the Fed achieving price stability. Also weighing on AI-related stocks is news that token prices are falling as competition heats up, and that a Chinese company introduced a new dirt-cheap open-source AI model. (1) Crude oil. Meanwhile, the June swoon for oil prices continued today. Brent crude fell below $77 a barrel this evening (chart). The decline reflects an improving supply outlook following the US-Iran MOU, with tanker traffic resuming through the Strait of Hormuz and the lifting of the US blockade of Iran's ports. The sharp reversal suggests the geopolitical risk premium in the crude oil market is rapidly unwinding and that the underlying trend is bearish, with crude prices falling from early 2022 until the latest war in the Middle East began. Another factor explaining why oil prices never spiked as much as the closure of the Strait of Hormuz would historically have implied, and why they have since fallen so sharply, is the secular decline in Chinese crude oil demand. After three decades of near-uninterrupted growth, crude imports fell to just 4.6 million barrels per day in May, well below their 12-month average (chart). Chinese demand was already being weighed down by rapid EV adoption, a prolonged property downturn, slower economic growth, and elevated oil inventories before the Middle East conflict. According to JPMorgan, China accounts for 74% of the recent decline in global crude imports. (2) Stock prices. Lower oil prices should boost US economic growth. That should be bullish for stocks. But the stock market has been weighed down by the Magnificent-7, which have been weighed down by mounting uncertainties about the AI trade (charts). The MAGS ETF is down 2.9% ytd, while the XMAG ETF is up 14.1%. There are signs that the stock market rally is broadening not only to the Impressive-493 stocks in the S&P 500, but also to SmallCaps (chart). The recent swoon in technology stocks hasn't been across-the-board. Memory chip and quantum computing stock prices have held up. Semiconductor stock prices are also holding up, while software stock prices have been weakening again recently (chart). The XBI Biotech ETF is also bucking the June swoon (chart). (3) Weekly Redbook retail sales & ADP employment. Contributing to the June swoon may be stronger-than-expected economic data because they increase the odds that the Fed will raise the federal funds rate sooner rather than later. The Redbook Retail Sales Index (on a same-store basis) rose 9.5% y/y during the week of June 19 (chart). The weekly ADP measure of payroll employment in the private sector rose to a solid reading of 30,750 during the first week of June (chart). (4) Purchasing managers. June's flash PMIs highlight that both manufacturing and services in the US remain in expansion territory, supported by the AI buildout and resilient consumer spending. While manufacturing is also expanding in the Eurozone and Japan, much of that strength may reflect inventory accumulation rather than the structural tailwinds that support US activity. Services remain weaker abroad, reflecting less resilient consumers and weaker domestic demand. The US M-PMI hit a 49-month high in June (chart). The NM-PMI ticked higher, with new orders getting a lift from the FIFA World Cup and a partial restoration of business confidence as oil prices fall. The Eurozone M-PMI remains in expansion but is losing momentum, with new orders stagnating and export demand falling (chart). The NM-PMI stayed in contraction for a third straight month, though the downturn is easing as tourism and leisure show early signs of recovery. In Japan, manufacturing expanded for a sixth straight month, supported by Middle East conflict-related inventory stockpiling, while services recovered modestly from May's stagnation (chart). However, elevated inflation continues to weigh on consumer spending.
Preview settimana — dati macro attesi, eventi Fed, earnings
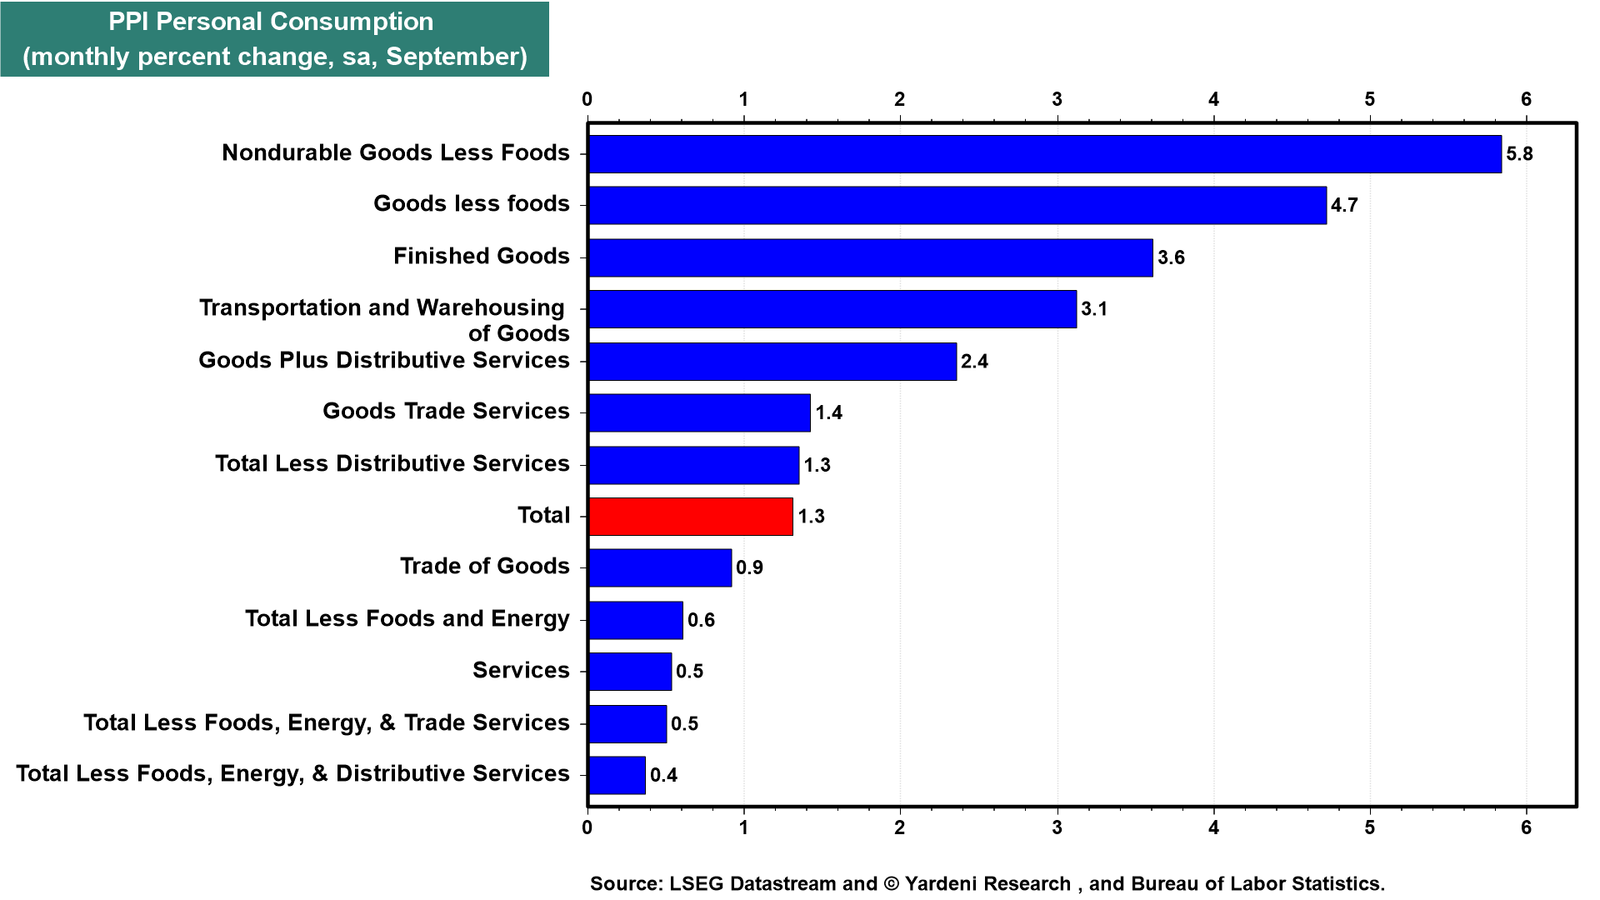
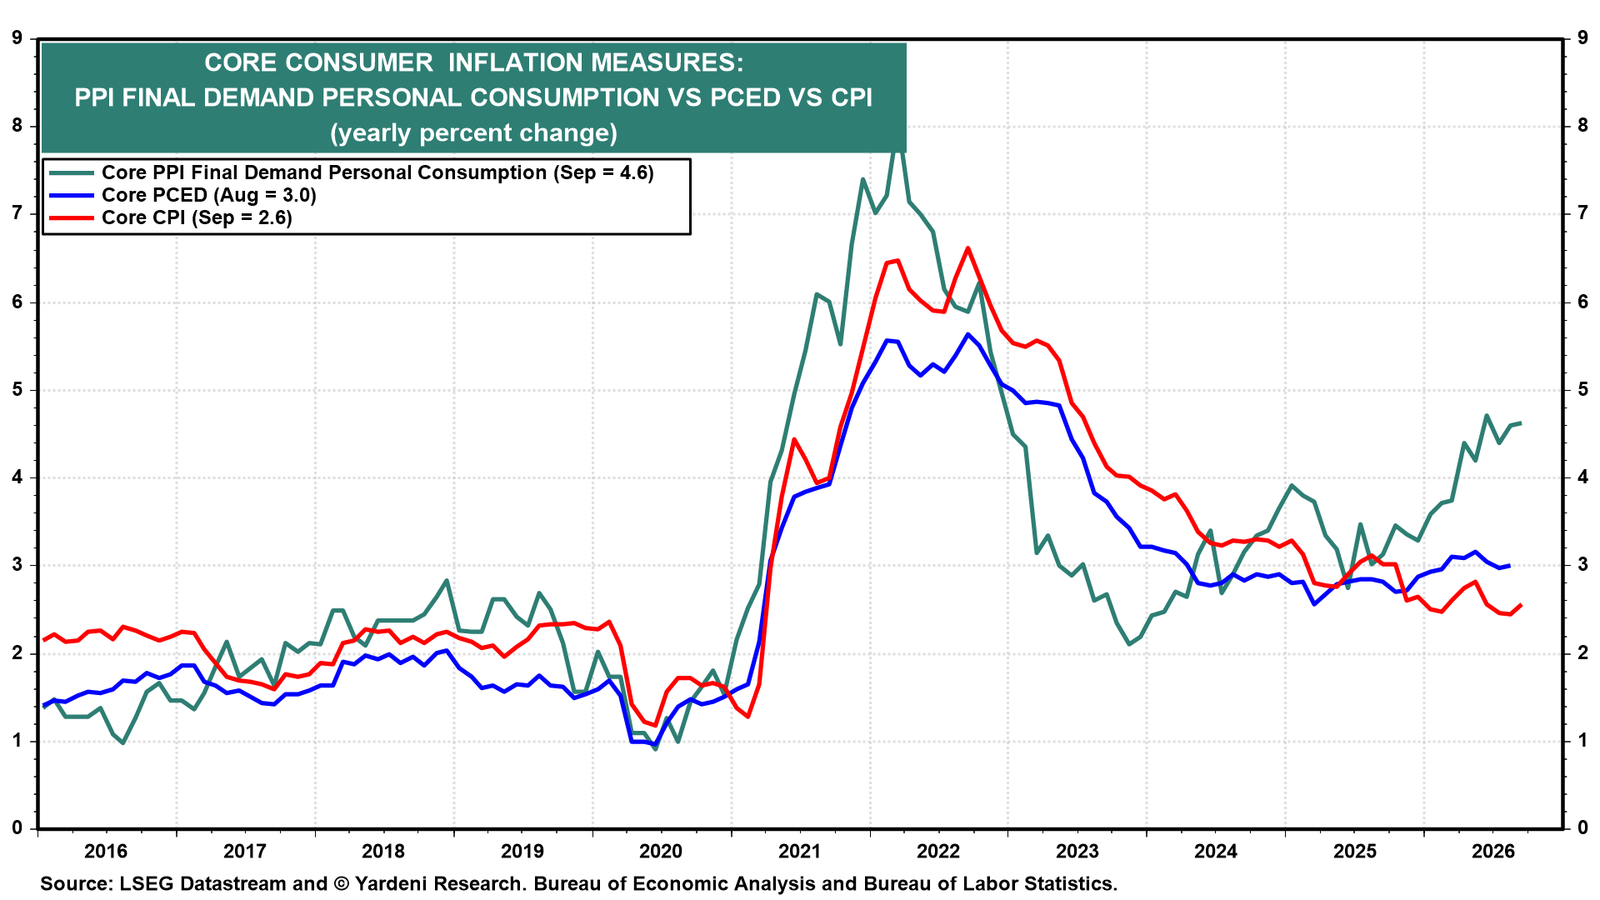
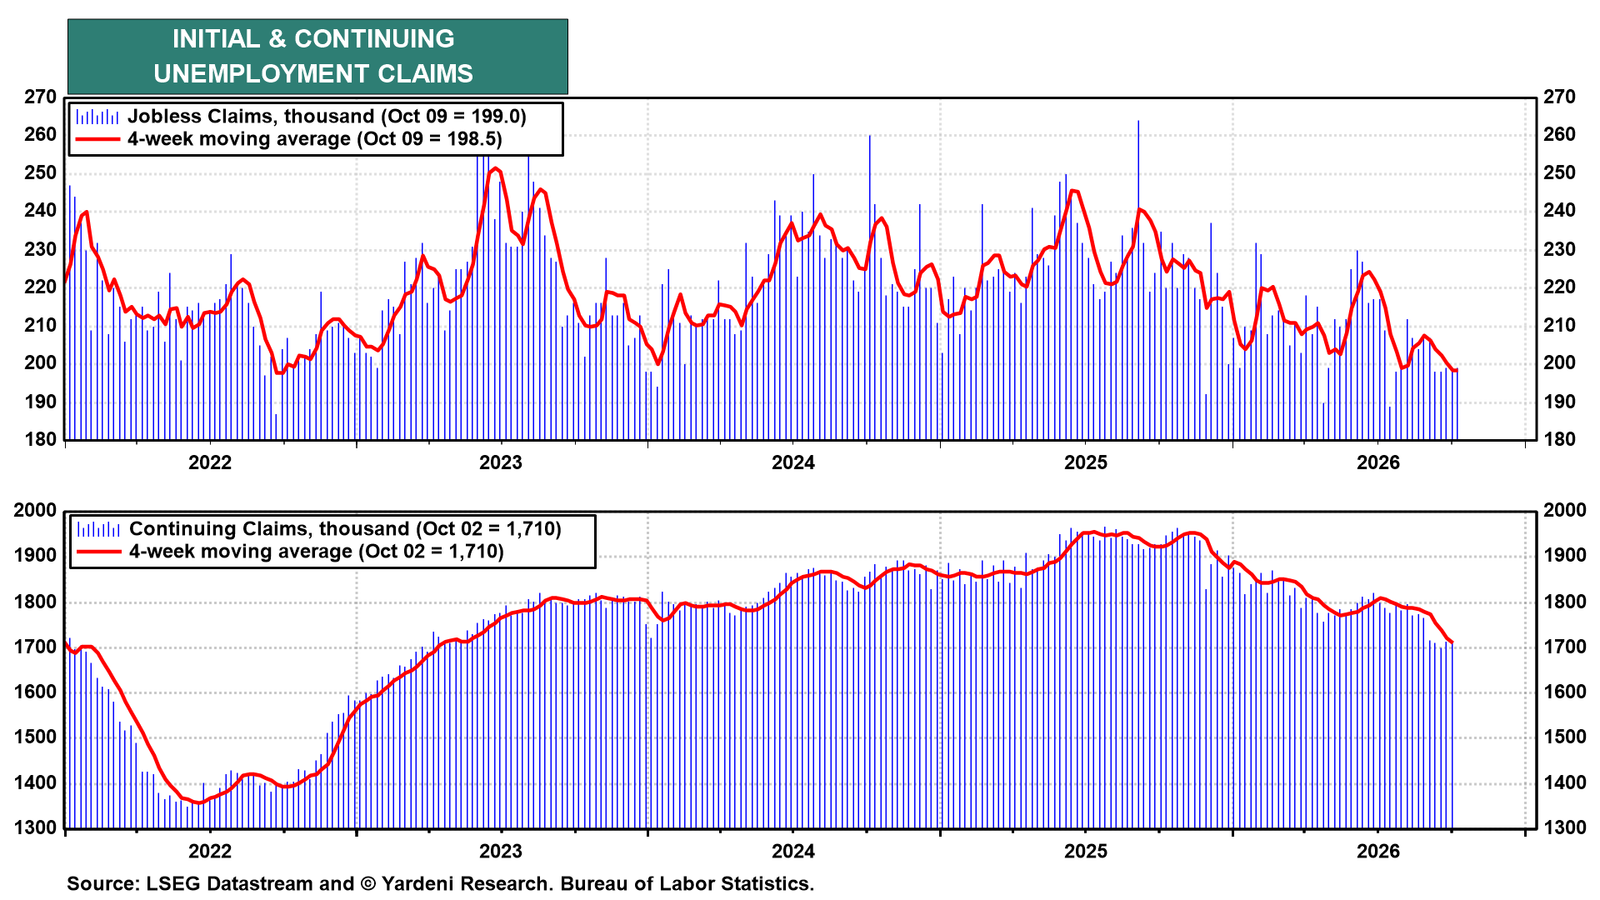
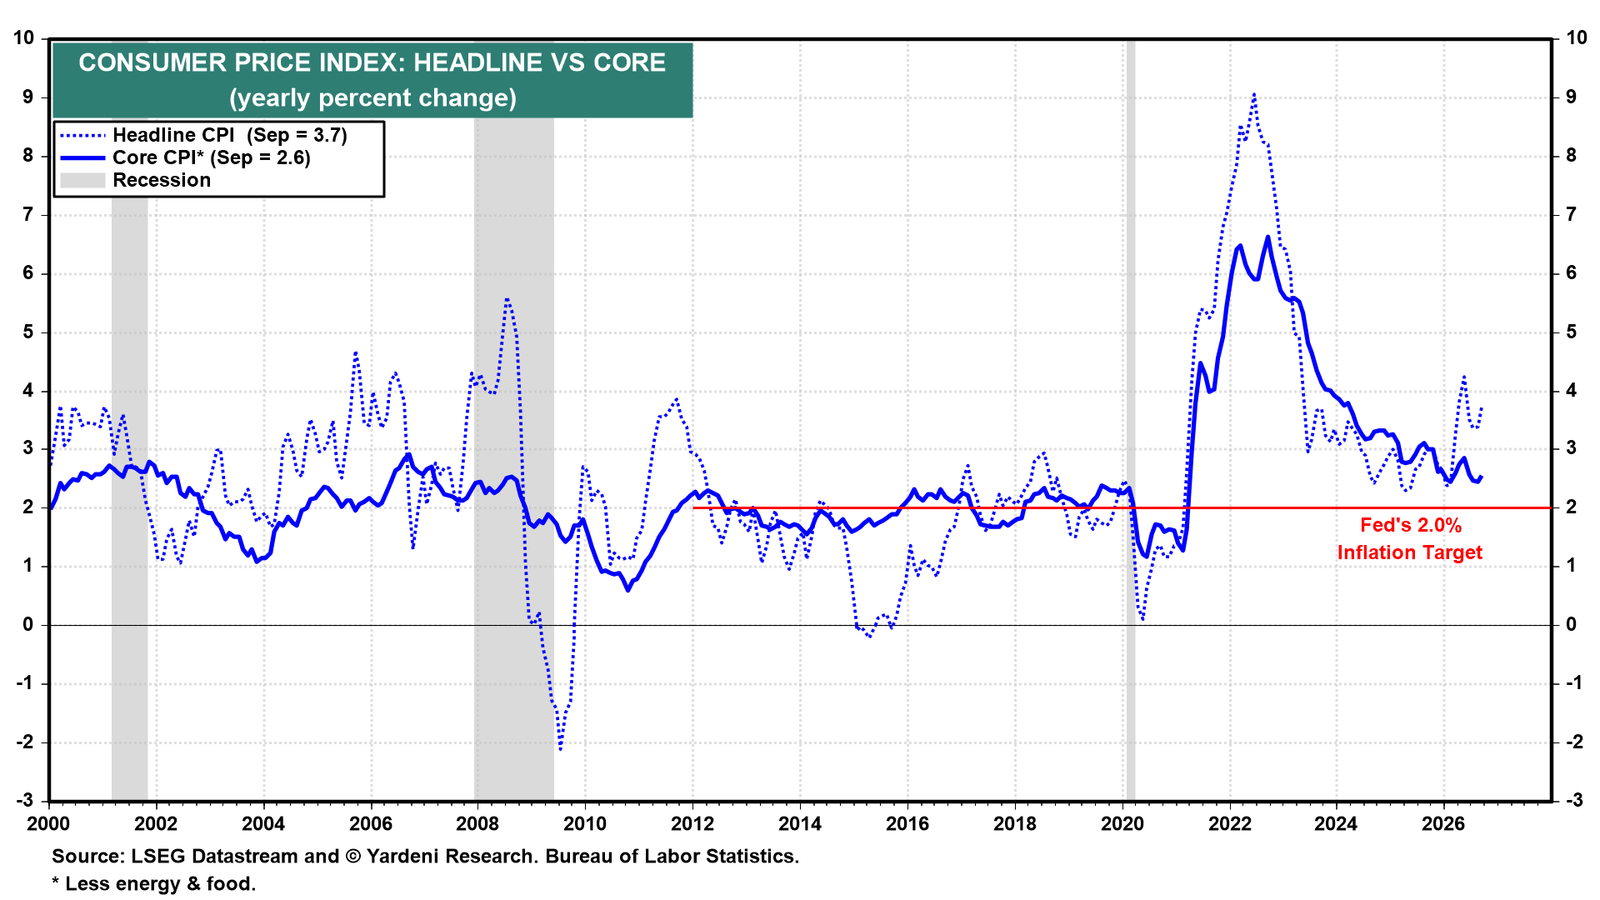
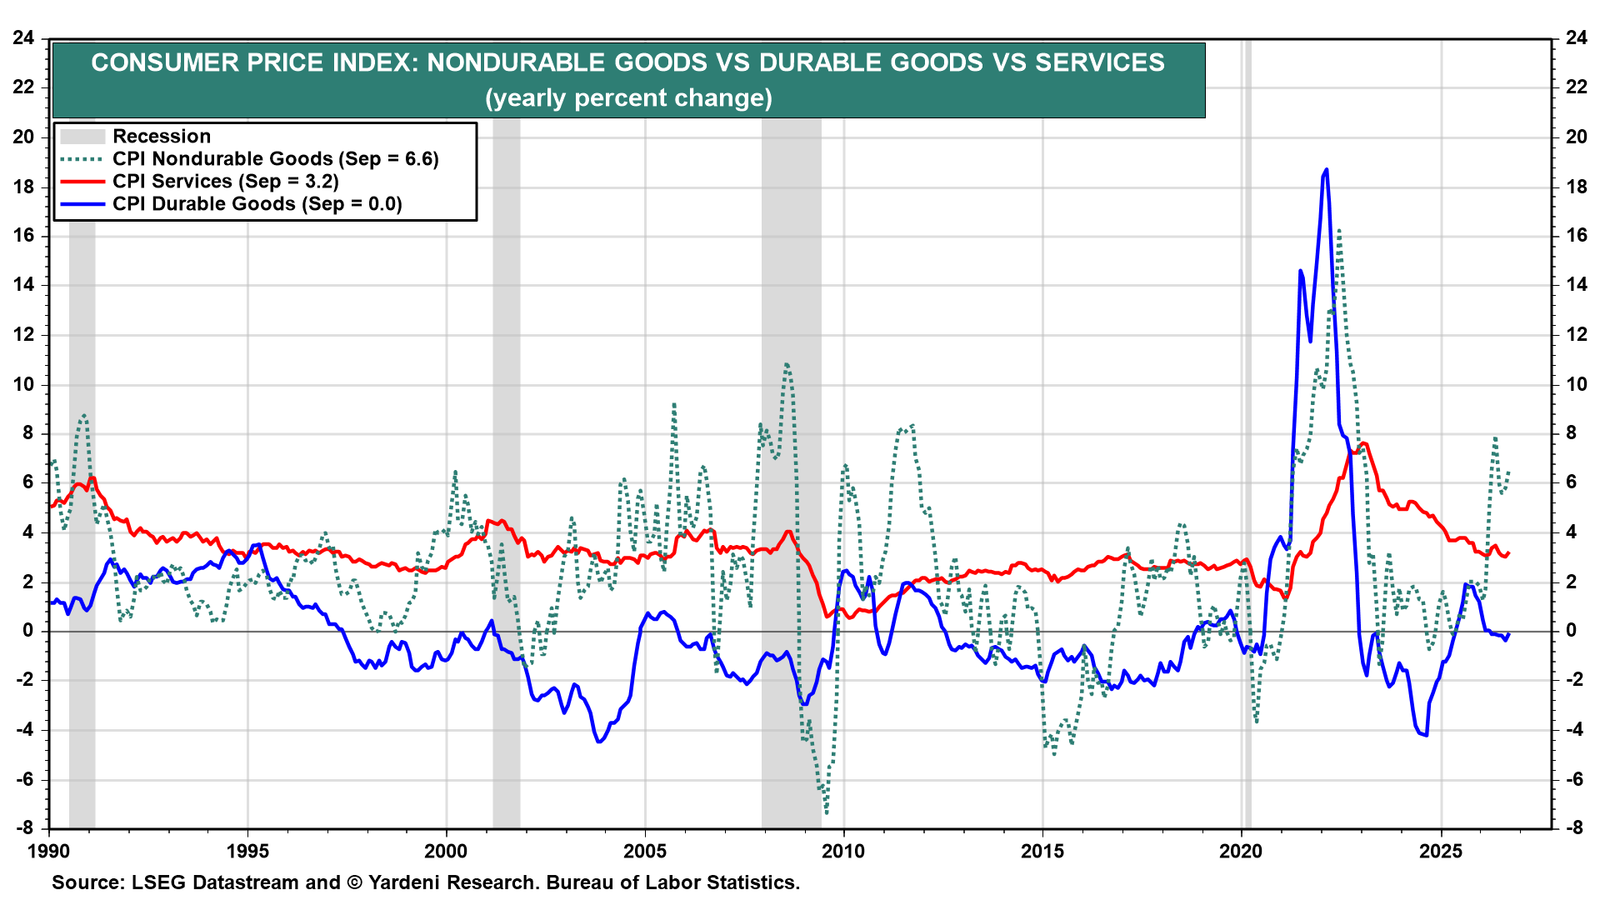
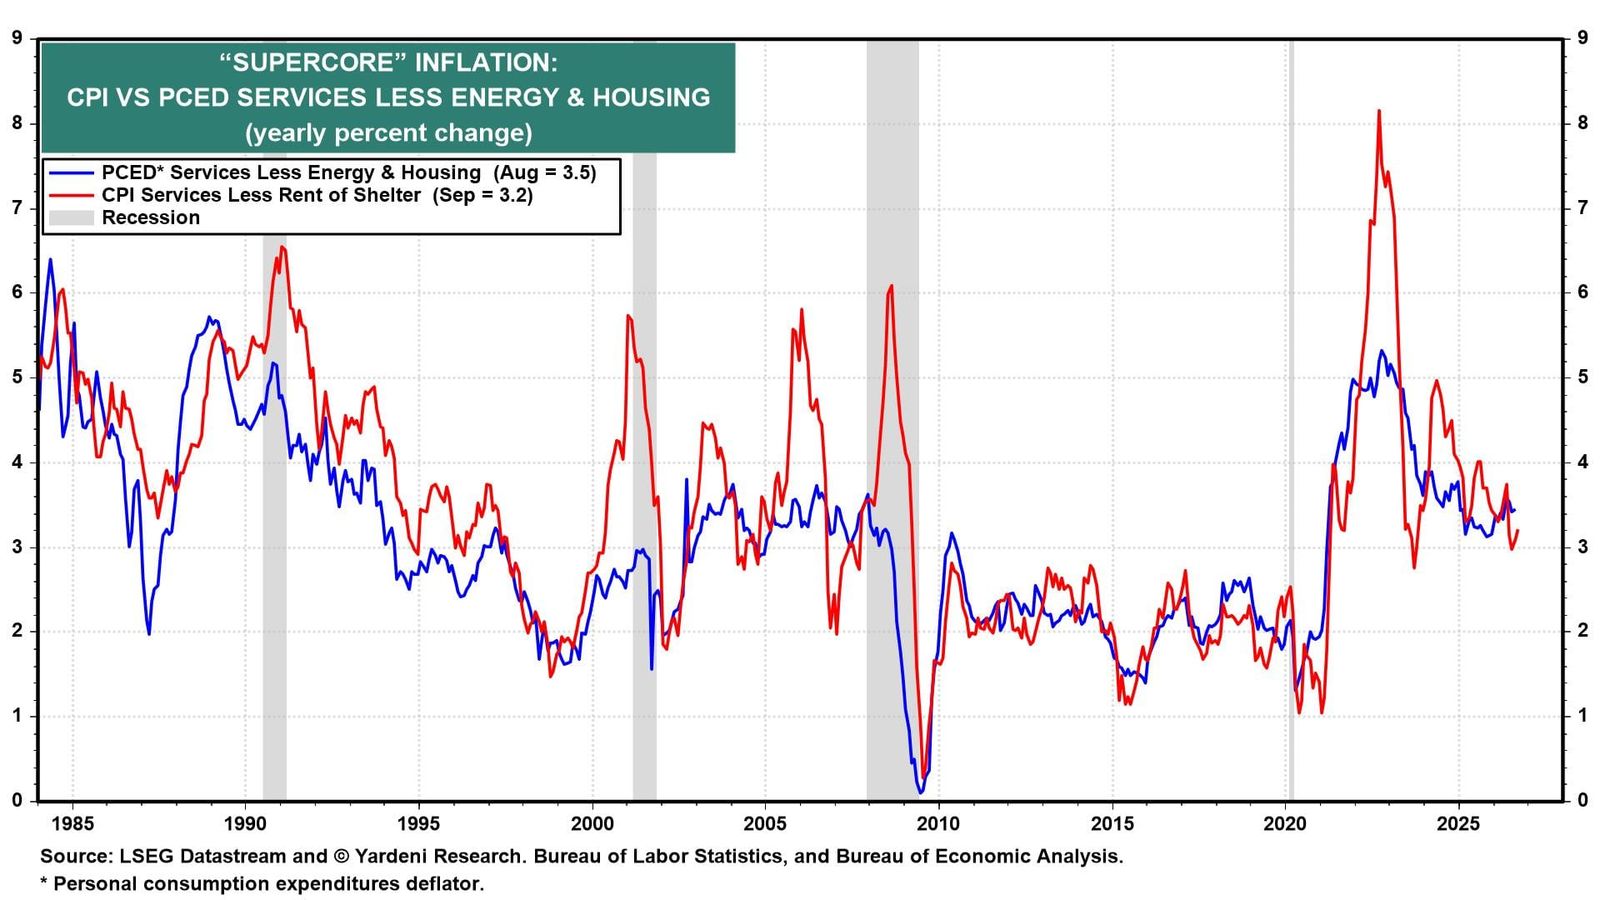
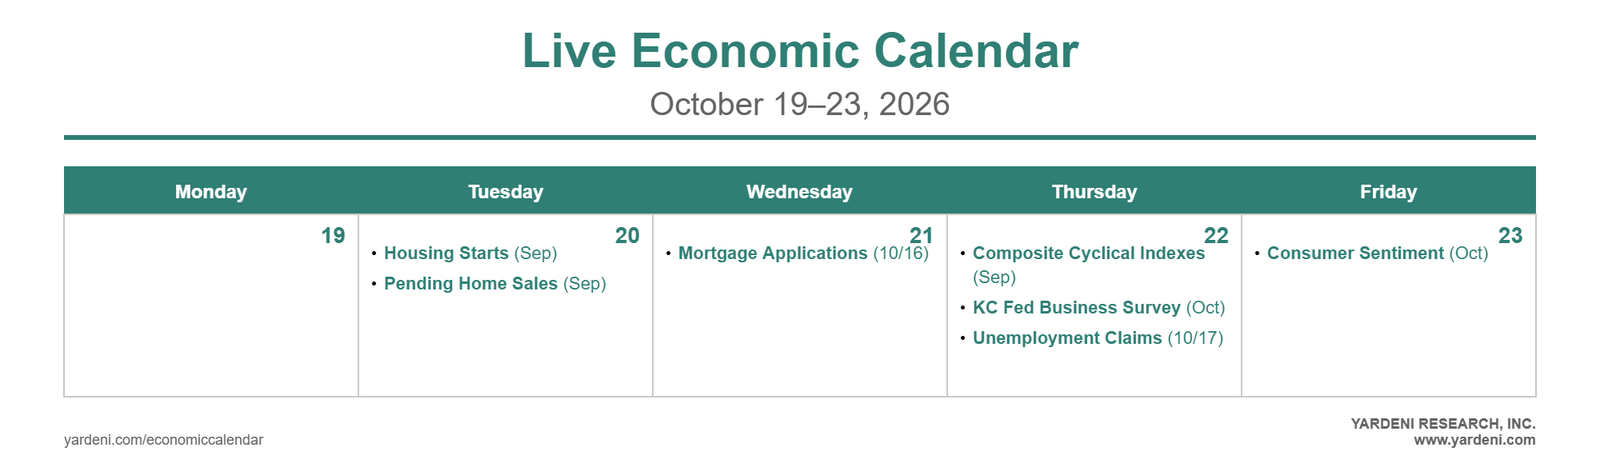
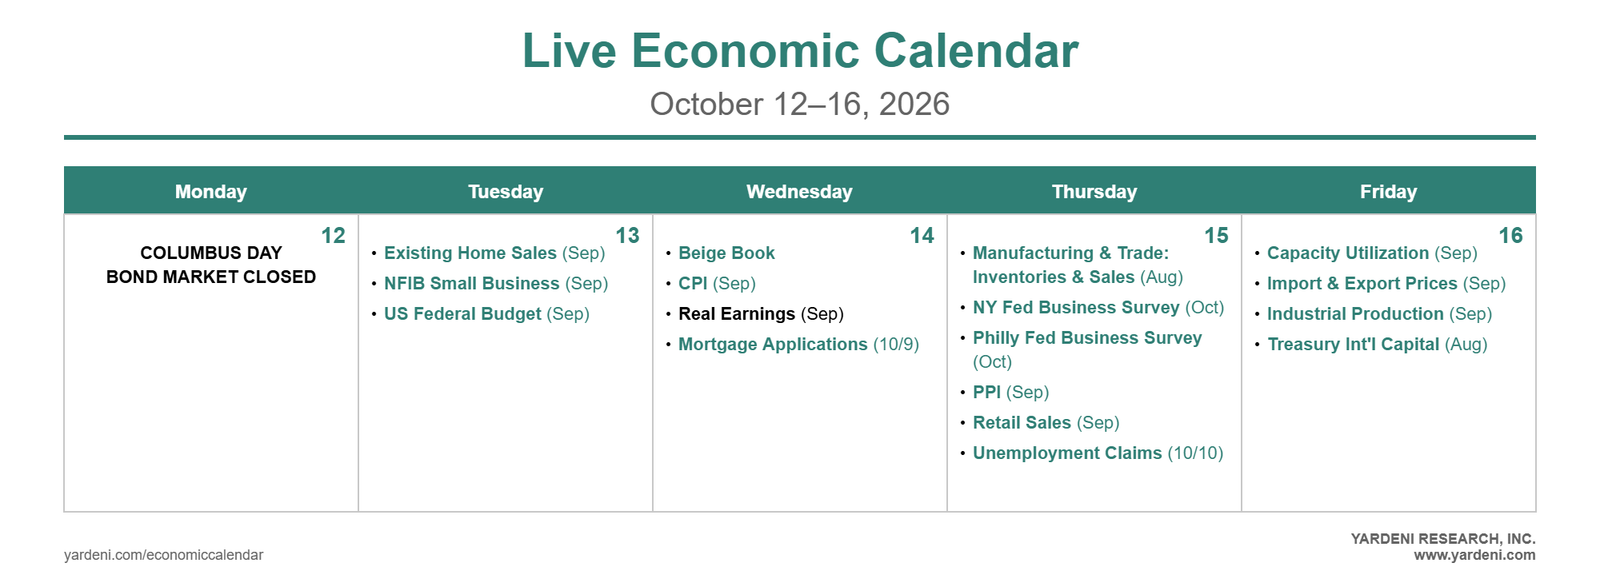
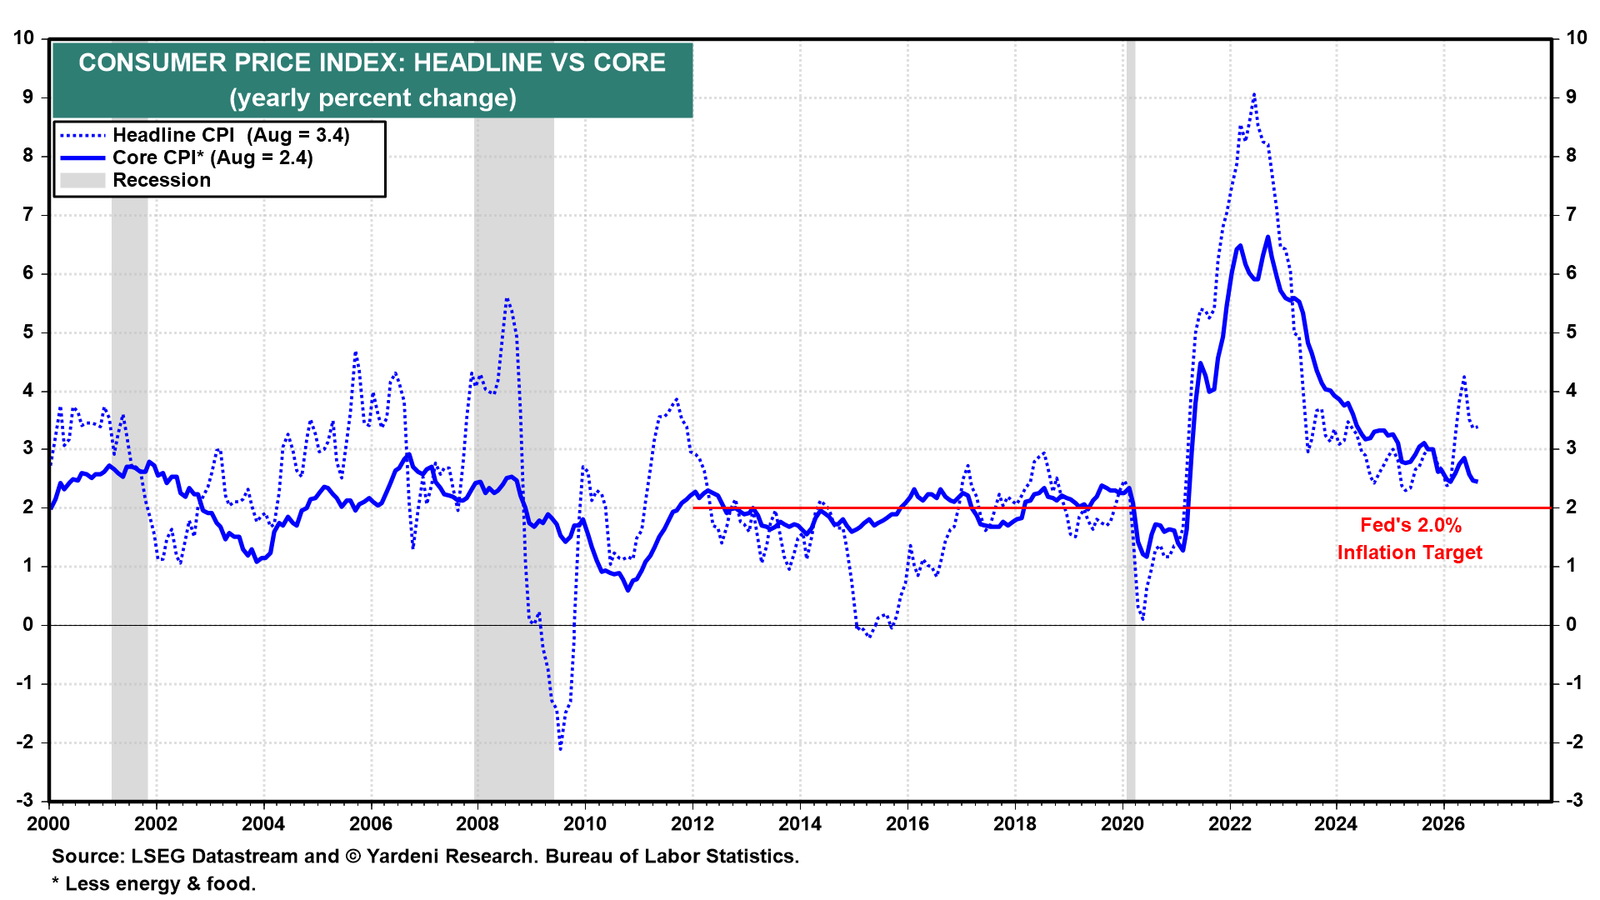
Yardeni QuickTakes ECONOMIC WEEK AHEAD: June 22-26 The US economic calendar is mostly quiet this week, but Thursday packs a heavy data load: final Q1-2026 GDP, May PCED, May durable goods orders, and weekly jobless claims. Lots of Fedspeak will be provided by FOMC participants this week. They will not lack for opinions to compare with those Fed Chair Warsh expressed in his debut presser last week. Globally, the Bank of Canada's Tiff Macklem speaks alongside Tuesday's May CPI release, and flash PMIs from Germany, France, the Eurozone, and the UK also drop on Tuesday. On Wednesday after the close, Micron Technology, arguably one of the world's most important companies, reports fiscal Q3 earnings (chart). Wednesday's FOMC meeting reset the bar. The June Summary of Economic Projections raised the median 2026 federal funds rate projection from 3.4% to 3.8% and the median 2026 core PCED inflation projection from 2.7% to 3.3%. Nine of 18 dots now pencil in hikes by year-end. The 2-year US Treasury note jumped to 4.19% in response (chart). Warsh's first press conference left no ambiguity. He called inflation "a choice," insisted price stability is the FOMC's number-one goal, and signaled the Fed will look through any supply-side disinflation from Iran. We continue to expect a first hike as soon as July. That expectation is more hawkish than the markets’, which put the odds of a hike in July at just 38% and one by September at 92%. Here are the key economic releases most likely to shape investors' thinking this week: (1) GDP. The final reading of Q1-2026 GDP (Thu) should hold near the 1.6% second estimate (chart). The Atlanta Fed's GDPNow model has Q2-2026 tracking 3.0% saar as of June 17, led by surging fixed business equipment (+13.8%) and goods exports (+15.2%) (chart). The AI-led capex cycle remains the engine of the Roaring 2020s. (2) PCED. May's headline and core PCED (Thu) are expected to be up 0.38% and 0.24%, according to the Cleveland Fed's Inflation Nowcasting. On a y/y basis, the numbers are hot at 3.97% and 3.30%. April's headline and core PCED inflation rates were 3.8% and 3.3% y/y. May's CPI rose 4.2% y/y, and PPI Final Demand rose 5.9% (chart). The risk again skews to an upside surprise. (3) Unemployment. Initial unemployment insurance claims (Thu) totaled 226,000 in the latest week, with the four-week moving average continuing to rise to 223,200 (chart). Continuing claims were 1,810,000 in the week ended June 5, with the four-week moving average rising to 1,780,000. (4) PMIs and business surveys. S&P Global's June flash PMIs (Tue) follow May's final readings of 55.1 for manufacturing and 50.7 for services (chart). The week's regional Fed business surveys include Richmond (Tue), Chicago (Thu), and Kansas City (Thu). Both the ISM national M-PMI and the regional Fed average have turned higher in recent months, confirming that the manufacturing recovery is broadening (chart). Prices-paid components remain elevated, with the regional average at 55.2 in May, reinforcing the upside inflation risk. (5) Consumer sentiment. The final June University of Michigan reading (Fri) follows June's preliminary print of 48.9, with current conditions at 48.4 and expectations at 49.3. The more important numbers are the one-year and three-year inflation expectations. The former should decline along with the price of gasoline (charts).
Recap settimanale — summary performance e temi
Yardeni QuickTakes Weekly Roundup - June 21st Thank you for being a valued member of Yardeni QuickTakes. Here's a recap of the insightful articles, webinars, and market analyses you enjoyed this week: US MARKET CALL: Is Irrational Exuberance Driving FEMO? The stock market bubble of the late 1990s was driven by fear of missing out (FOMO) on the tech-led bull market. As a re… Yardeni QuickTakes •Ed Yardeni Geopolitical Release Valve Taking Pressure Off Resilient Economy The US-Iran interim peace deal is shaky; but if it holds, it will end the US blockade of Iranian ports and reopen the S… Yardeni QuickTakes •Ed Yardeni A Hawk In Dove's Clothing ... June Swoon Is Back ... 'We Have A Task Force On That' We weren't surprised by most of the news following today's FOMC meeting. We expected the committee to pivot from April'… Yardeni QuickTakes •Ed Yardeni WEEKLY WEBCAST: Hawks Versus Doves Debate At The Fed This week’s FOMC meeting will be the first over which Kevin Warsh, President Trump’s dovish appointee, presides as Fed … Yardeni QuickTakes •Ed Yardeni Crib Notes For Warsh & Co. On The Fed's Dual Mandate During the final four months of 2025, the Fed lowered the federal funds rate (FFR) three times by a total of 75bps. The… Yardeni QuickTakes •Ed Yardeni Why Is The US More Exuberant Than China? China has accomplished a great deal over the past few decades, transforming from a poor, insular, and rural economy to … Yardeni QuickTakes •Ed Yardeni GLOBAL MARKET CALL: Peace Dividend Should Revive 'Go Global' The past week was a win for our "Go Global" pivot at the end of last year, as foreign equity markets mostly outperforme… Yardeni QuickTakes •Ed Yardeni
Link e note webcast settimanale
Yardeni QuickTakes WEEKLY WEBCAST: Hawks Versus Doves Debate At The Fed This week’s FOMC meeting will be the first over which Kevin Warsh, President Trump’s dovish appointee, presides as Fed chair. Will he succeed in dissuading the hawkishly leaning committee from moving to a tightening bias? Today, Ed and Elias set out both the dovish and hawkish points that the committee no doubt will discuss in what’s bound to be a heated debate. … Also: Warsh steps into his new role planning to implement big changes at the Fed. Elias describes how Warsh views the Fed’s role, the reforms he has in store, and the potential ramifications for Wall Street. 🔒Exclusive Early Access for Paid Members: Below, you'll find Dr. Ed's latest webcast. Paid members can enjoy immediate access to the video. This content will become available to the public at a later date—don't miss out on early insights, consider upgrading today!