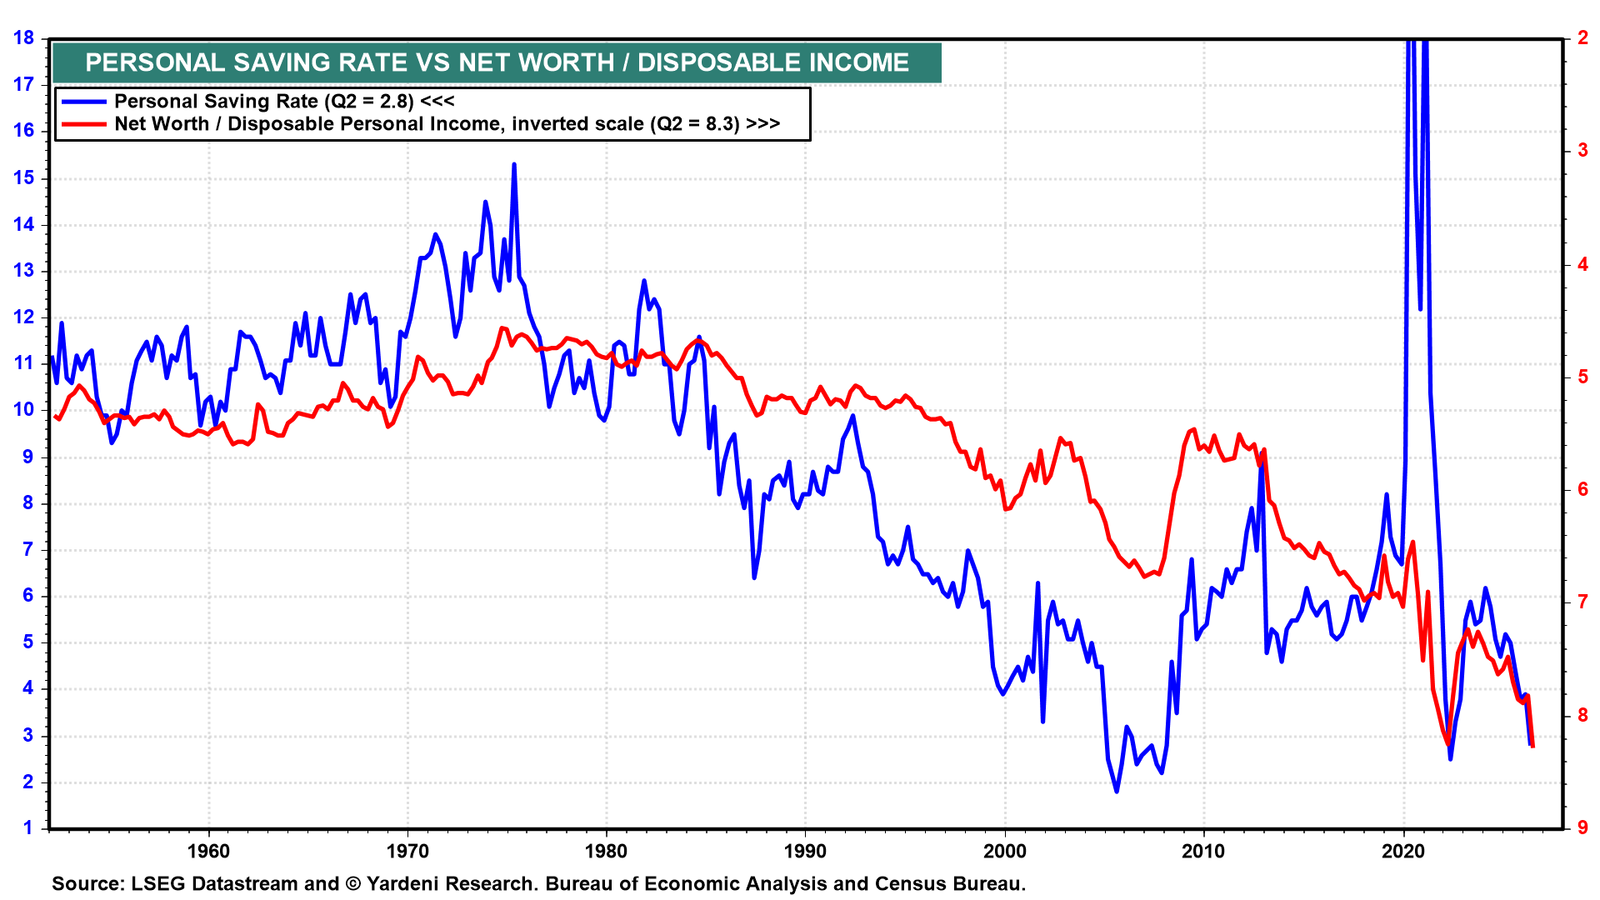
Consumer spending resilience increasingly has become a balance-sheet story rather than an income-statement story. The personal saving rate has been falling since January 2024 as consumer outlays have outpaced disposable personal income (chart). Many economists believe that this is unsustainable. Not us.
We think that the saving rate will turn negative by the end of the decade as retiring Baby Boomers finance their spending with their sizeable net worth. Indeed, there is a clear inverse correlation between the personal saving rate and the ratio of household net worth to disposable personal income (DPI). As household net worth increases relative to DPI, consumers tend to save less of their DPI.
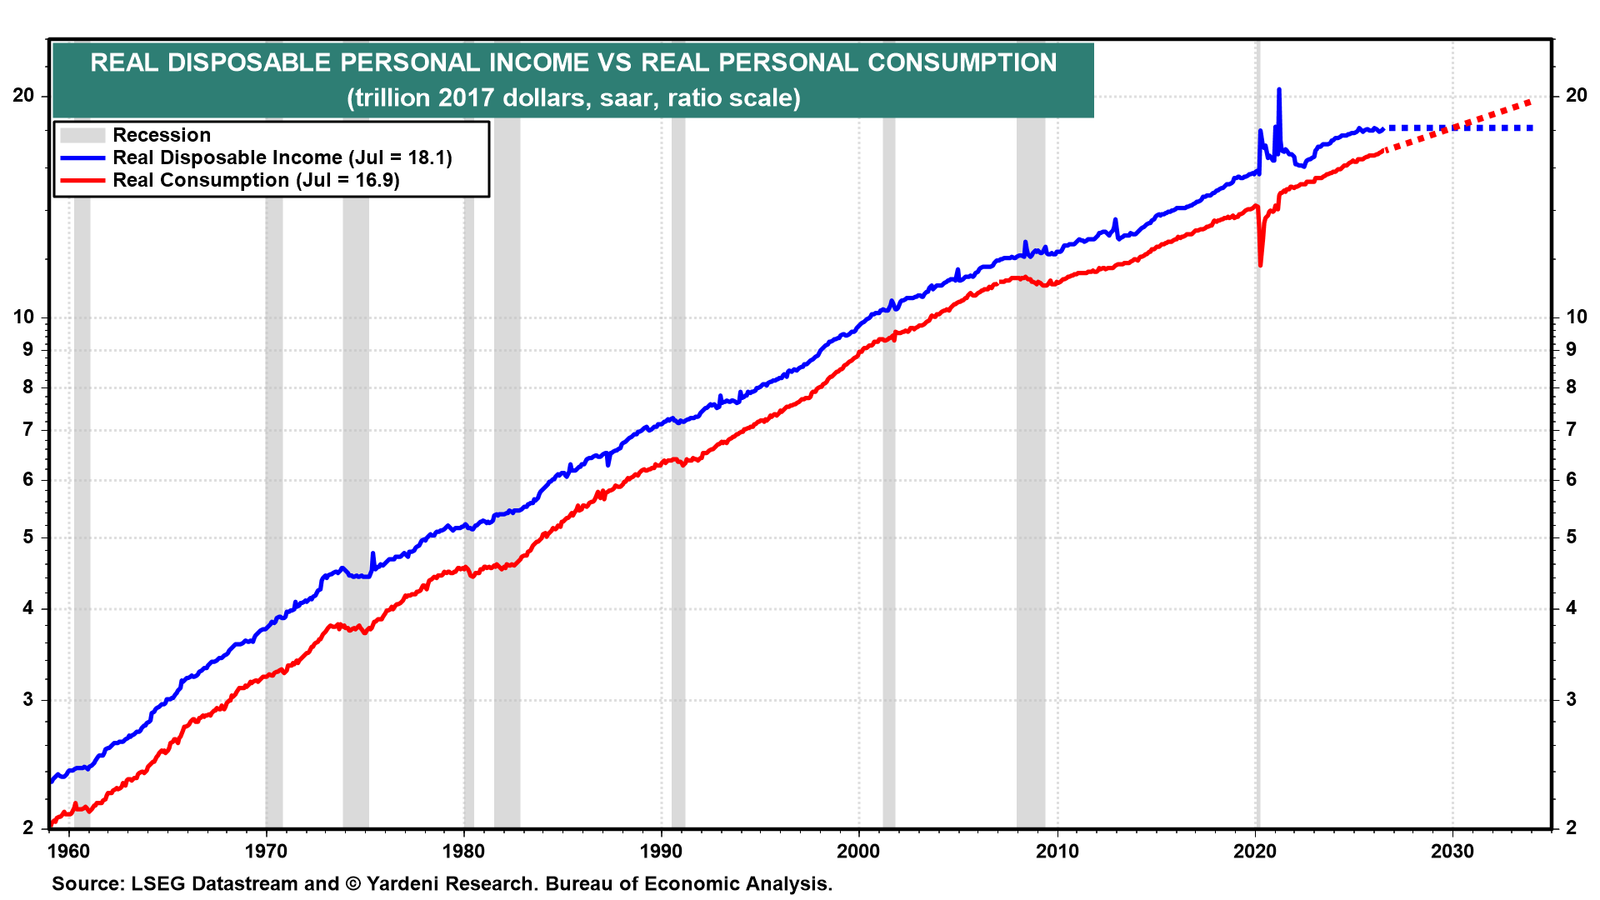
Inflation-adjusted consumer spending rose at a 3.2% annualized rate in Q2, the strongest pace since Q3-2025, even as real disposable personal income fell at a 1.5% annualized rate, the largest decline since Q2-2022. On a monthly basis, the former has been rising.
If current trends continue, inflation-adjusted consumer spending will exceed total disposable income by 2030 (chart). In this scenario, the personal saving rate would turn negative. This prospect is already prompting the economy’s naysayers to say a negative personal saving rate isn’t sustainable. They conclude that diminishing savings will force consumers to retrench.
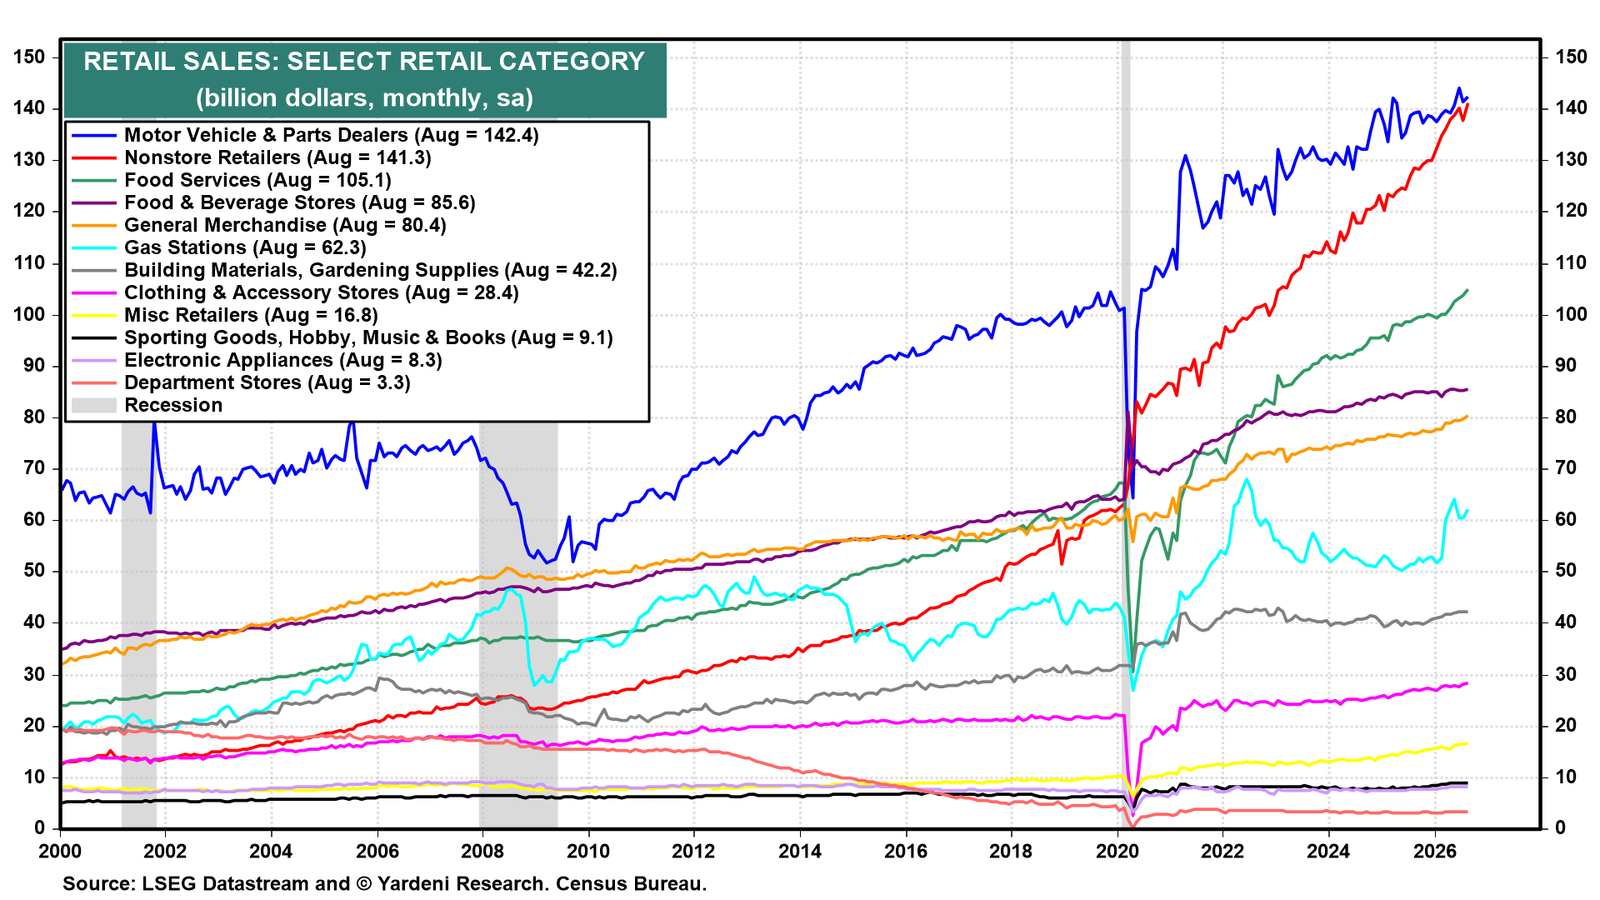
However, there are no compelling signs yet that America’s shoppers are about to slow down. August's retail sales report showed a strong rebound in consumer spending, beating consensus expectations and erasing July's pullback. Many of the major components of retail sales rose to record highs in August (chart).
So what helps explain consumers' ongoing strength? A closer look at Baby Boomers' balance sheets provides the answer. Consider the following:
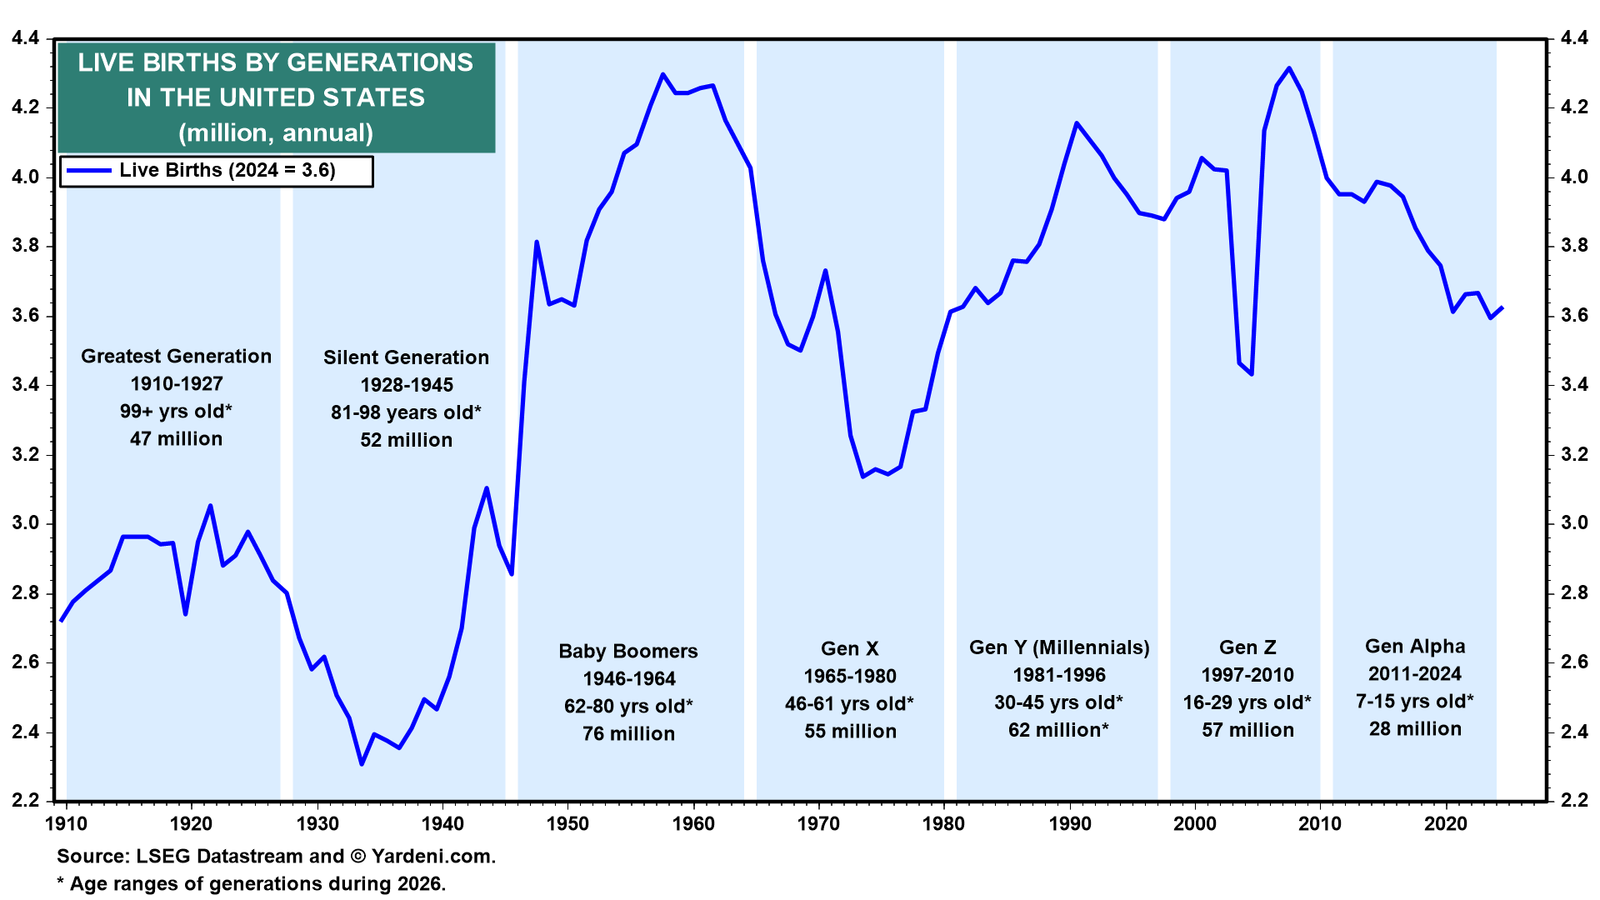
(1) Almost all Baby Boomers are seniors. After World War II, 76 million Baby Boomers were born between 1946 and 1964 (chart). They are currently 62 to 80 years old. They will all be seniors (aged 65 and older) by the end of the decade in 2029.
As a result, the number of households headed by a senior rose to a record 39.3 million last year, the largest of all the other age cohorts (chart).
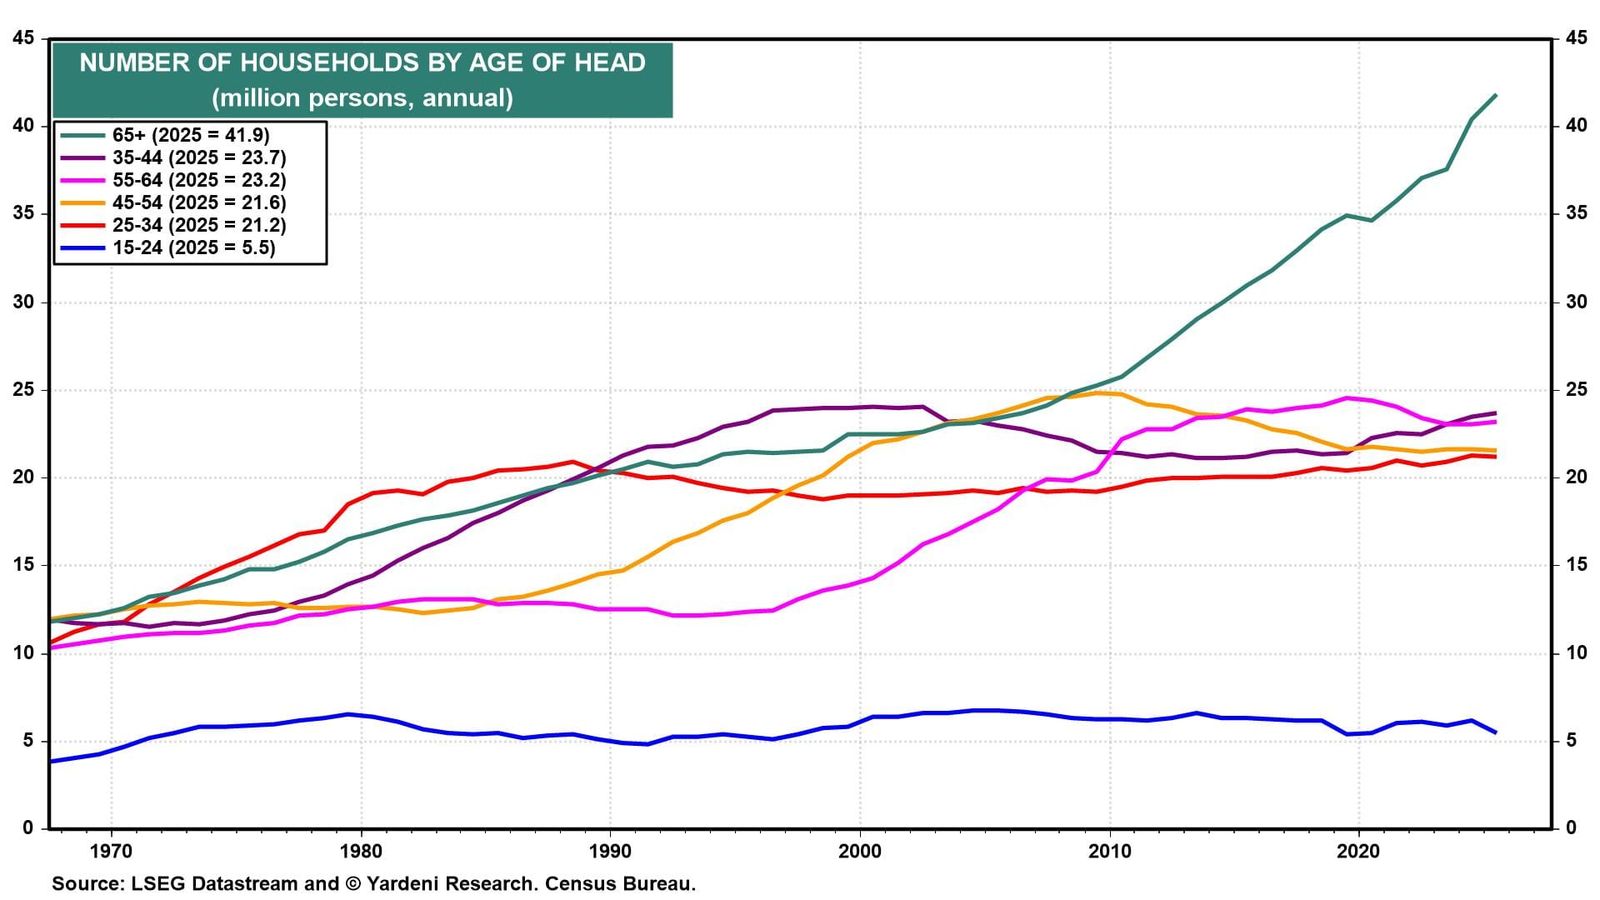
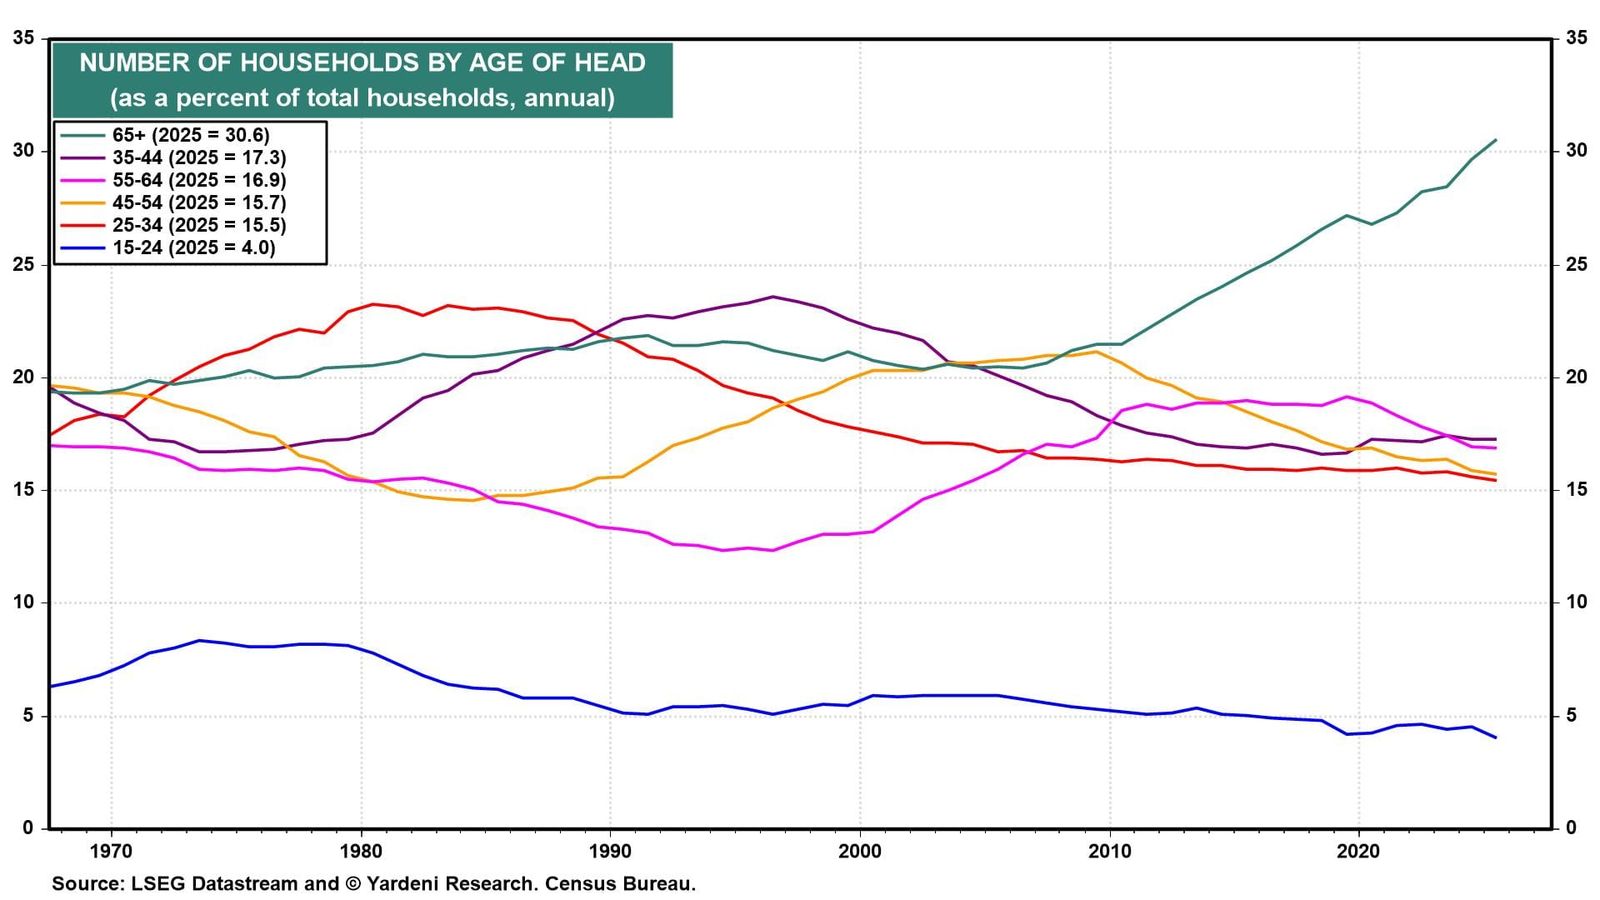
Households headed by a senior now account for almost a third of all households (chart).
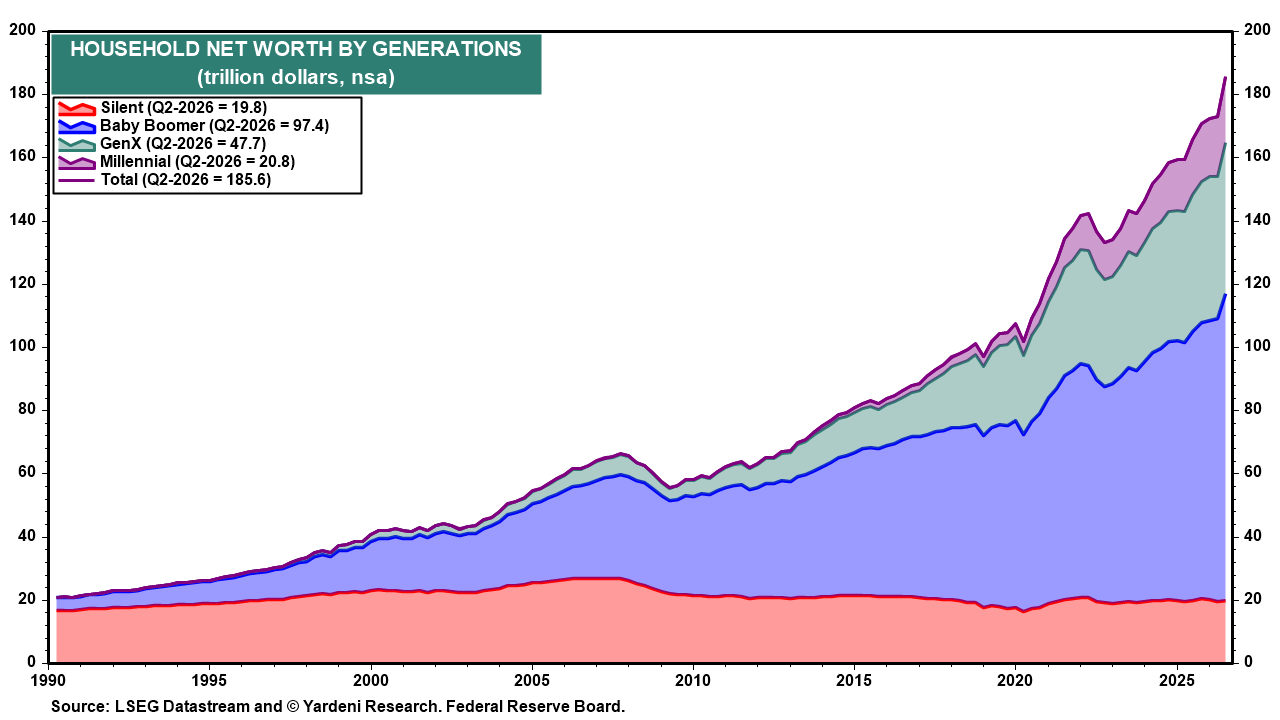
(2) They have most of the wealth. Baby Boomers own an extraordinary share of total household net worth. As of Q2-2026, they held $97.4 trillion of net worth, or a bit more than half of the total (chart). The Silent Generation held another $19.8 trillion, much of which will eventually pass to Boomer households. Together, the total is $117.2 trillion, making the senior cohort the wealthiest in world history!
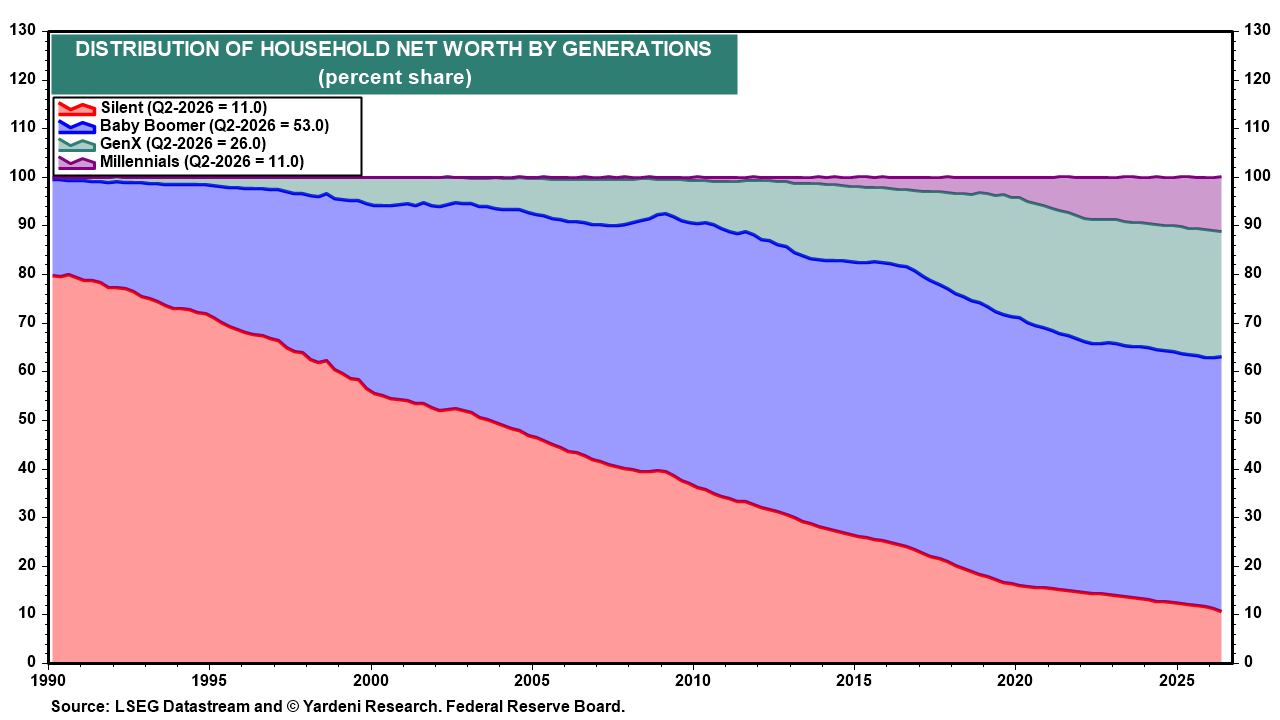
To be exact, Baby Boomers currently account for 53.0% of total US household net worth (chart). Together with the Silent Generation, they account for 64.0% of household net worth.
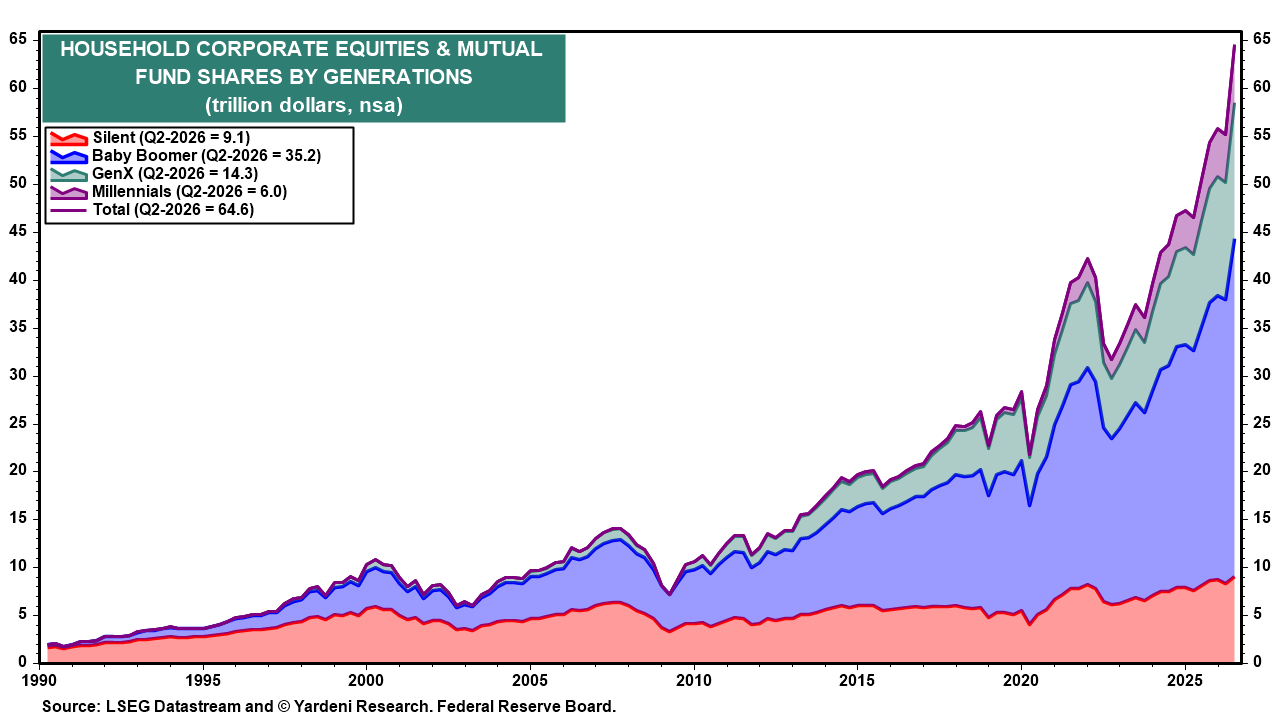
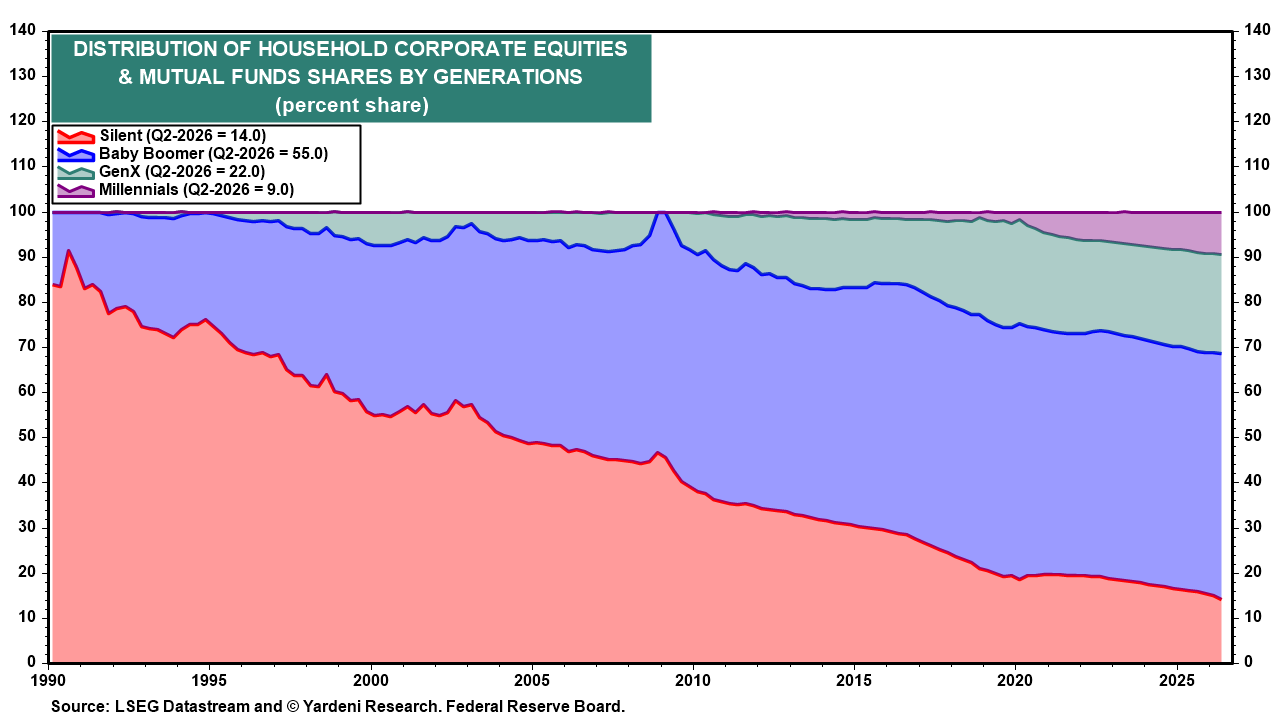
(3) They hold lots of assets. Baby Boomers also own a disproportionate share of the assets that have appreciated in value, such as stocks and real estate. They hold $35.2 trillion, or 55.0%, of household corporate equities and mutual fund shares (charts).
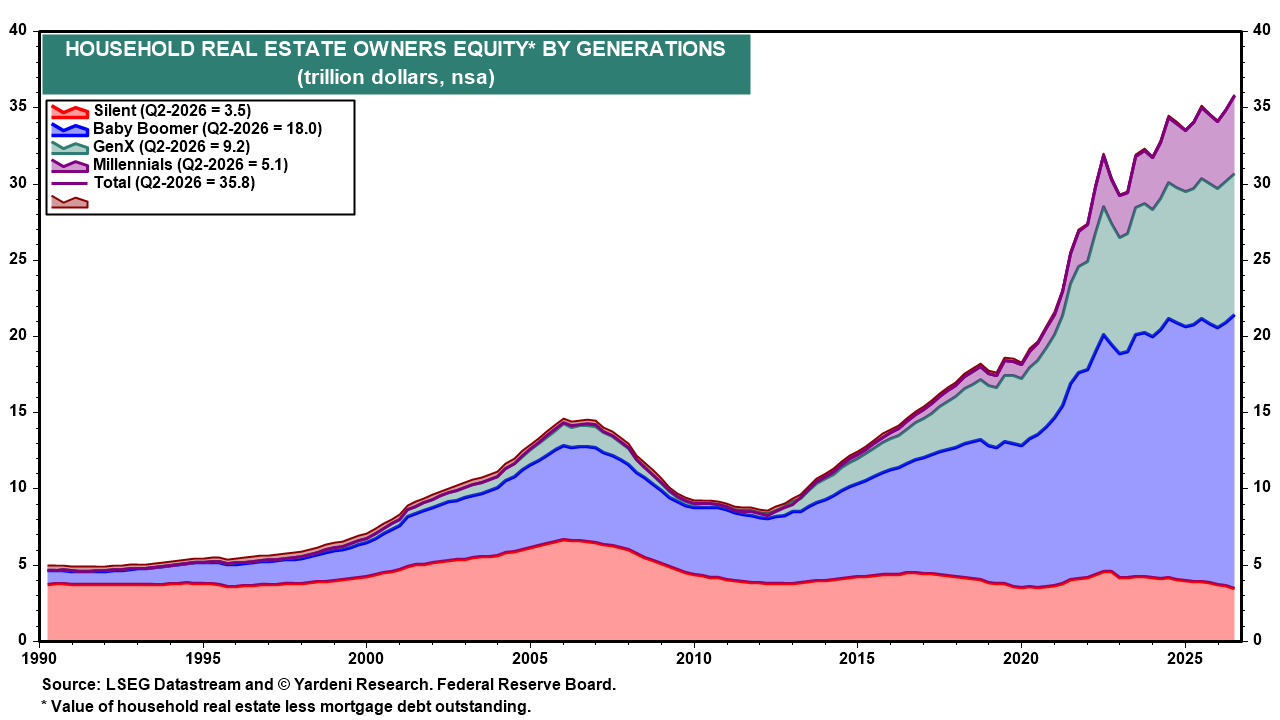
Baby Boomers also own $20.6 trillion, or 41.0%, of all household real estate wealth, the largest share of any generation (charts).
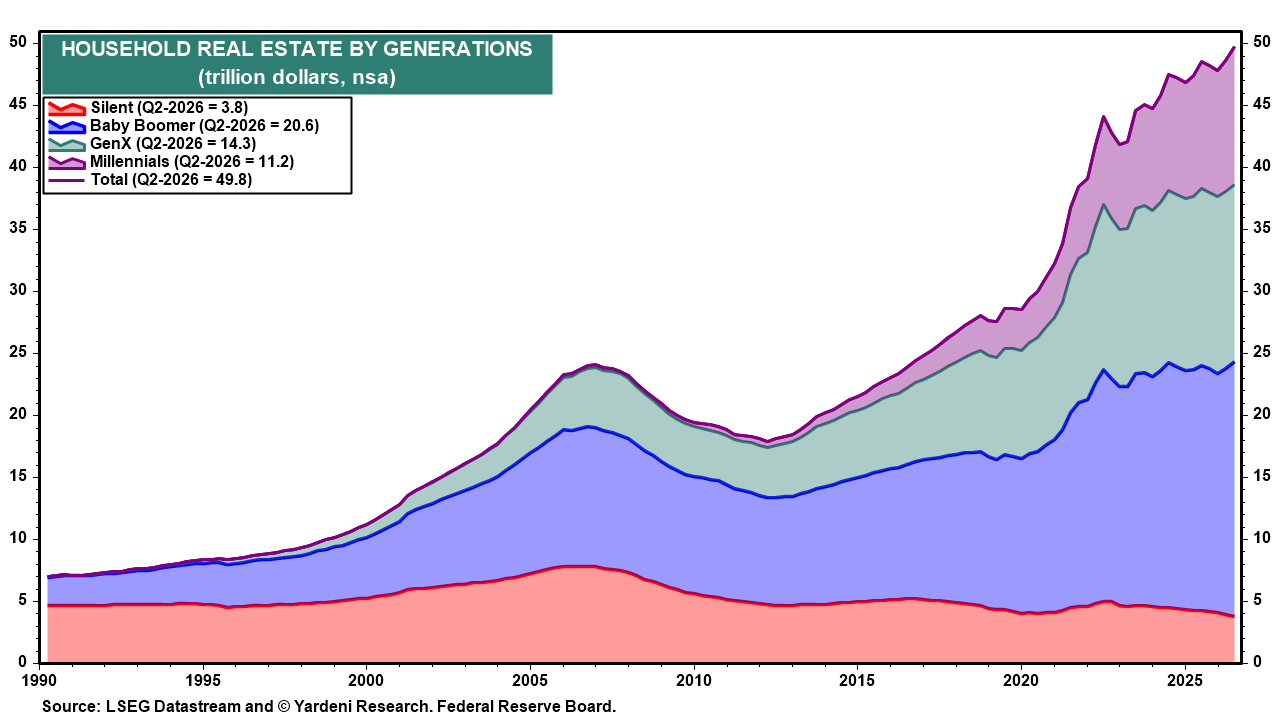
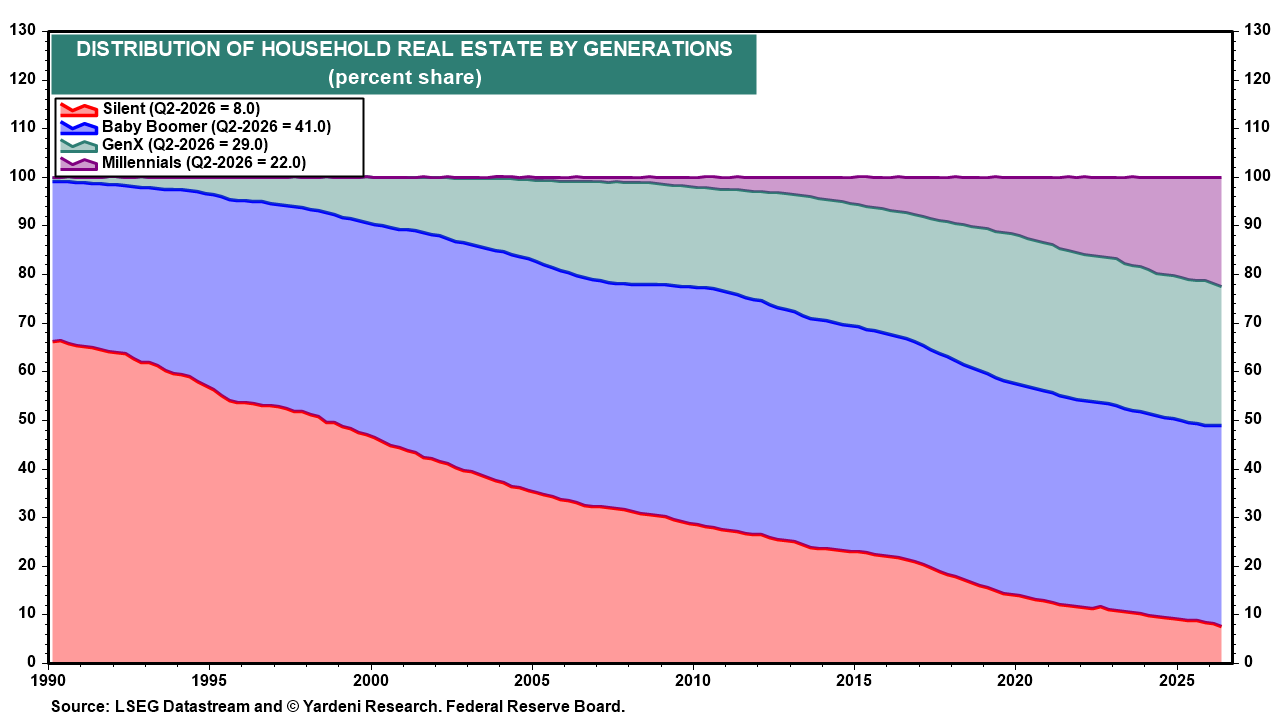
In other words, Baby Boomers are heavily exposed to the assets that have generated some of the most positive wealth effects on consumption in recent years.
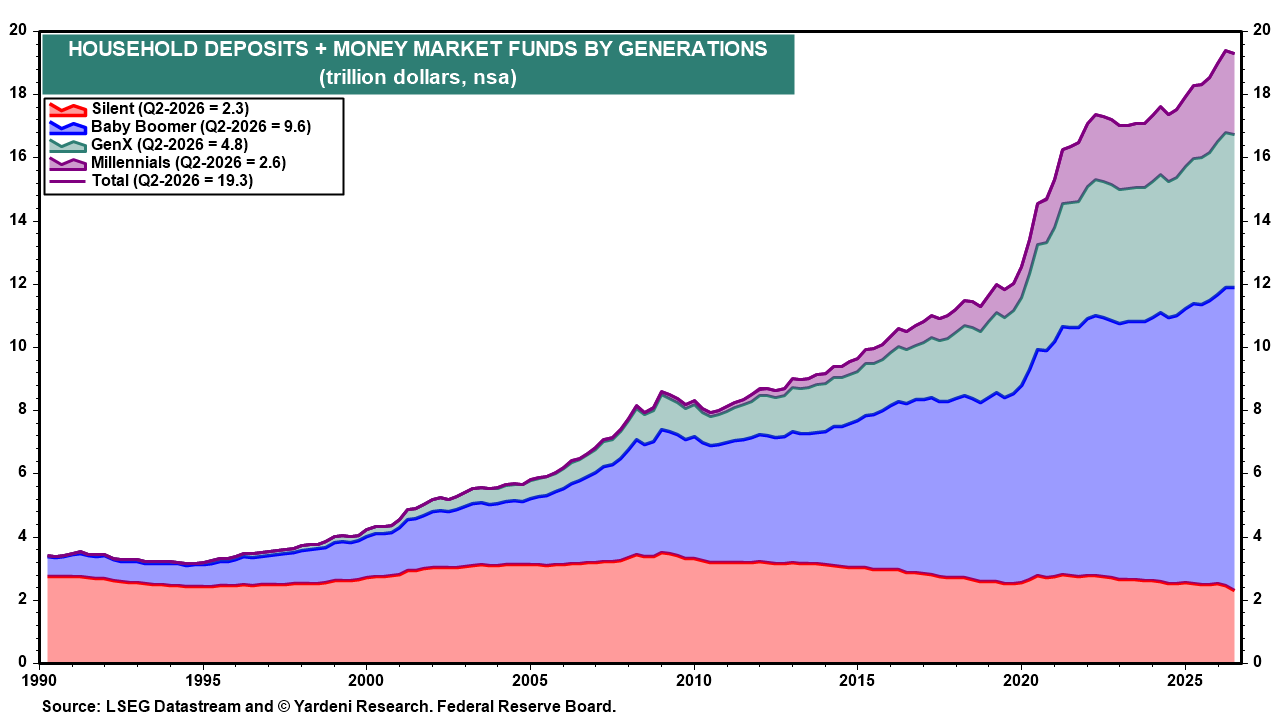
(4) They are less sensitive to higher interest rates. Higher interest rates are bad news for young households. For most Baby Boomers, however, they are a boon. Baby Boomers currently hold roughly $9.6 trillion in deposits and money market funds (chart). The Silent Generation holds another $2.3 trillion. Higher short-term interest rates have boosted interest income for many older households.
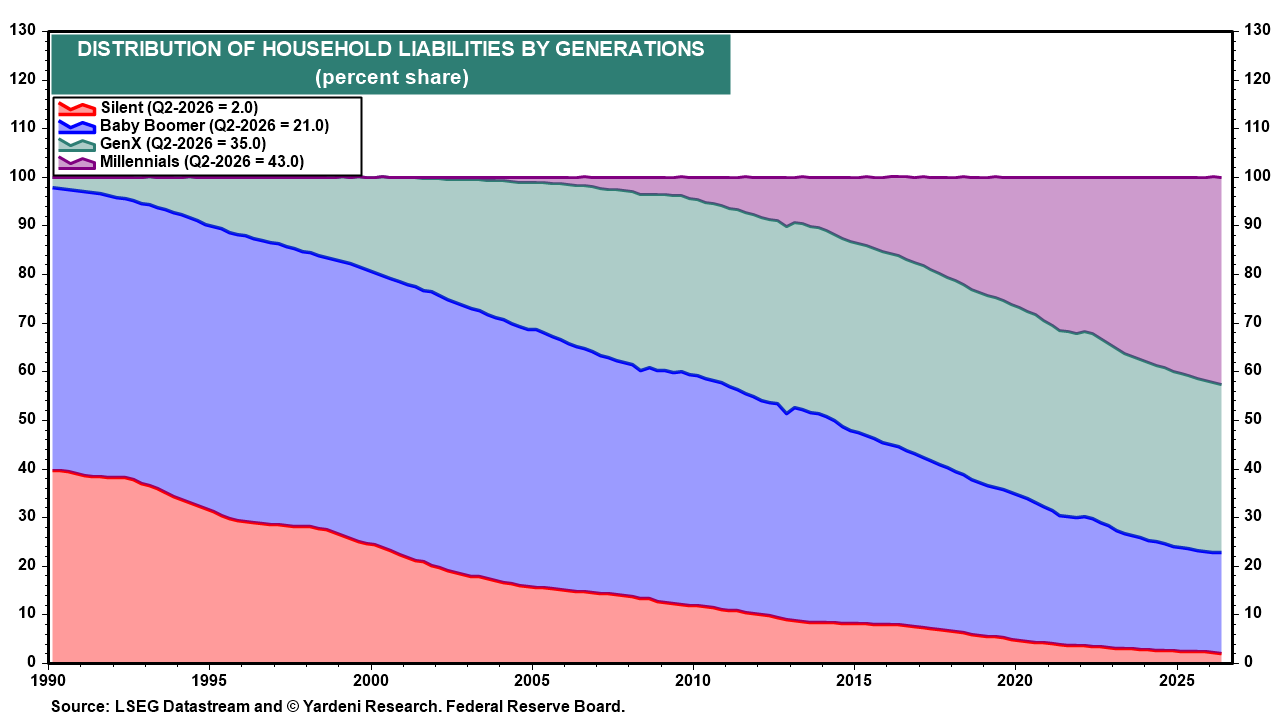
(5) They've paid down much of their debt. They've reduced their debt burdens. Baby Boomers account for only 21.0% of total household liabilities, down from 58.0% in 1990 (chart).
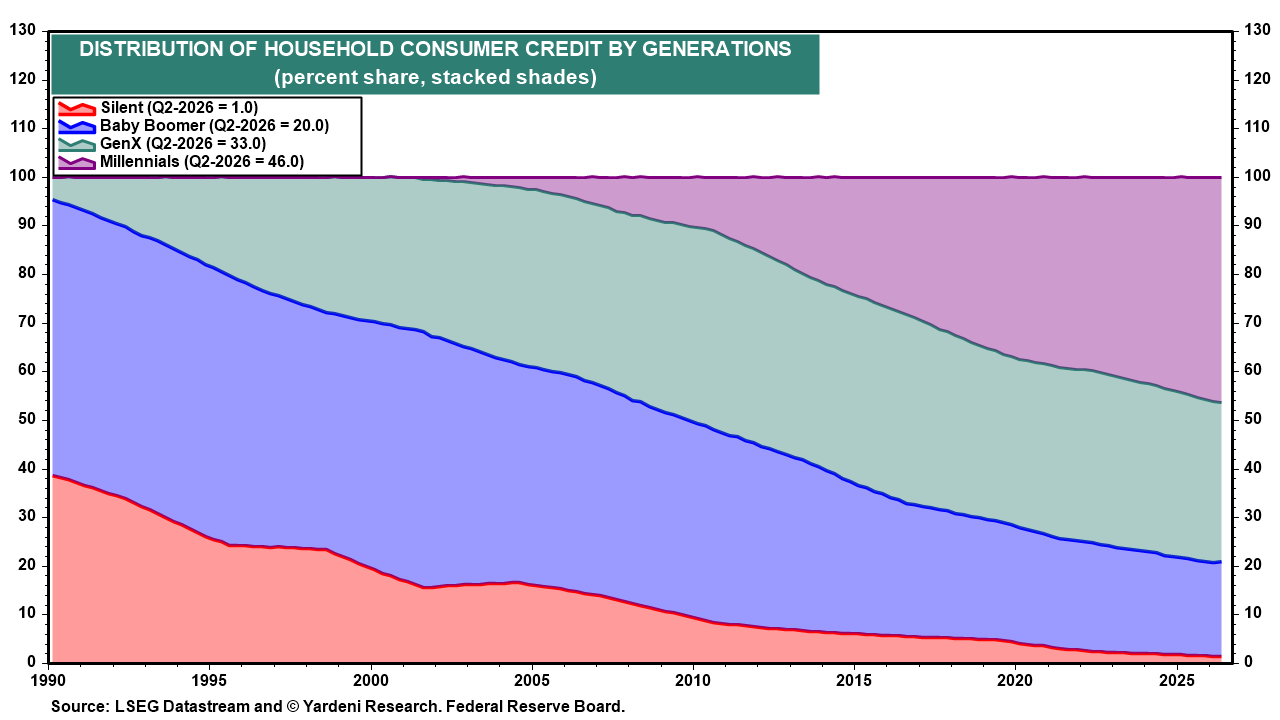
Disaggregating these liabilities reveals that the Baby Boomers account for 20.0% of consumer credit and 18.0% of household mortgage loans (charts). Both of these percentages have declined sharply in recent years.
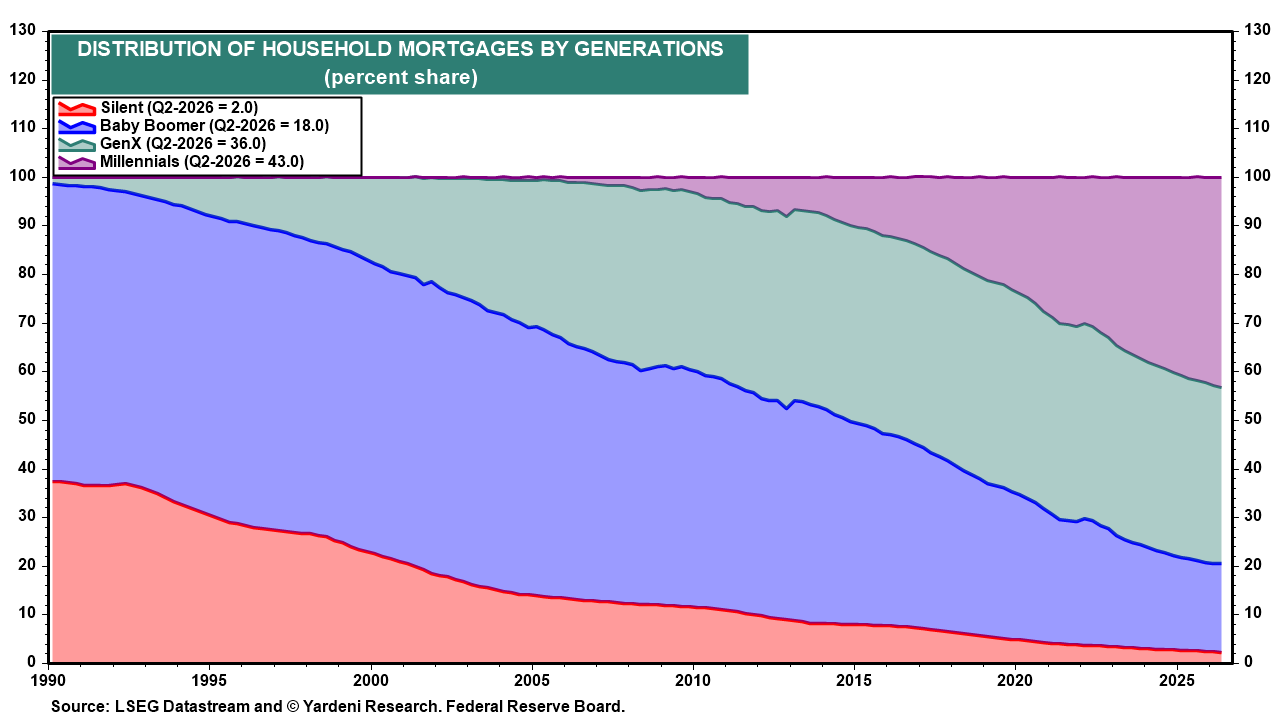
Many Baby Boomers either paid off their mortgages or locked in historically low mortgage rates during the pandemic. As a result, many have little incentive to sell their homes or downsize in retirement. By staying put, they limit the supply of existing homes for sale, boosting house prices and increasing their homeowners' equity (chart)!
The important point is that higher interest rates are not experienced the same way across generations. For younger households, higher rates are mostly a borrowing cost. For many older households, higher rates can also be a source of income, while locked-in low-rate mortgages and limited debt exposure reduce the drag from tighter credit conditions.
(6) They are less dependent on the labor market. Unlike younger households, many Baby Boomers are already retired or approaching retirement, so their spending decisions are less directly tied to monthly changes in wage growth, hiring conditions, or job security. Some may be indirectly affected if their adult children struggle to find jobs or earn enough income to support themselves. However, Baby Boomers' overall financial position is increasingly tied to their balance sheets rather than their paychecks.
Taken together, these factors put Baby Boomers in a unique position to keep spending. They hold much of the wealth, benefit from higher interest rates, and depend less on the labor market than younger generations. In other words, they will remain an important driver of consumer spending for years to come.