I. Bonds
On Wednesday, the Treasury Department announced that it was doubling the size of its effort to buy back Treasury securities with maturities between 10 and 30 years, to $4 billion per operation. Long-dated Treasury borrowing costs had been rising sharply amid competition for capital from AI data-center builders, and on worries about government deficits. US sovereign debt hit a record $40 trillion on Wednesday.
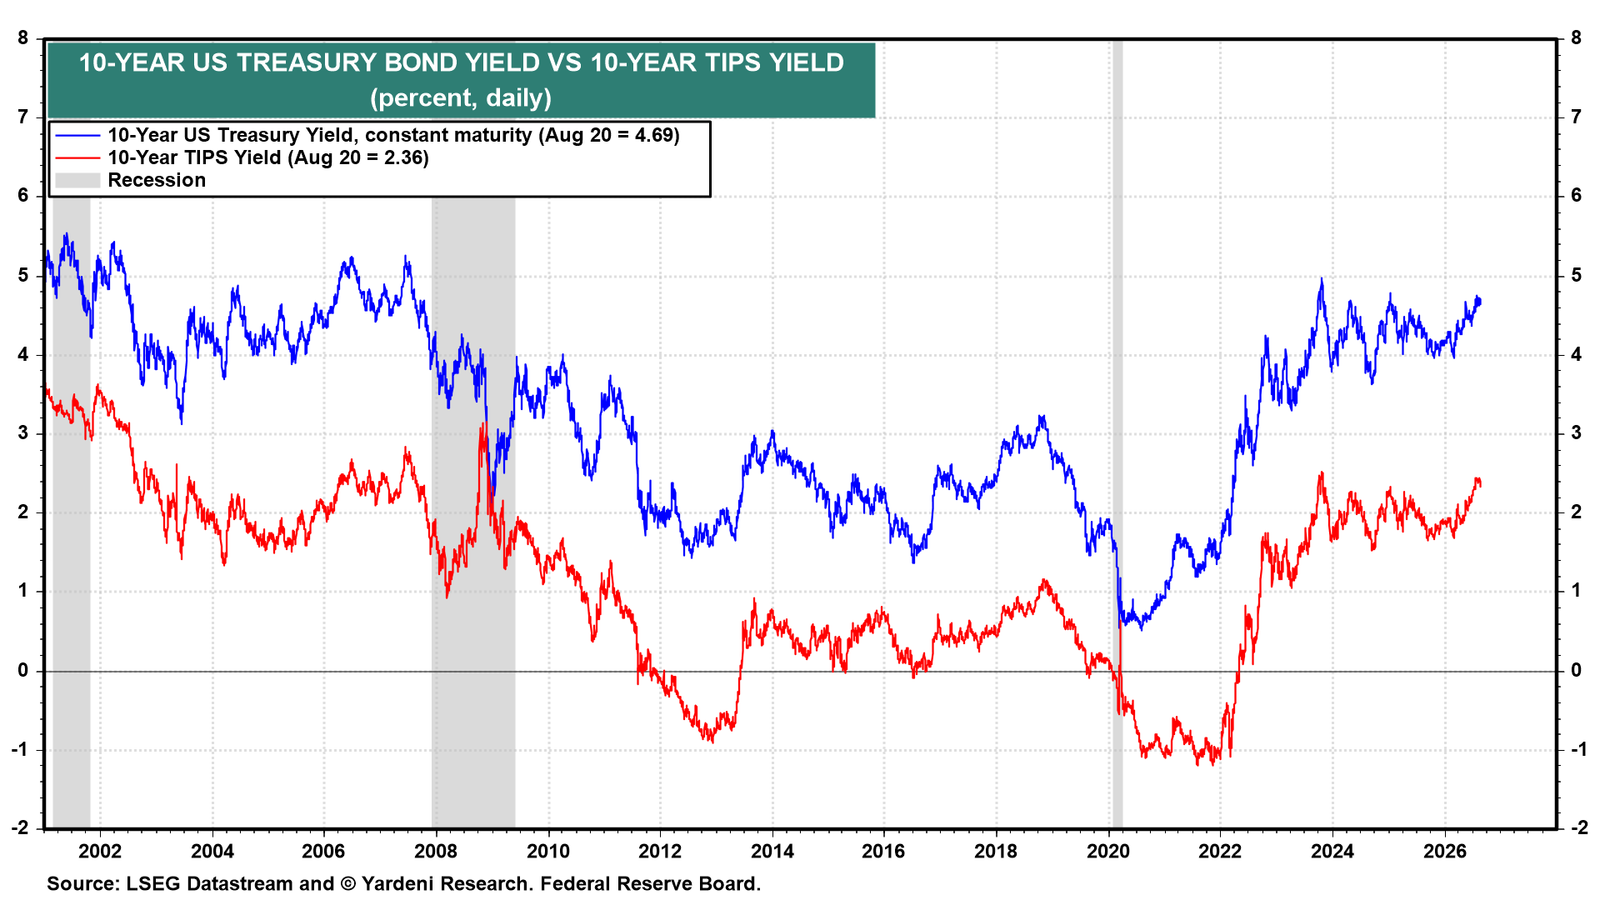
Bond yields fell slightly on yesterday's news. Today, they edged back up (chart). So, has Treasury Secretary Scott Bessent's attempt to stabilize the bond market already failed? Does this mean that a government debt crisis is imminent? That seems to be the reaction of a few commentators, especially those who have been predicting such a crisis for many years.
As we noted yesterday, Treasury buybacks are structured to repurchase older, less liquid ("off-the-run") government bonds from primary dealers, freeing up dealer balance sheets and improving secondary market functioning. Bessent isn't trying to lower bond yields. Rather, he is trying to stabilize them so Treasury auctions go smoothly, particularly yesterday's 20-year auction.
So we are sticking with our base-case scenario for the bond market. We expect that the 10-year Treasury yield will remain in a 4.00%-5.00% range through the end of this year and next year.
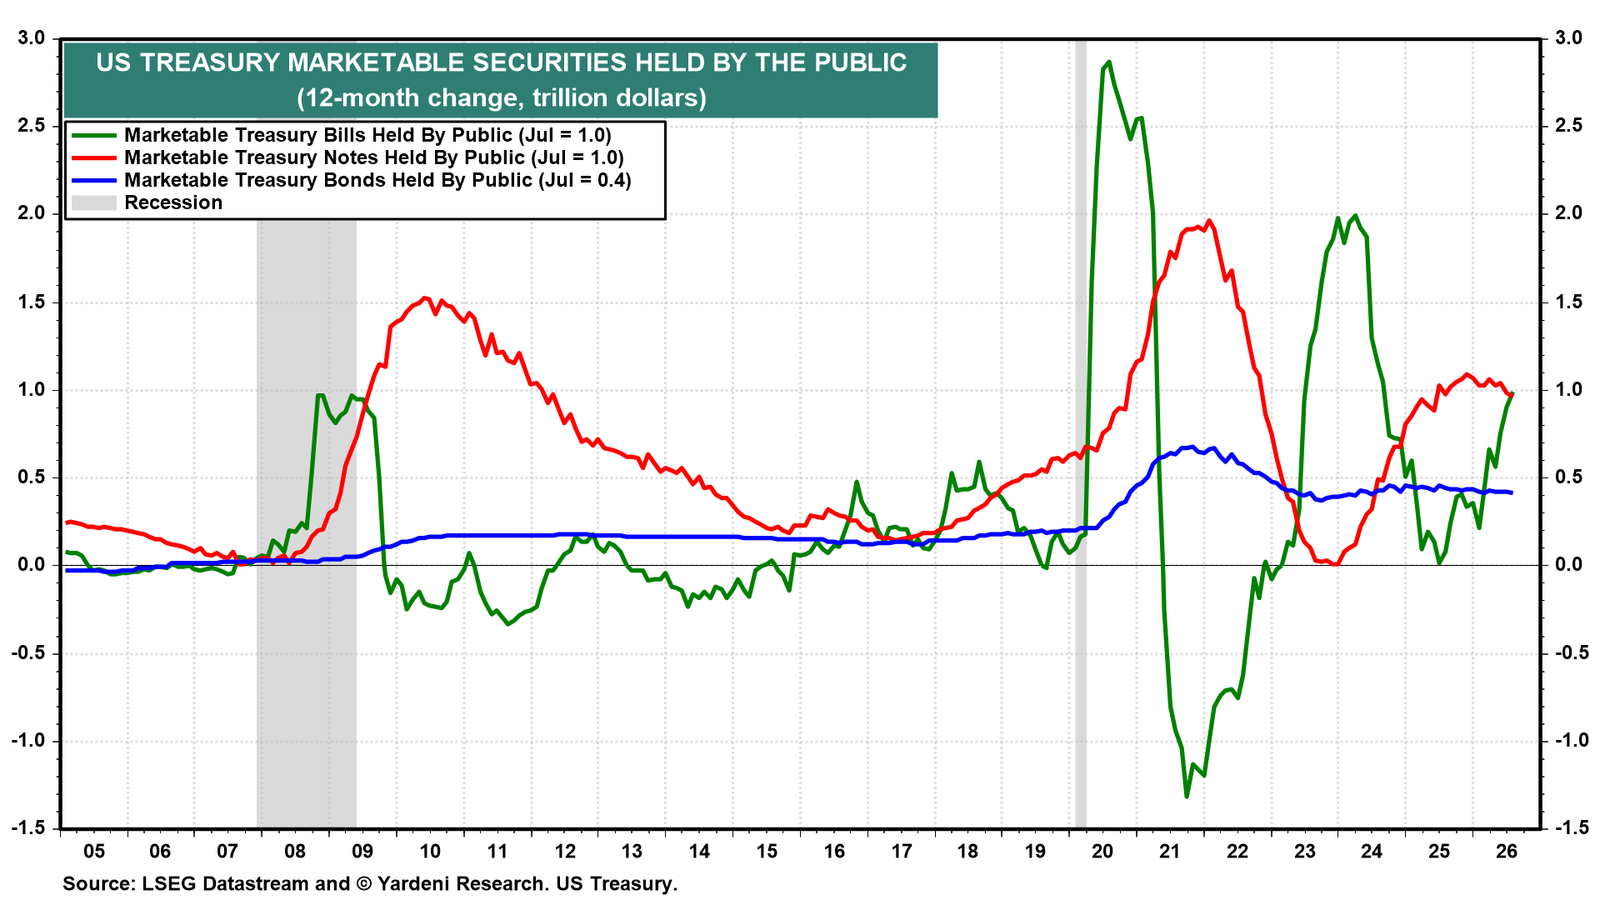
Our relatively constructive view reflects that Bessent's Treasury is following former Treasury Secretary Janet Yellen's 2023 playbook by financing more of the deficit in the Treasury bill market (chart). In effect, the Treasury is forcing the Fed to buy Treasury bills to keep the federal funds rate from rising.
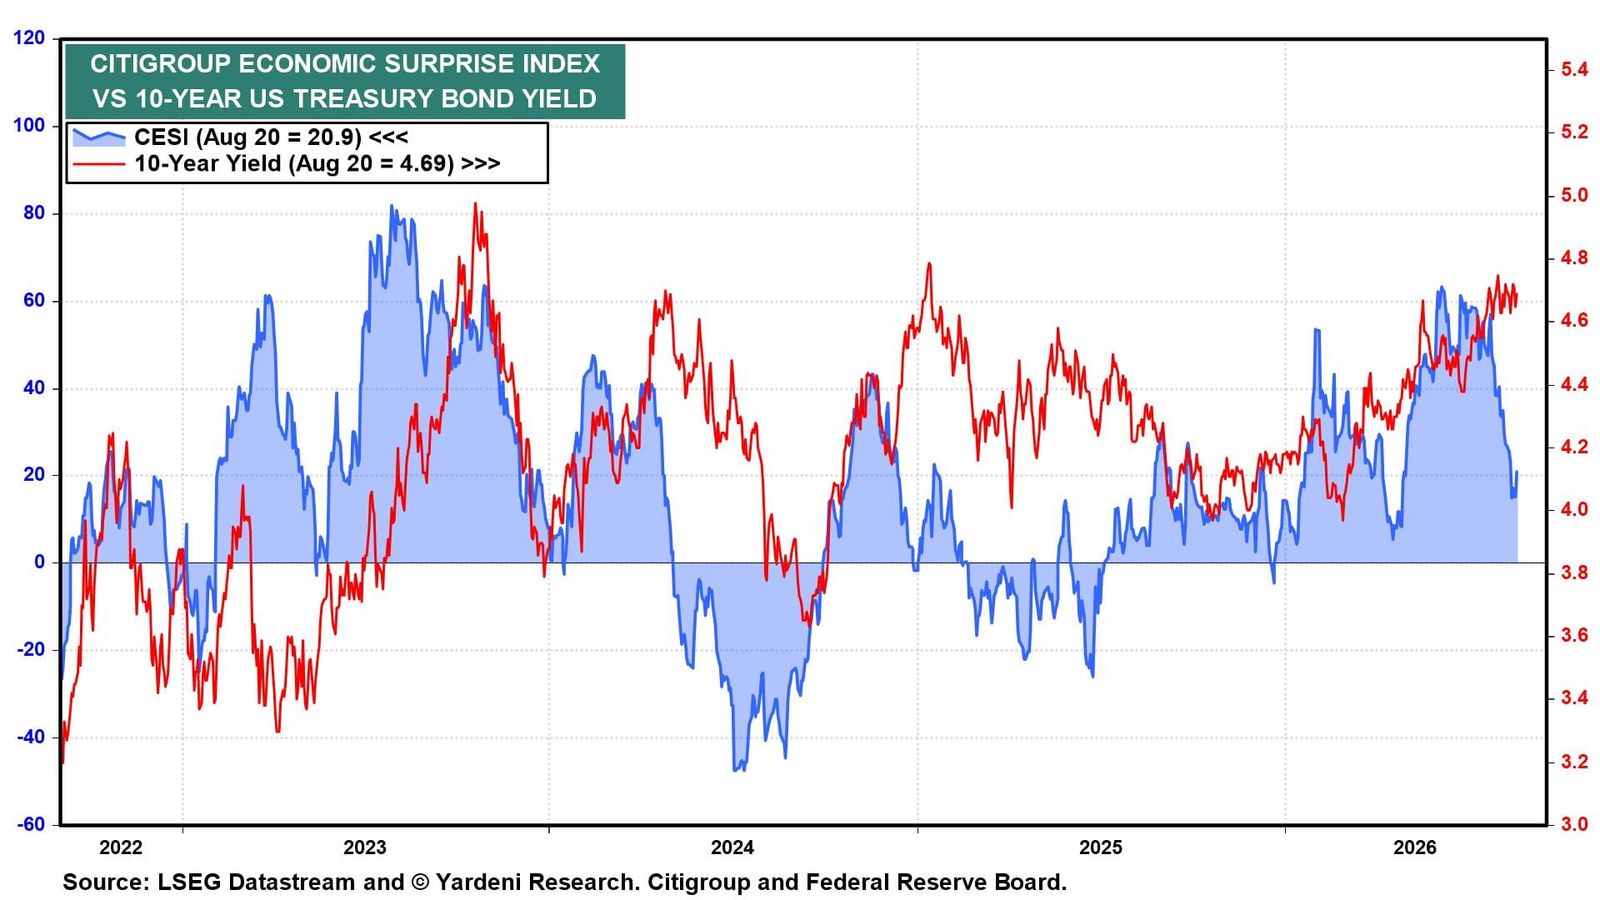
In the short term, the recent drop in the Citigroup Economic Surprise Index should also help stabilize the bond market (chart).
II. Stocks
Stock prices remain near their recent record highs despite jitters over the recent rise in bond yields (chart). We recently observed that according to the Fed's Stock Valuation Model, a 5.00% Treasury yield implies that the fair value of the forward P/E of the S&P 500 is 20.0, which is where it is now.
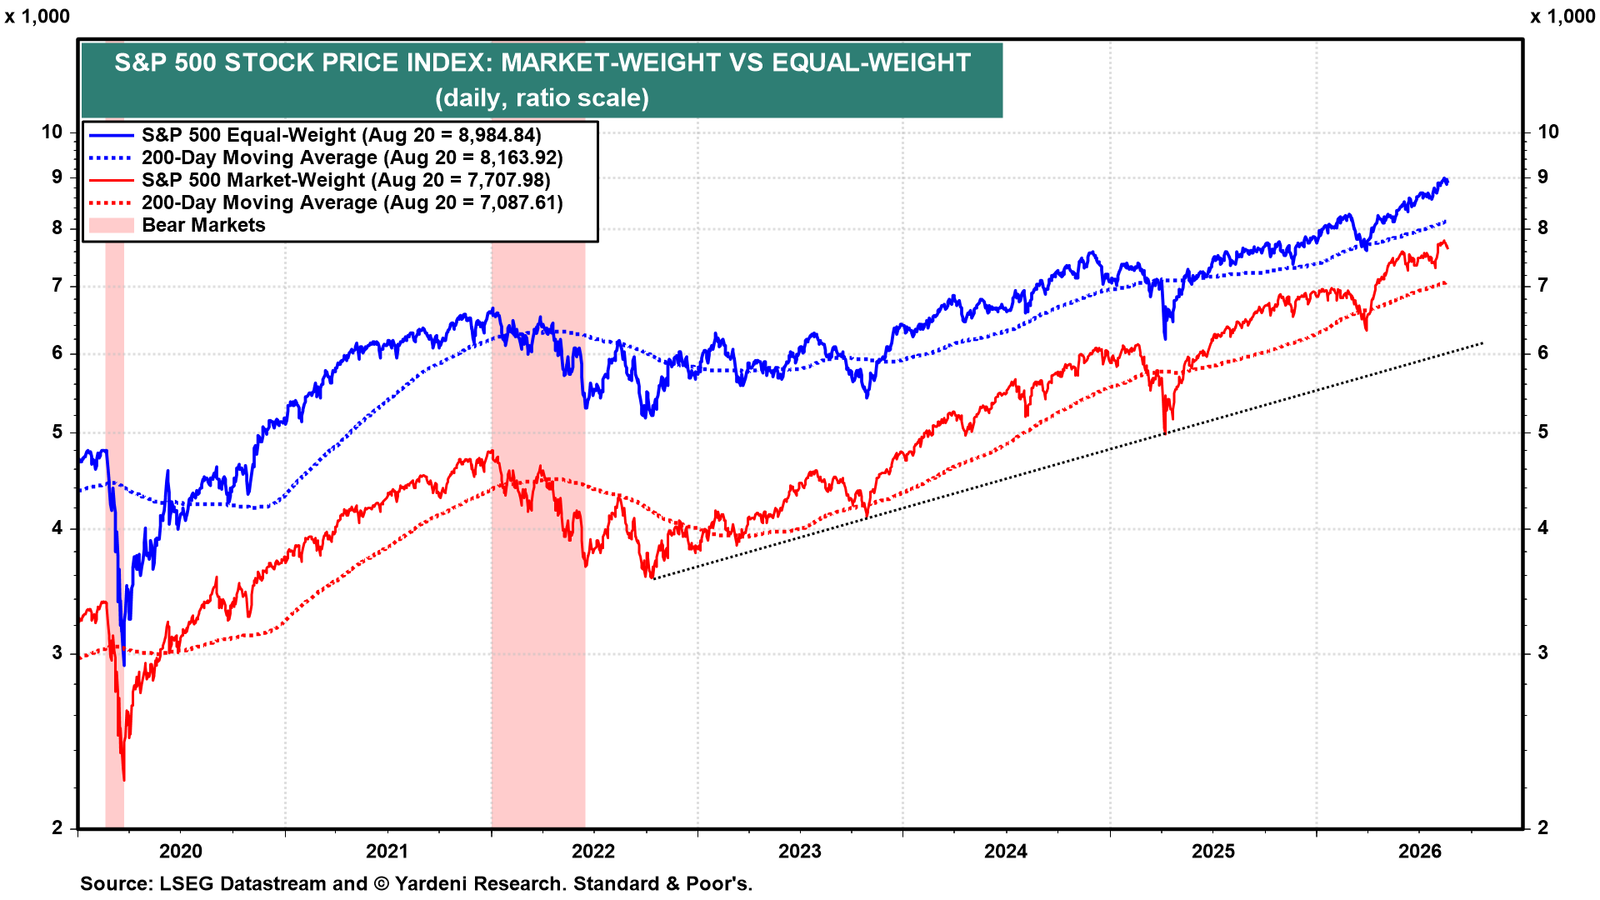
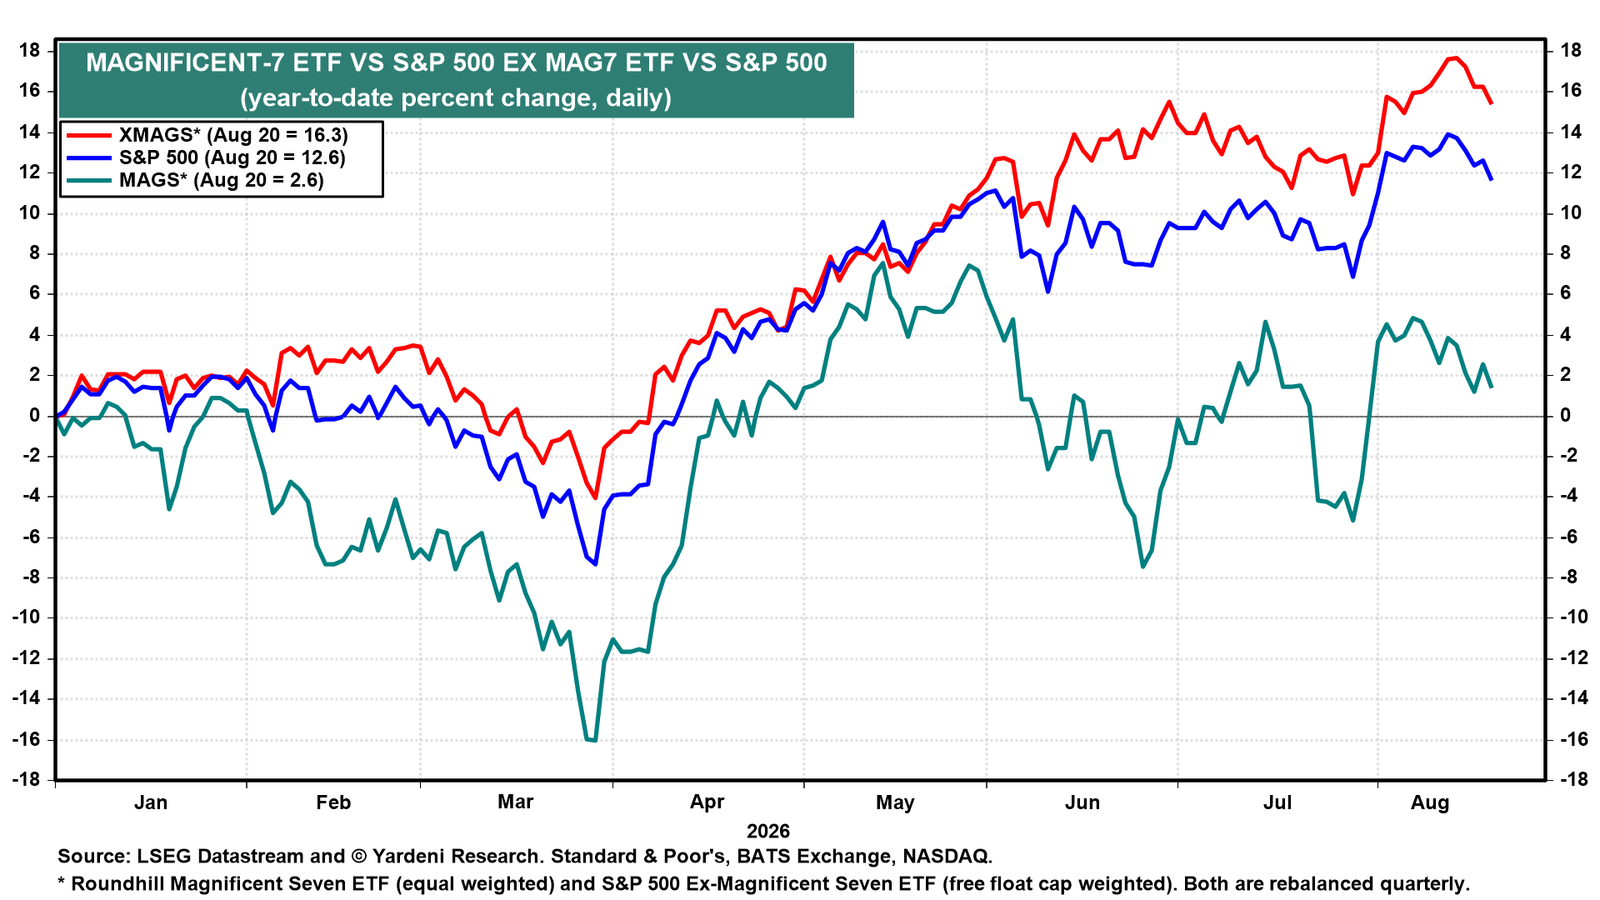
The recent pullback has been widespread. Nevertheless, we still expect that the Impressive 493 will continue to outperform the Magnificent-7 this year and probably next year too (chart).
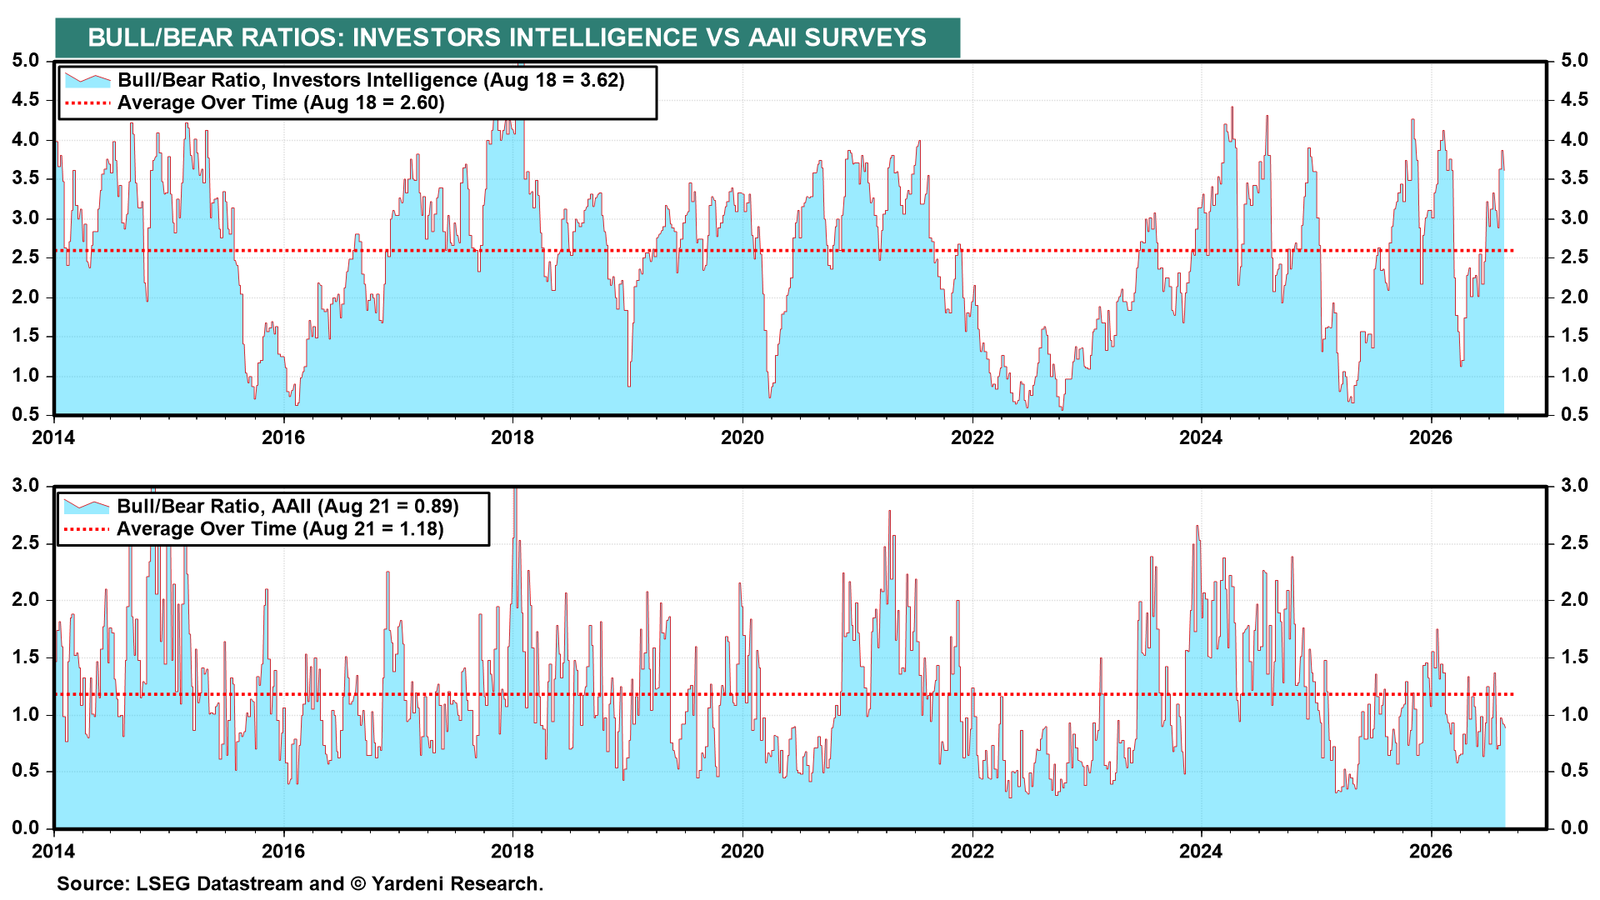
The two bull-bear ratios we monitor are mixed (chart). Collectively, they suggest that the current pullback should be modest.
III. Inflation
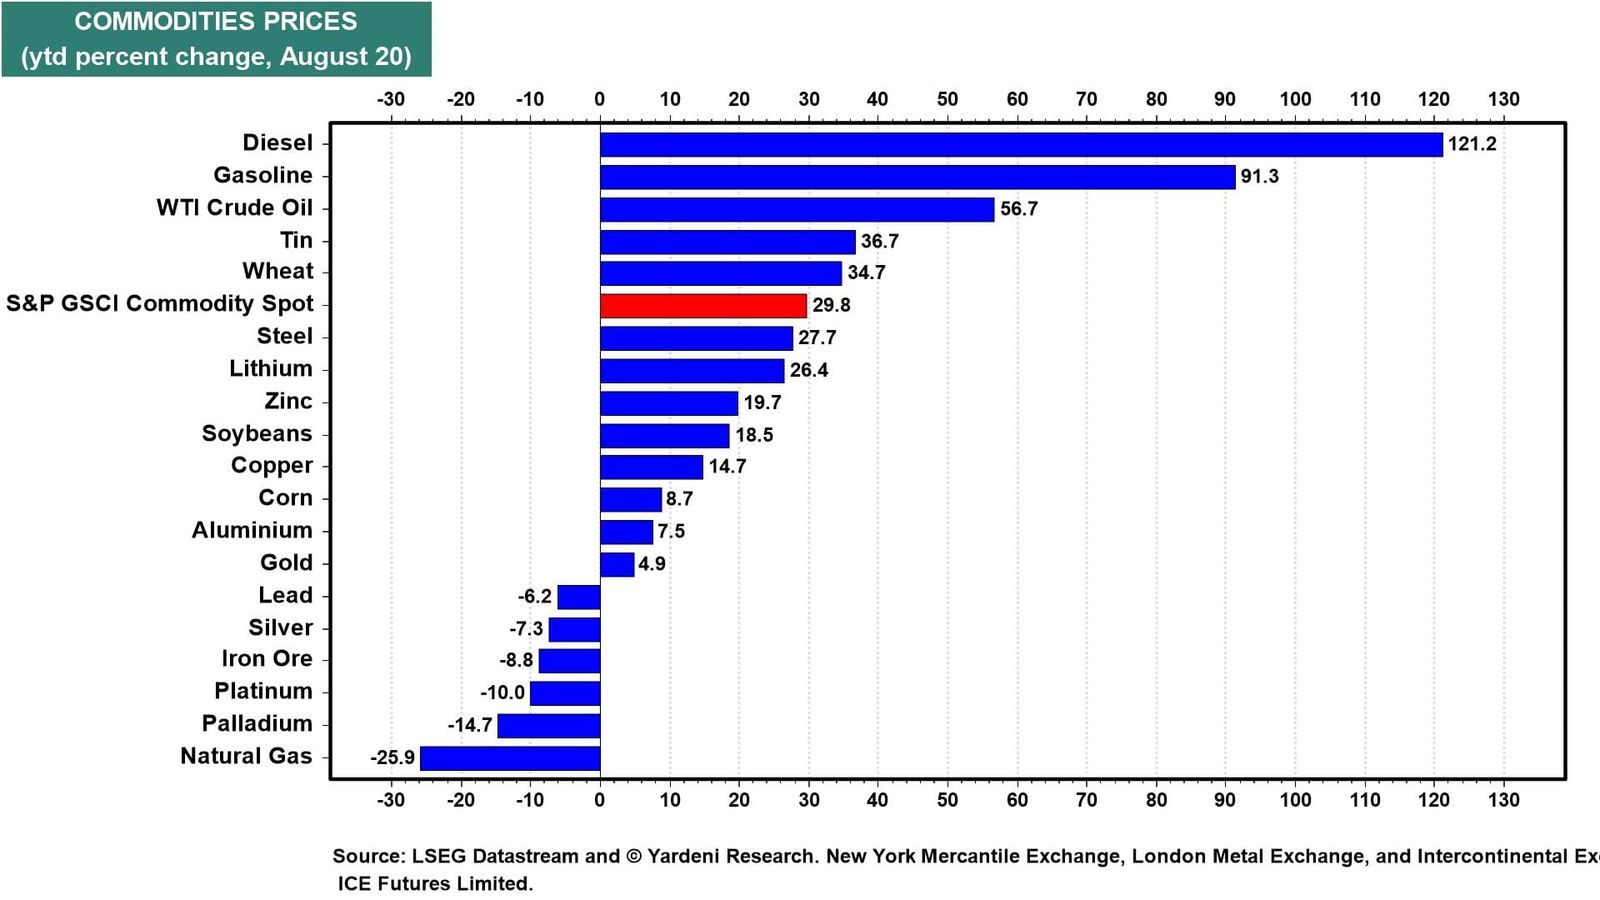
Commodity prices suggest that significant inflationary pressure remains in the pipeline. Diesel prices have soared more than crude oil prices this year (chart). Metal prices are also up sharply on AI-related demand. Wheat prices are rising amid concerns that Russia will block Ukraine's grain exports.
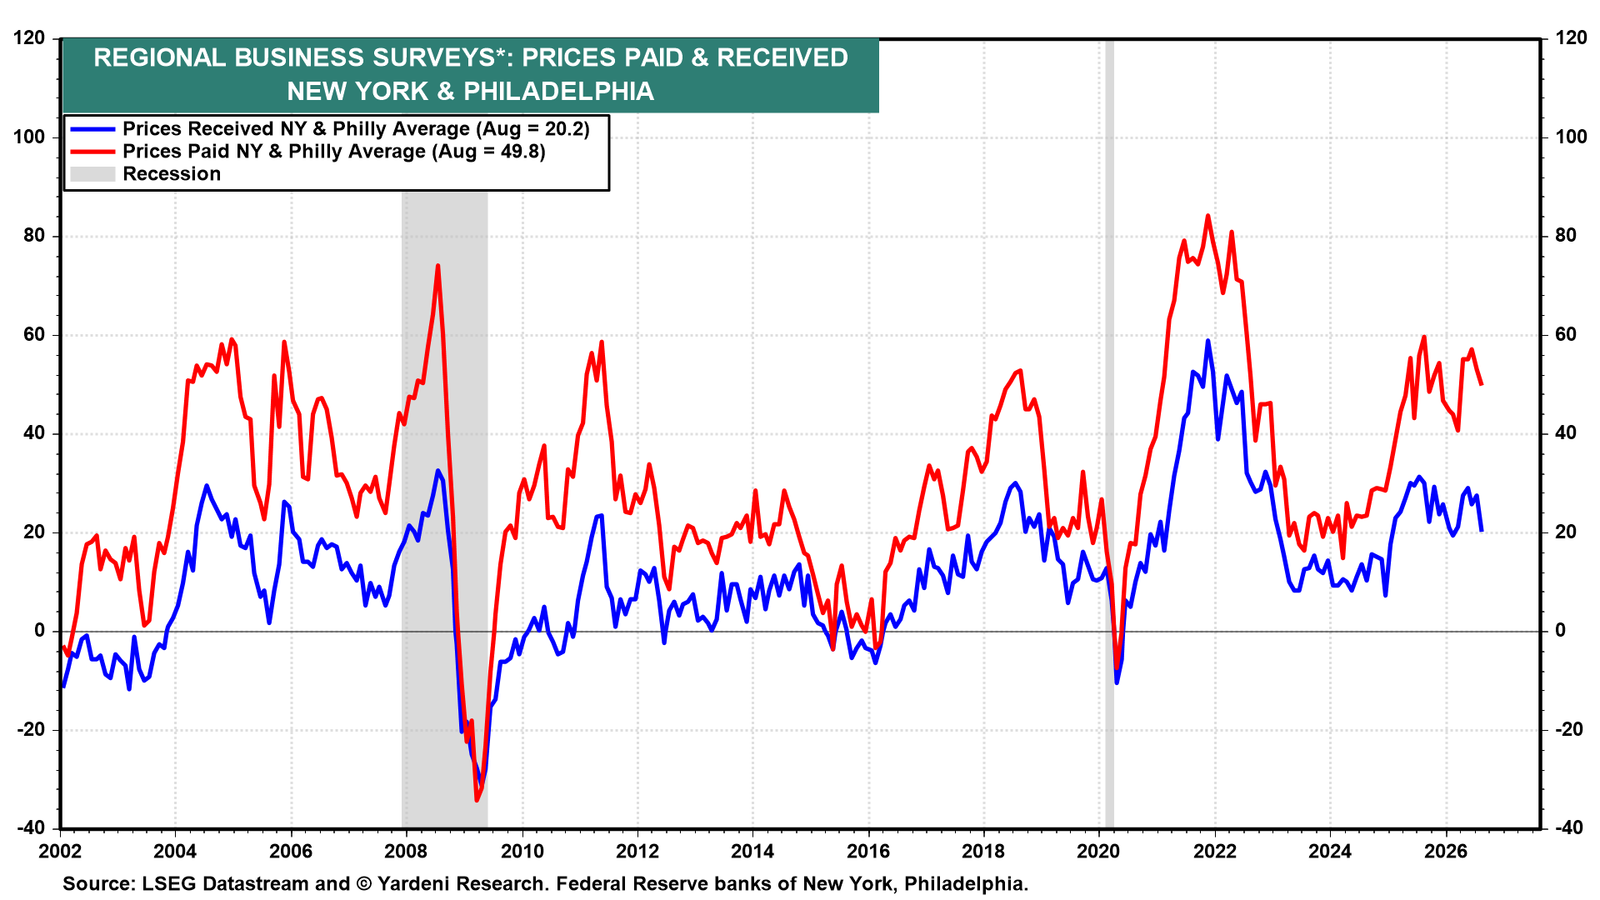
The regional prices-paid and prices-received indexes for the NY and Philly Fed districts edged down in August, but remain elevated (chart).
IV. Economic Indicators
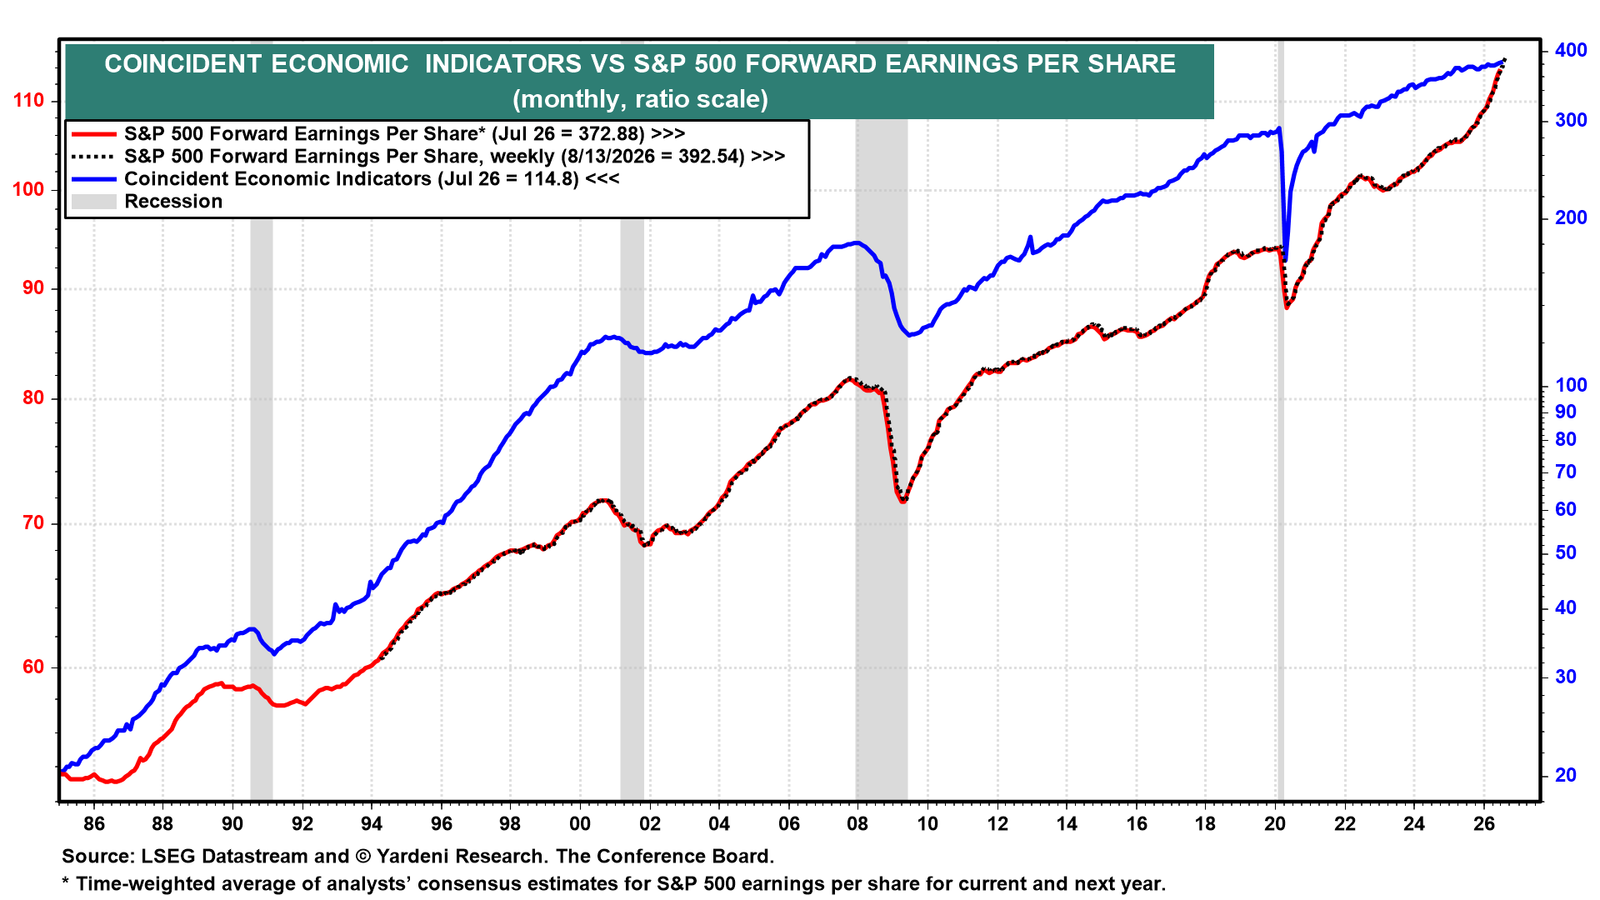
Meanwhile, the economy continues to perform well. The Index of Coincident Indicators (CEI) rose 0.2% m/m to a new record high in July (chart). S&P 500 forward earnings is highly correlated with the CEI. The former has been rising faster than the latter in recent months.
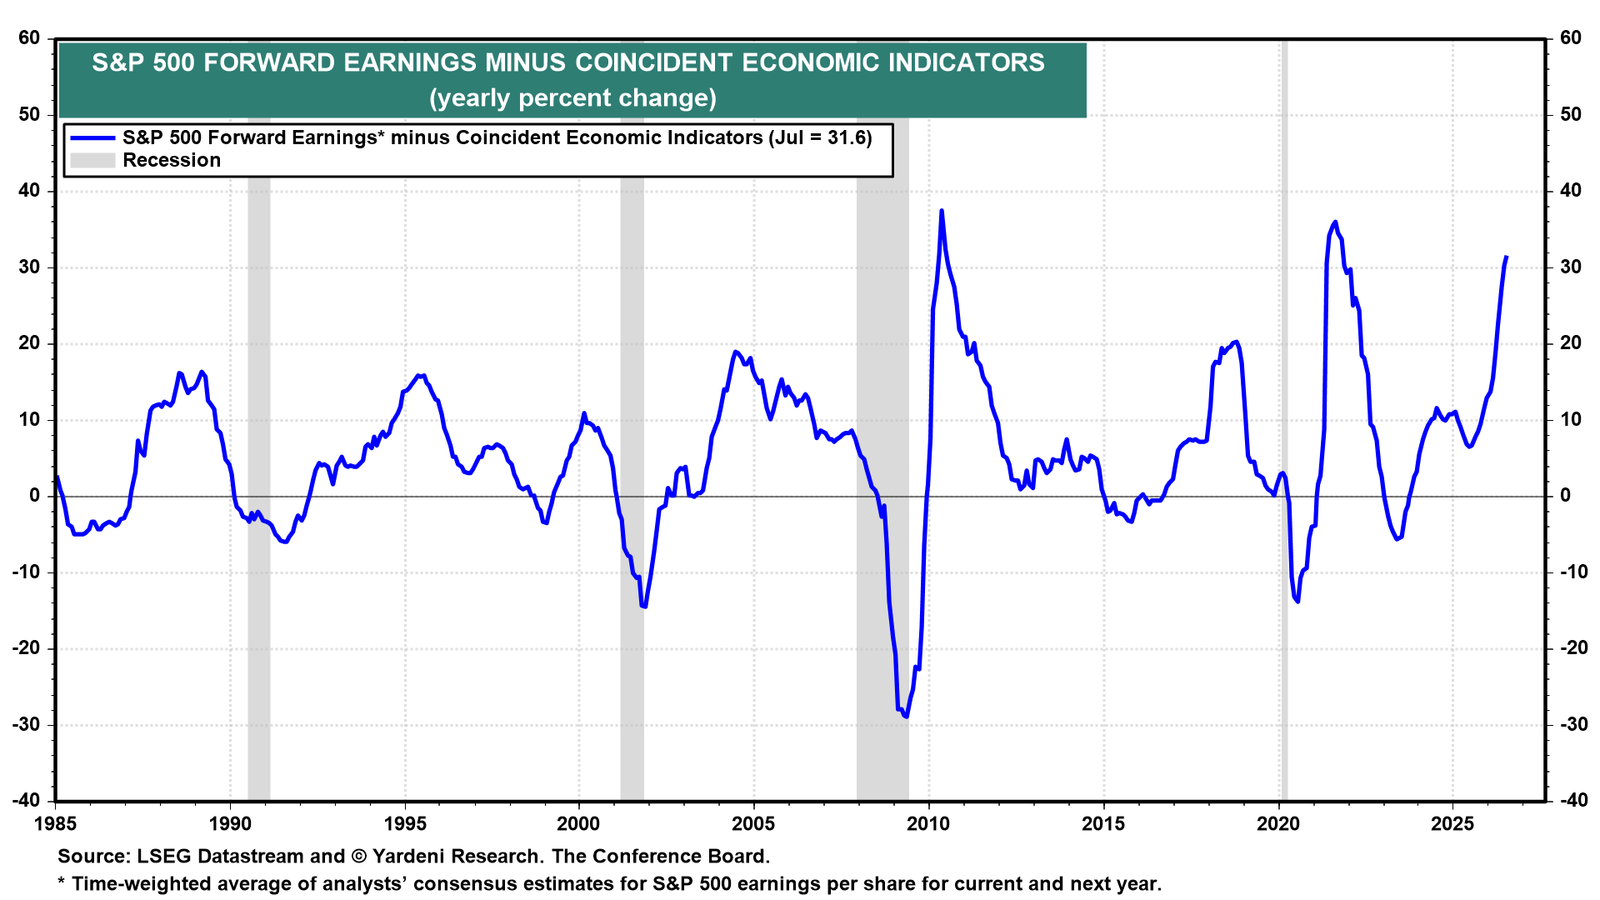
The spread between the growth rates of forward earnings and the CEI is highly cyclical and currently shows profits outpacing the CEI (chart). That is consistent with profit margins, which are rising rapidly to record highs.
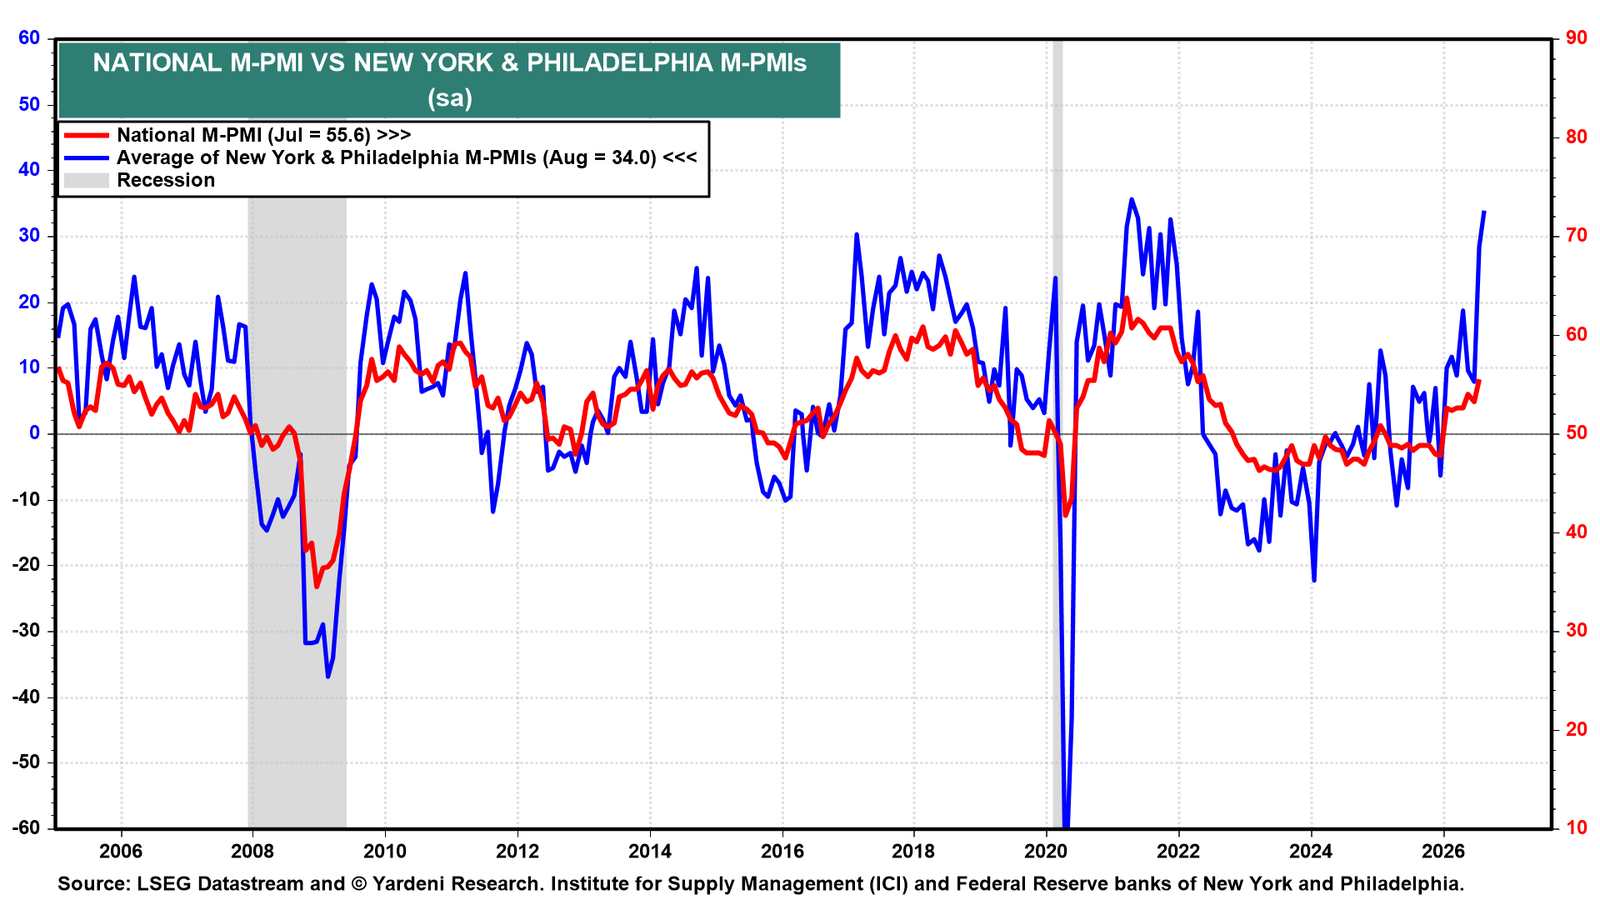
July's average business indexes for the NY and Philly Fed districts are soaring in August (chart).
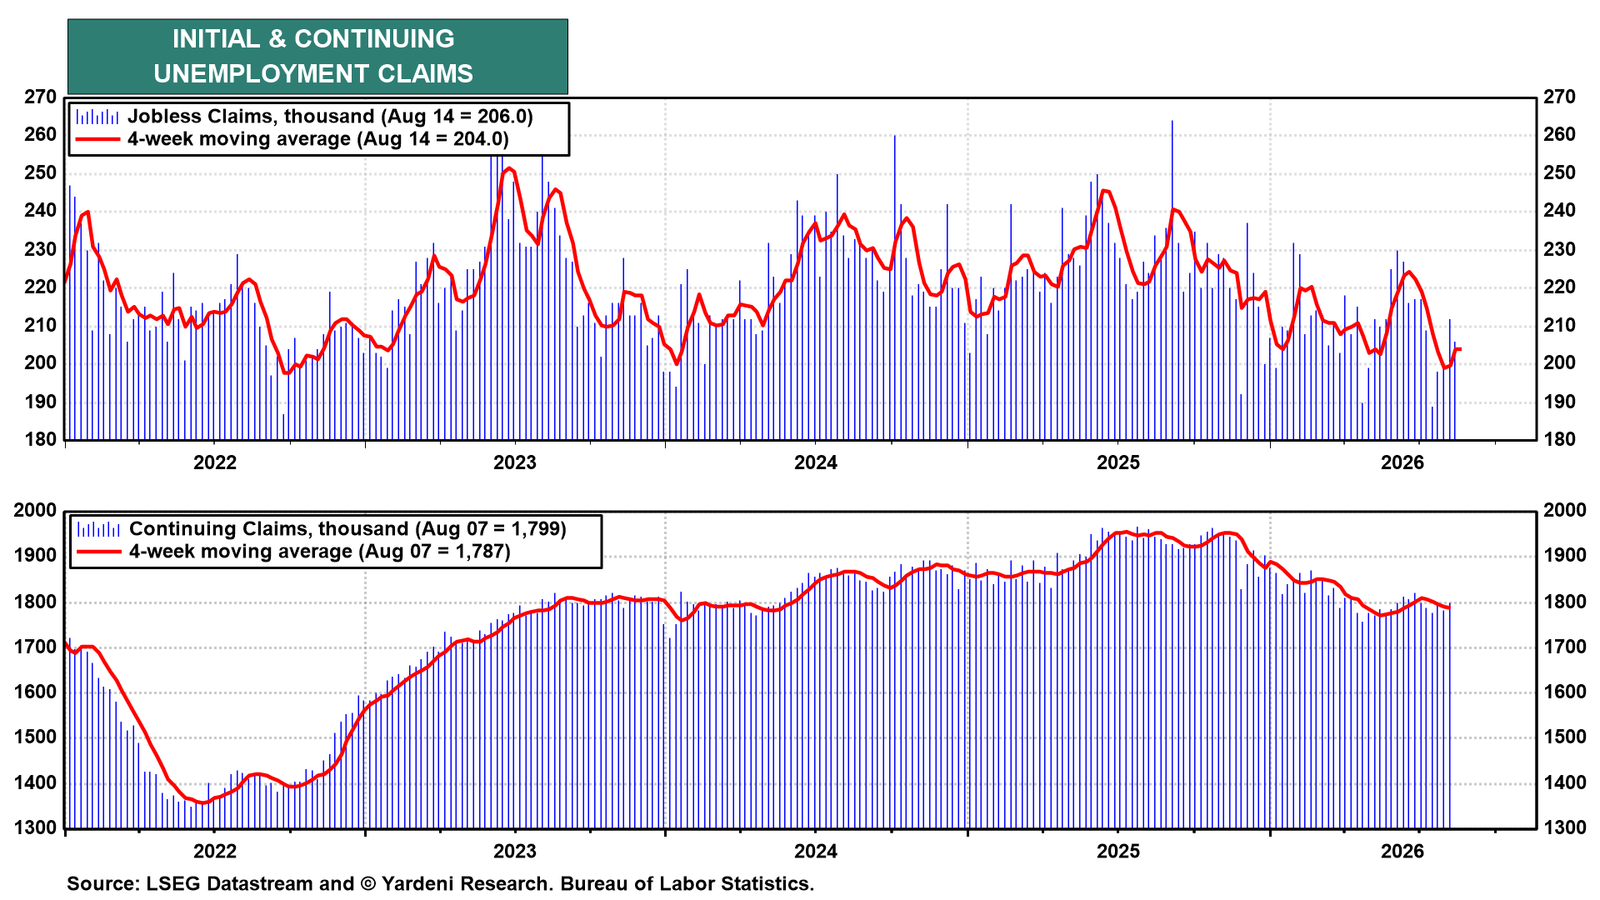
The initial and continuing unemployment insurance claims data series remain subdued (chart).