The 10-year US Treasury bond yield has climbed above 5.25%, and the S&P 500 hasn’t flinched. The stock index is just 2.2% below our year-end target of 7,900. It could overshoot our target in the coming days now that crude oil shipments from the Persian Gulf producers reportedly are averaging around 98% of pre-war totals, excluding Iran. Producers and shippers have found workarounds to their usual Strait of Hormuz routes, including alternative pipeline routes, ship-to-ship transfers, and naval-escorted night transits.
The question is: How long stocks can ignore bonds if yields keep rising despite lower oil prices? If yields are simply repricing to reflect stronger-than-expected economic growth, then earnings will remain strong. The downside risk is to the stock market's valuation multiple if bond yields are rising on concerns about mounting government debt, possibly exacerbated by the unwinding of the yen carry trade.
For now, we are sticking with our S&P 500 targets of 7,900 by year-end and 8,400 by mid-year 2027. Here's more:
I. Bonds
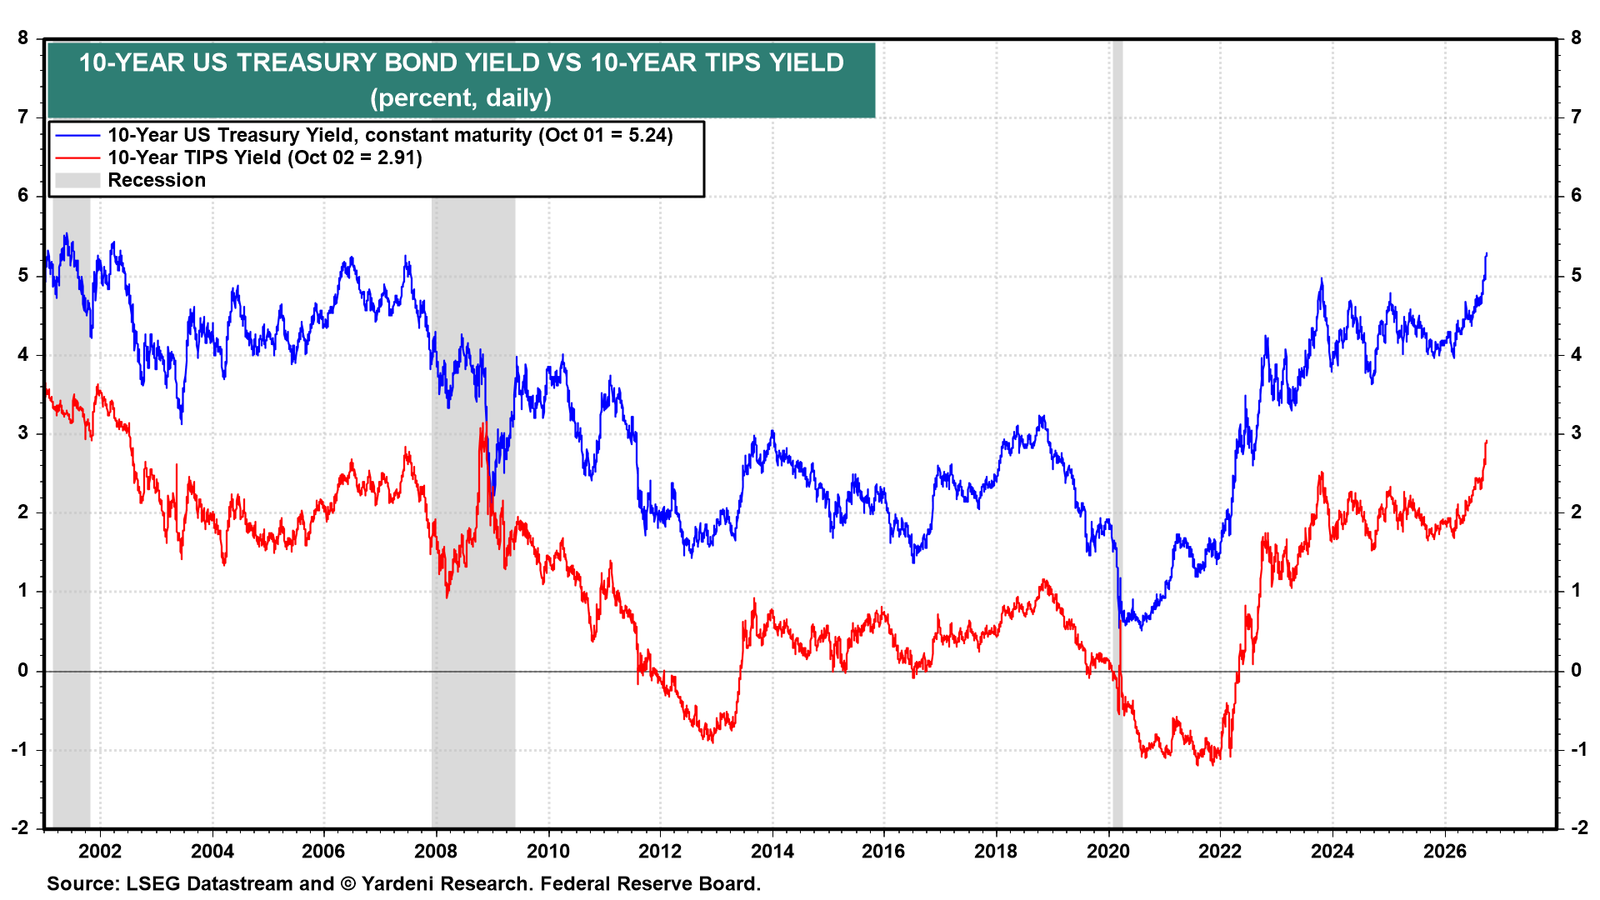
The 10-year Treasury yield rose to 5.24% on Friday, and the 10-year TIPS yield rose to 2.91% (chart). Since the start of the year, the nominal yield is up 109bps, and the TIPS yield is up 95bps. Real yields account for nearly all of the increase, while inflation expectations have barely budged. We read that as a vote of confidence in the economy and a sign of strong demand for credit.
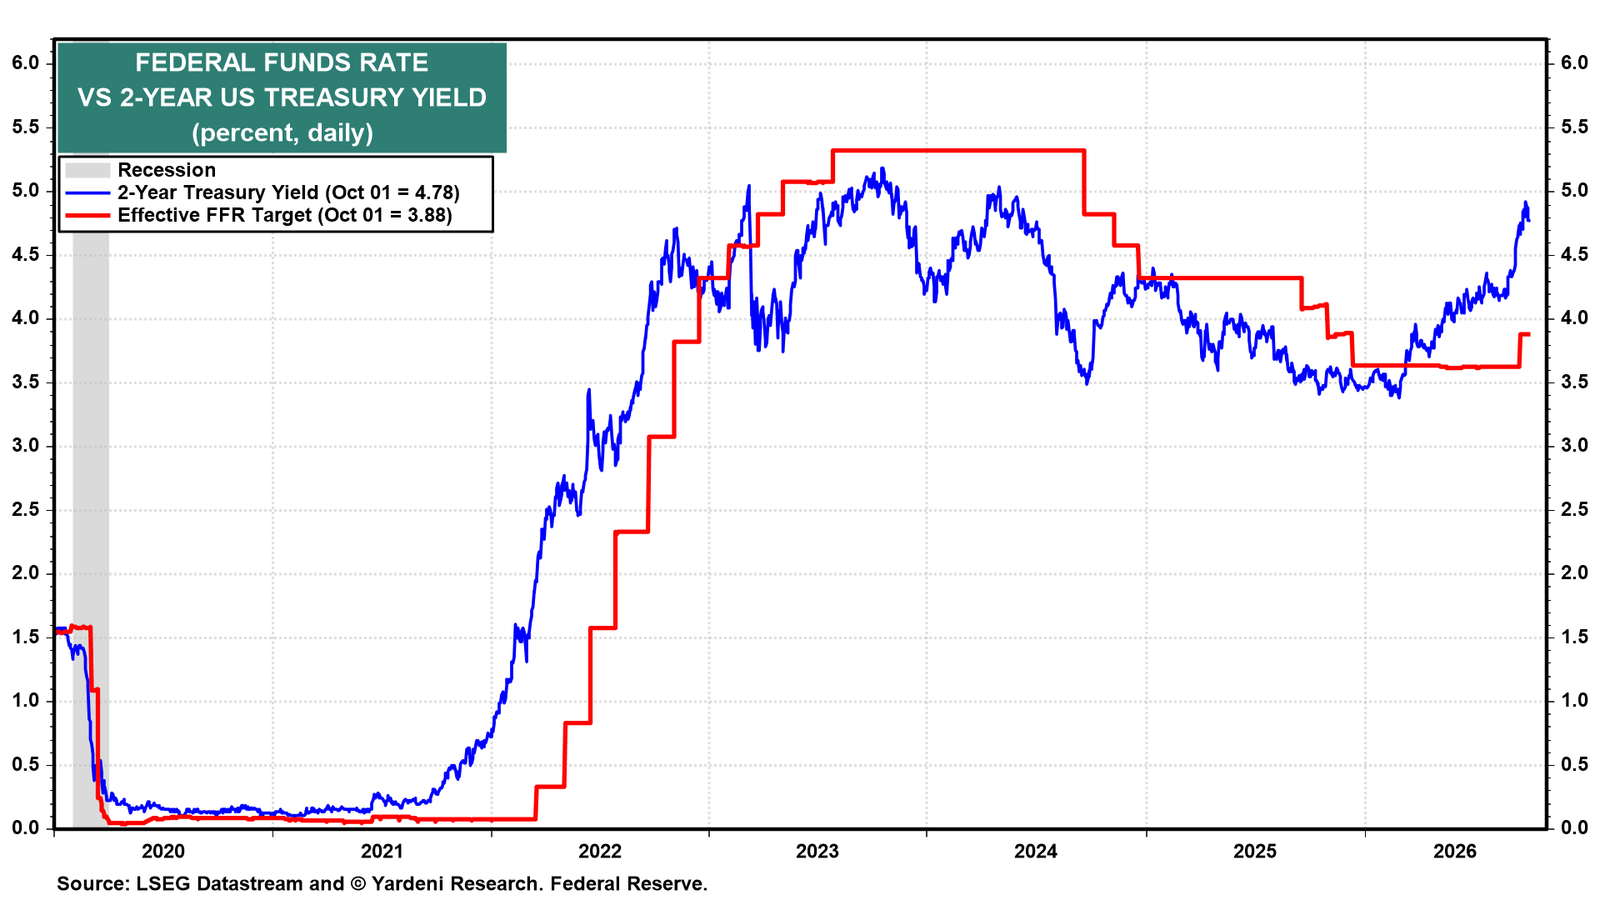
Friday's employment report disappointed. Payrolls rose only 29,000 in September versus forecasts of 80,000-100,000, with 60,000 of additional downward revisions for July and August. The 10-year yield dipped on the news, then recovered, suggesting that more than the economy's strength or weakness is driving yields. The 2-year yield is 4.78%, well above the 3.88% federal funds rate and discounting more Fed rate hikes ahead (chart). We see the payroll miss as an outlier among otherwise solid labor market indicators.
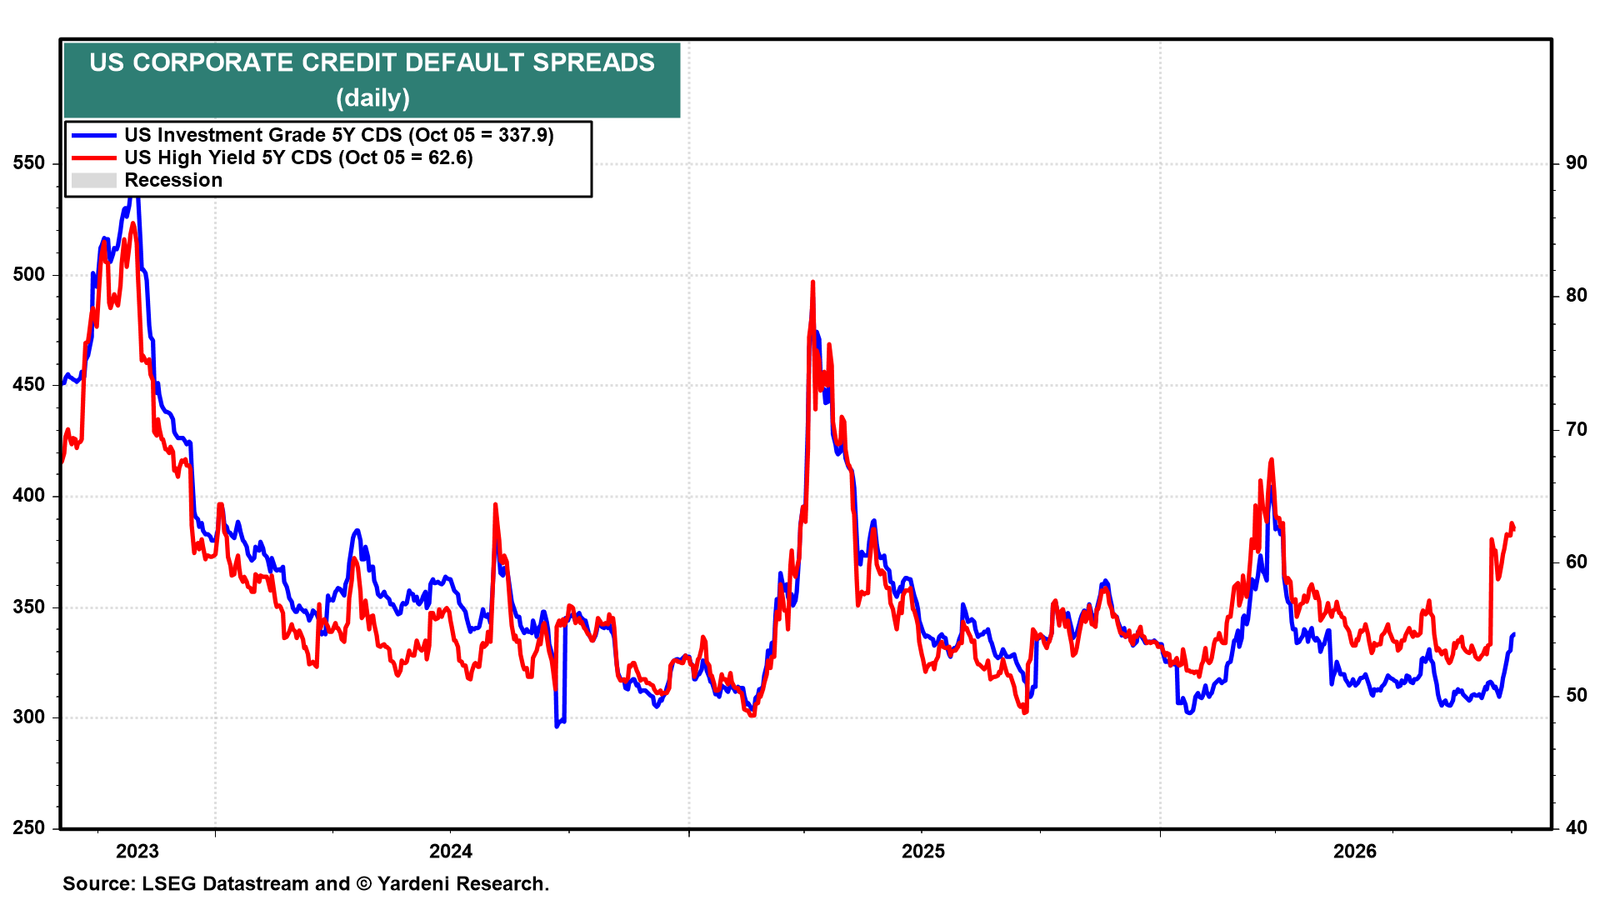
Credit markets are starting to show signs of stress as interest rates move higher. Credit default swap spreads have widened in recent weeks (chart).
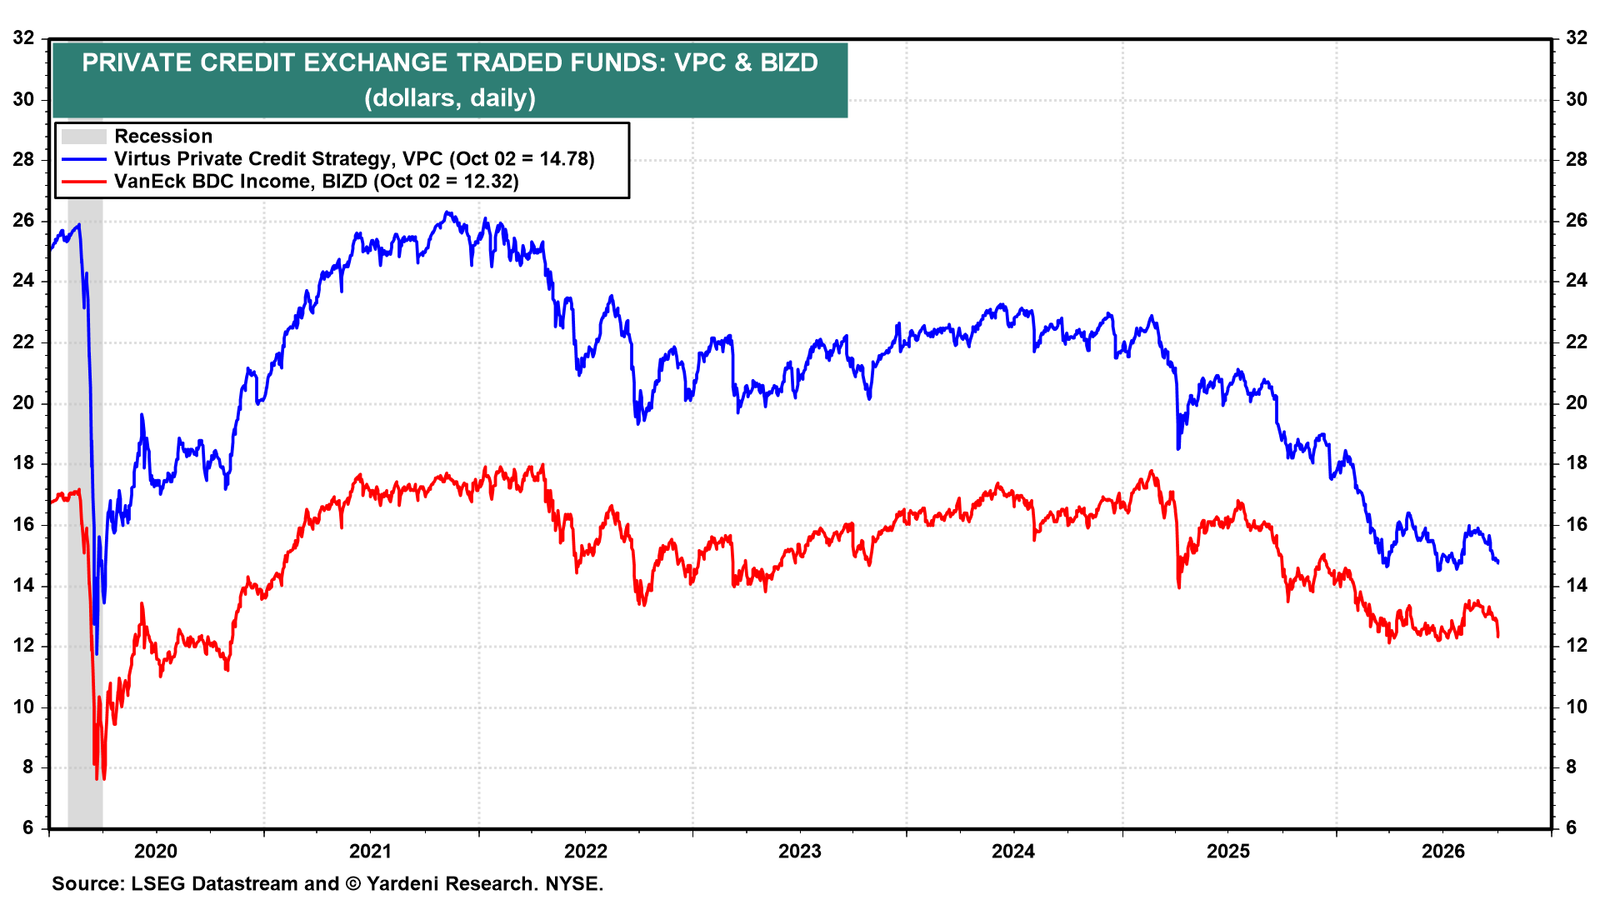
Private credit is also show some distress again. The Virtus Private Credit Strategy ETF and the VanEck BDC Income ETF have taken another leg down (chart). The slide coincides with another quarter of heavy redemption requests at nontraded private credit funds, many of which remain above their 5% quarterly withdrawal limits. The stress has remained within private credit. It hasn't spilled over into the broad stock market.
II. Stocks
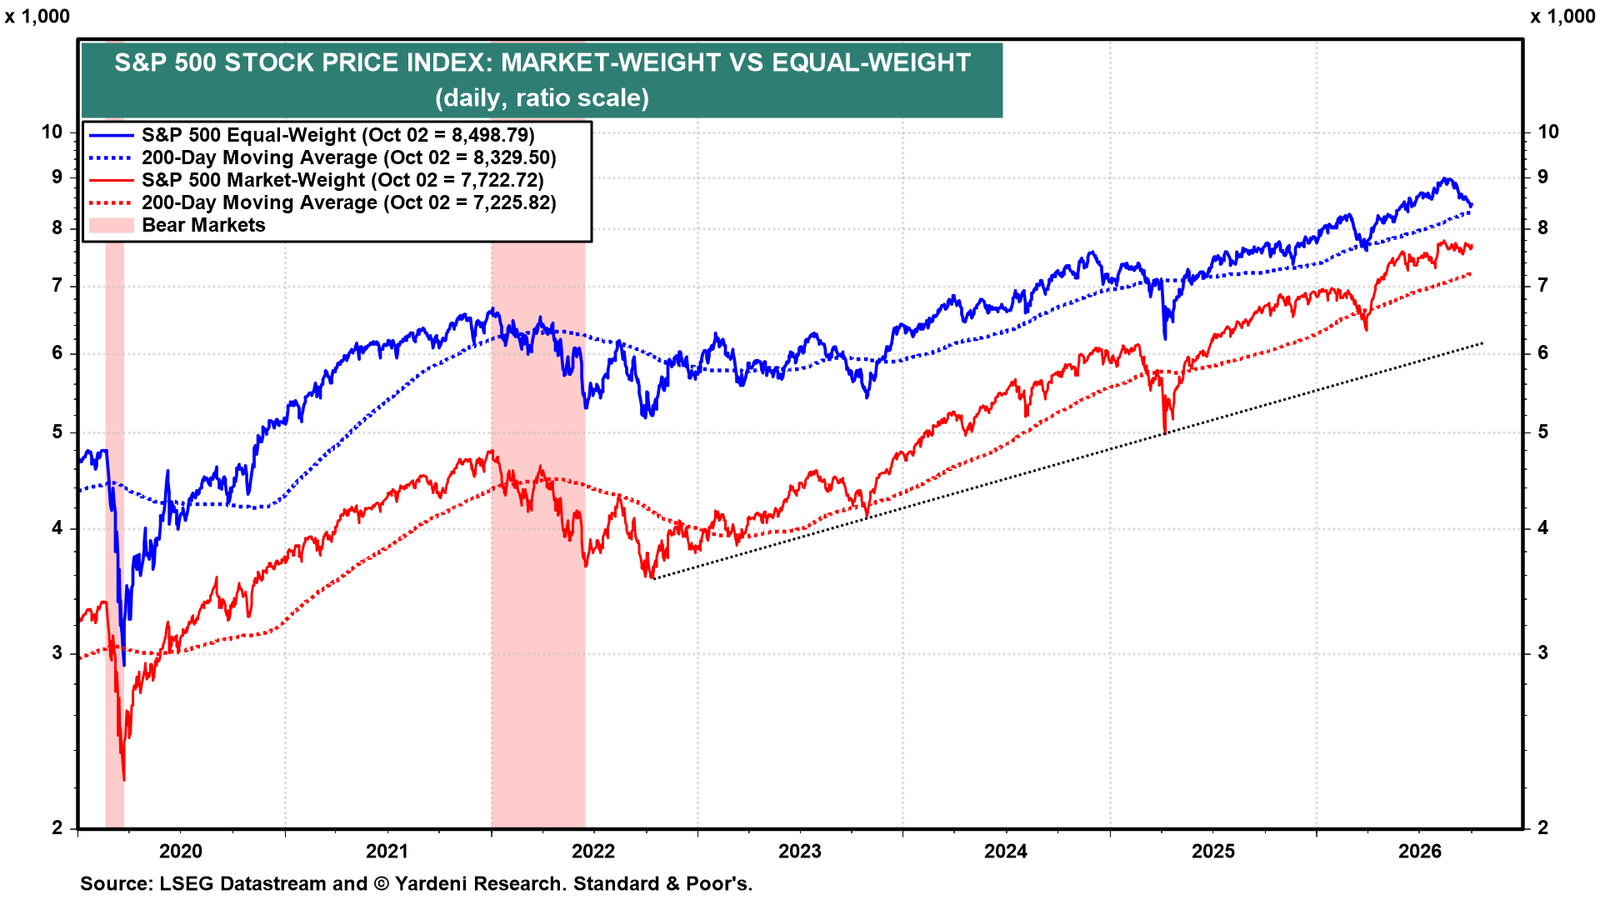
The S&P 500 closed at 7,722.72 on Friday, 1.0% below its August 13 record high (chart). The S&P 500's summer stall has turned into a fall stall. The equal-weight S&P 500 is down 5.9% from its August 14 record high and is now only 2.0% above its 200-day moving average.
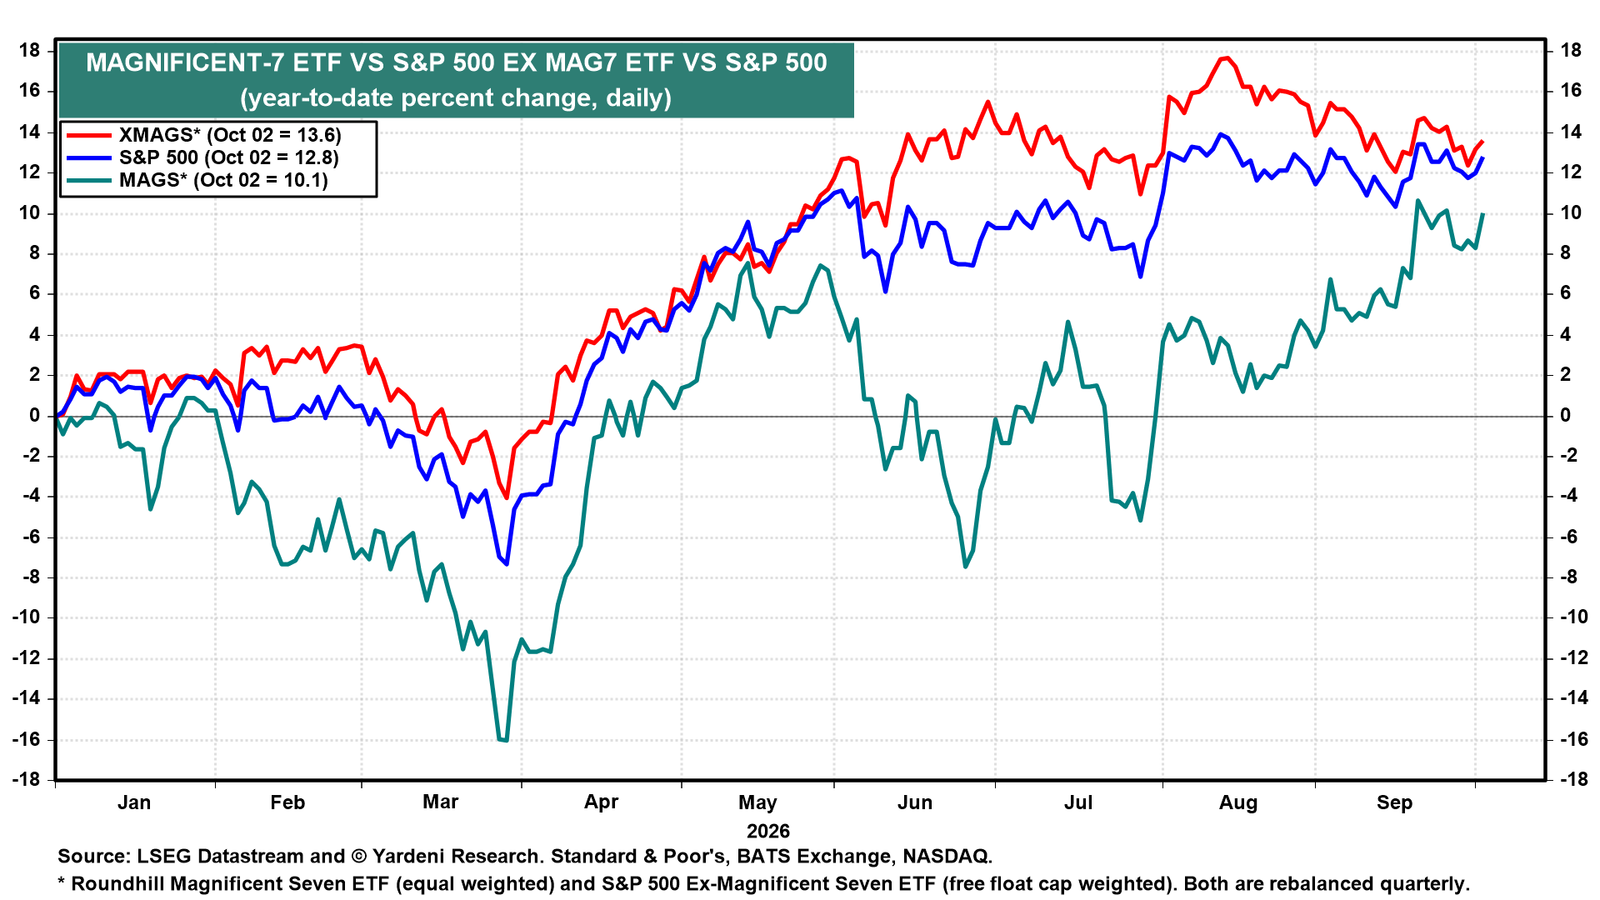
Concentration worries have returned with the Magnificent-7's rebound since mid-August. XMAGS is up 13.6% ytd, versus 10.1% for MAGS and 12.8% for the S&P 500 (chart). The broad market's outperformance has shrunk considerably since August.
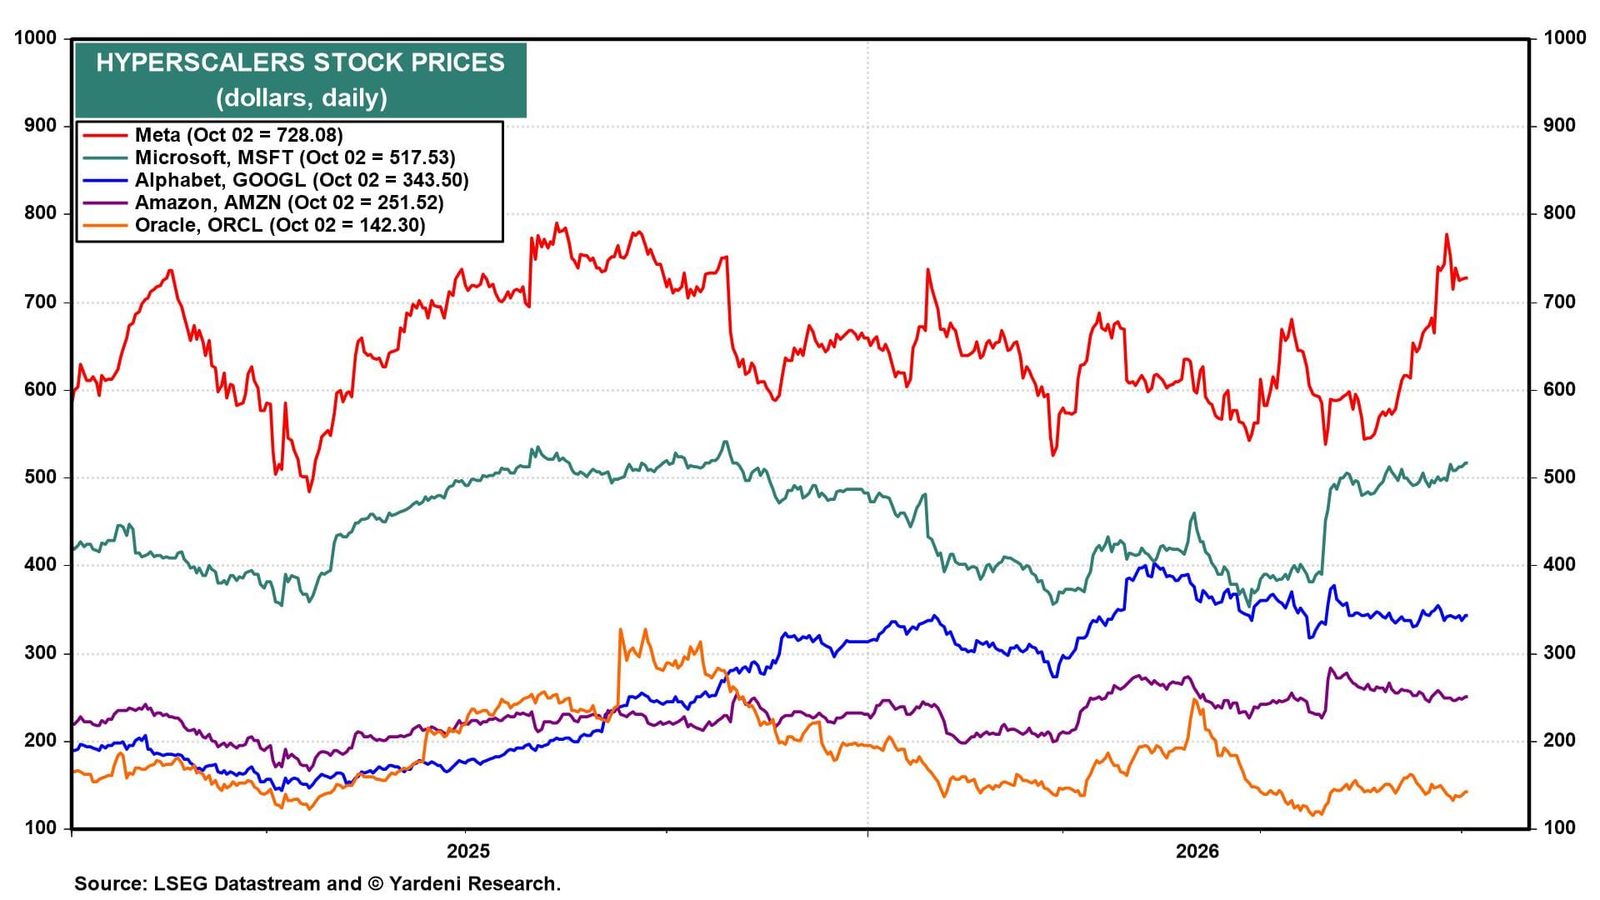
The rebound in the stock prices of the hyperscalers since late July has been led by Meta (chart).
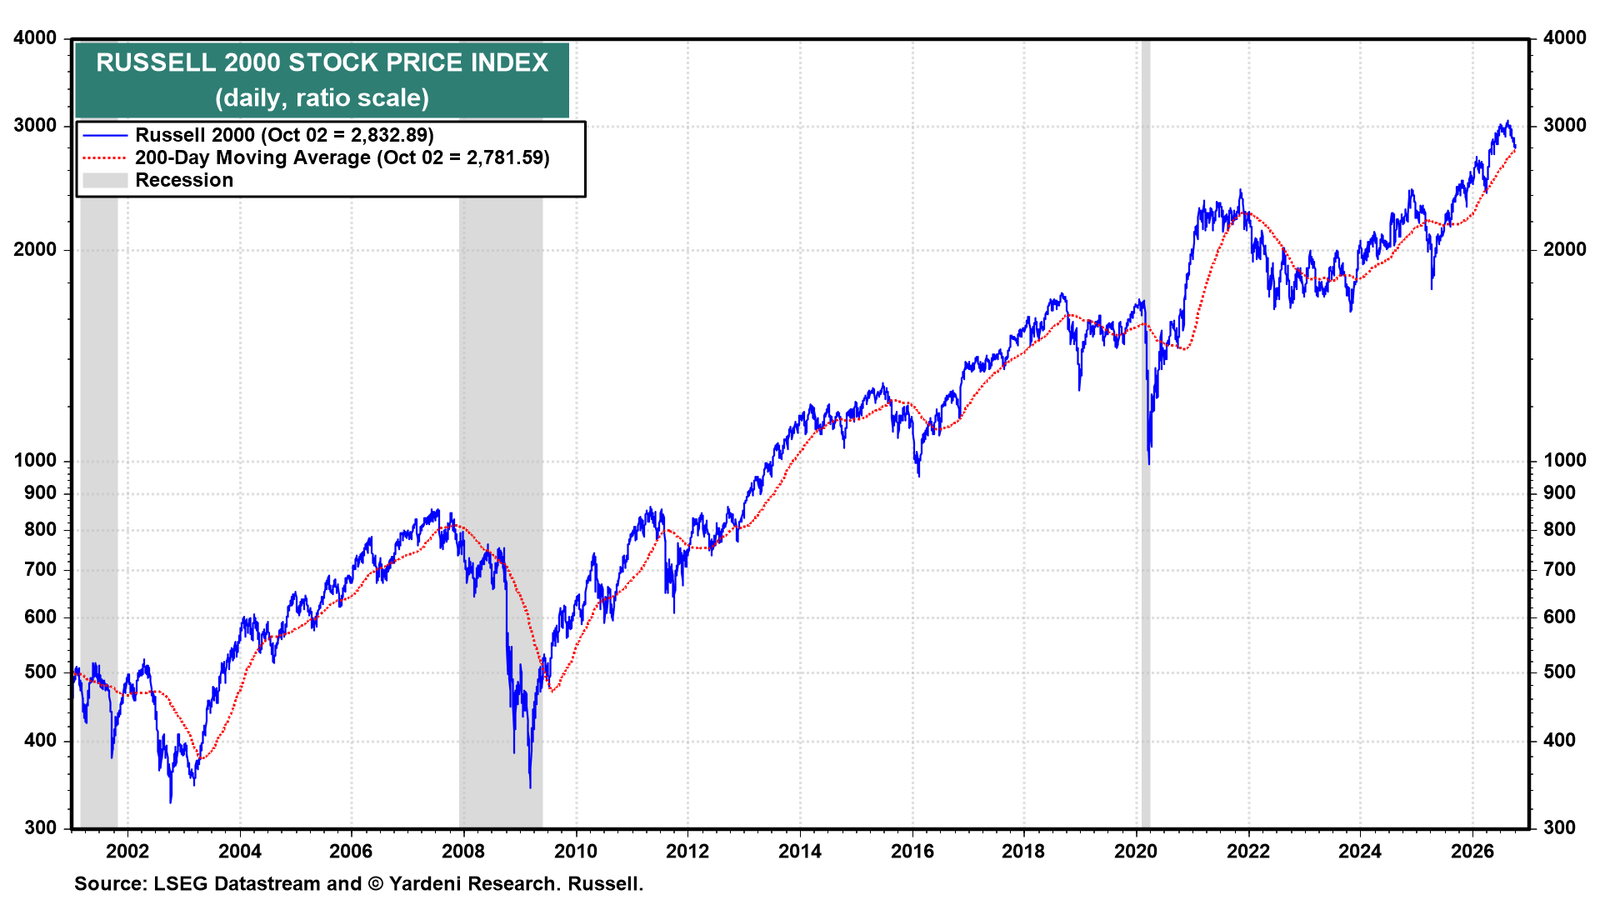
The Russell 2000 is down 7.7% from its record high on August 14 and 1.8% above its 200-day moving average (chart). SmallCaps are very sensitive to interest rates. If high bond yields start to bite the economy, the SmallCaps will be the first to react.
III. Earnings
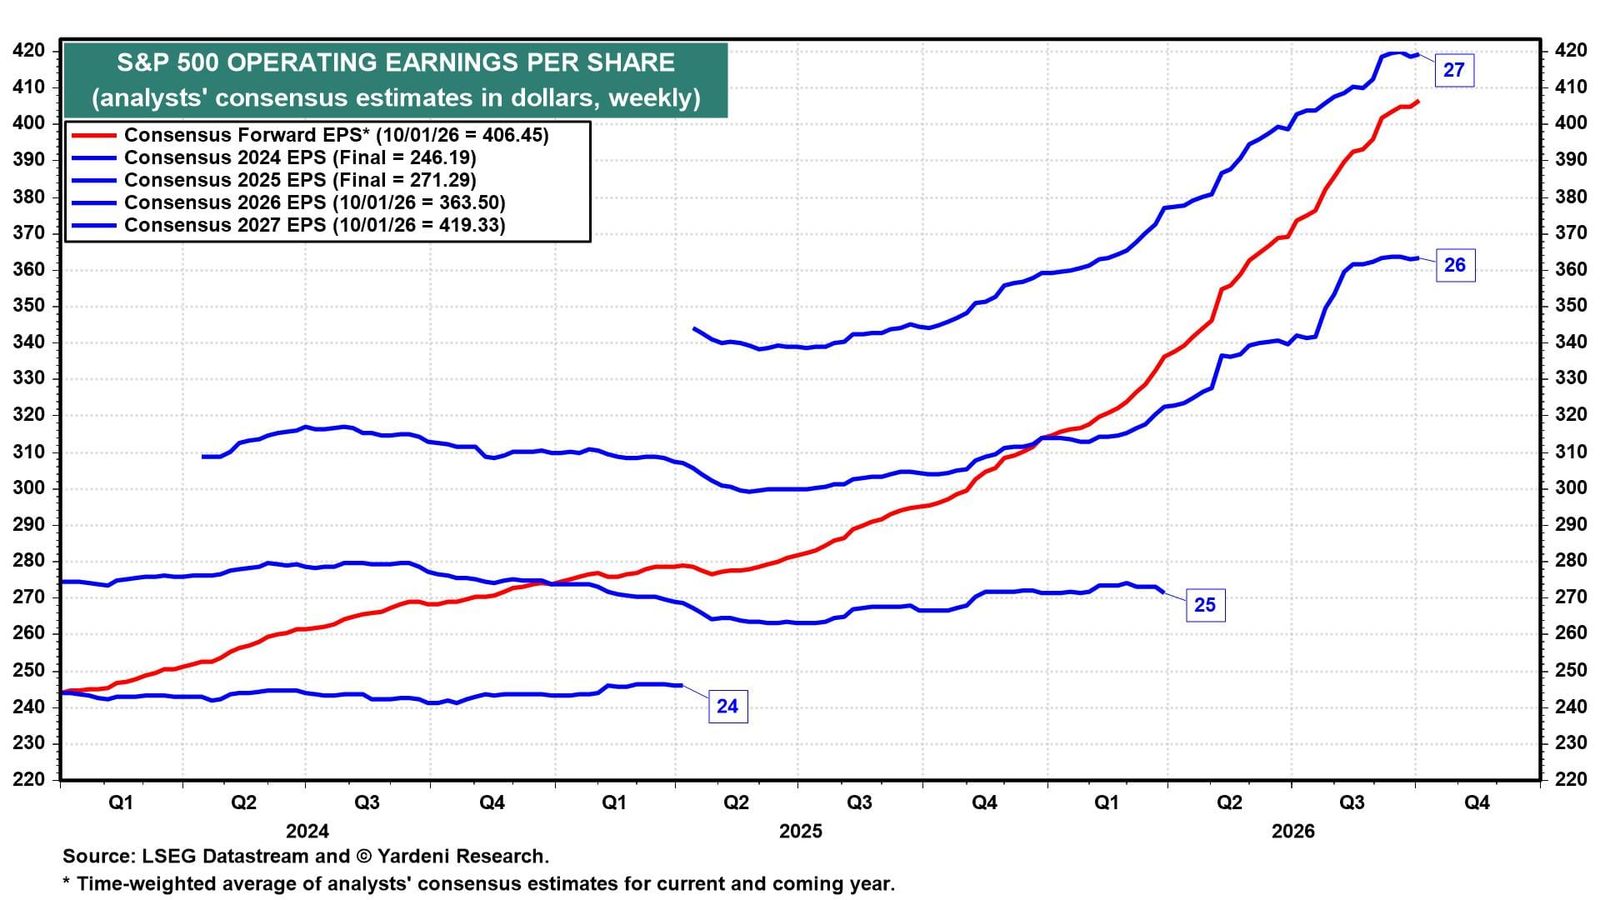
The fabulous earnings momentum (FEMO) story remains intact. S&P 500 forward earnings rose to a record $406.45 per share last week. The 2027 consensus estimate has flattened over the past few weeks around $419 (chart). We still expect both to climb to $425 by year-end on better-than-expected Q3 and Q4 earnings. JPMorgan kicks off the Q3 earnings reporting season on October 13.
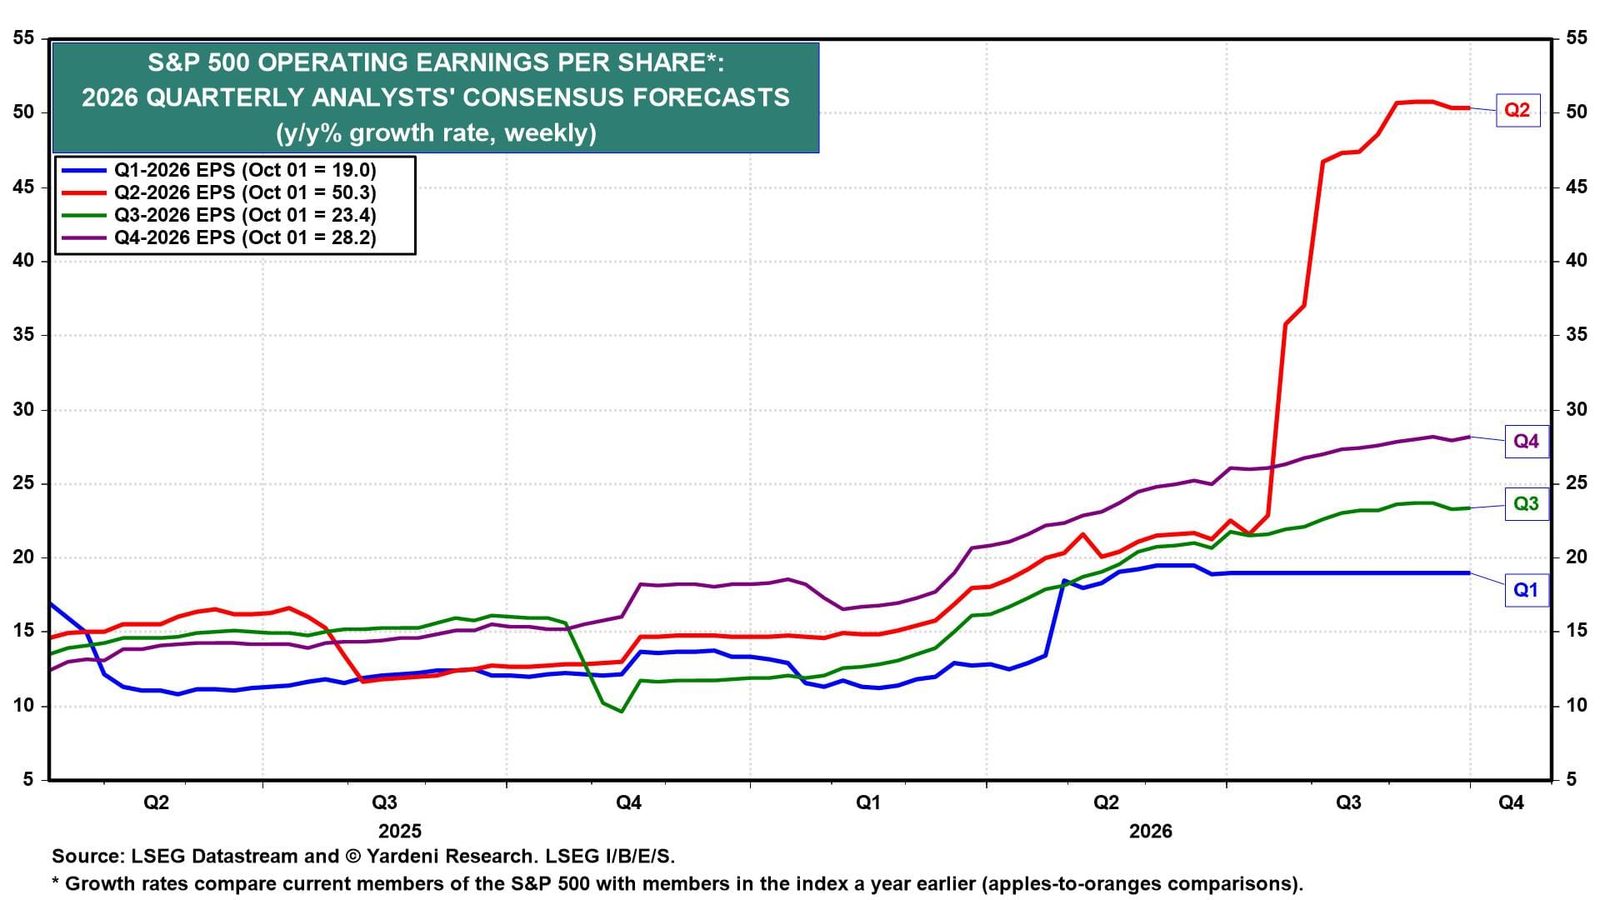
Industry analysts expect Q3 earnings to rise 23.4% y/y and Q4 earnings to rise 28.2% (chart). Both estimates have edged down ahead of reporting season, as they usually do. We expect companies to clear the lowered bar.
IV. Valuation
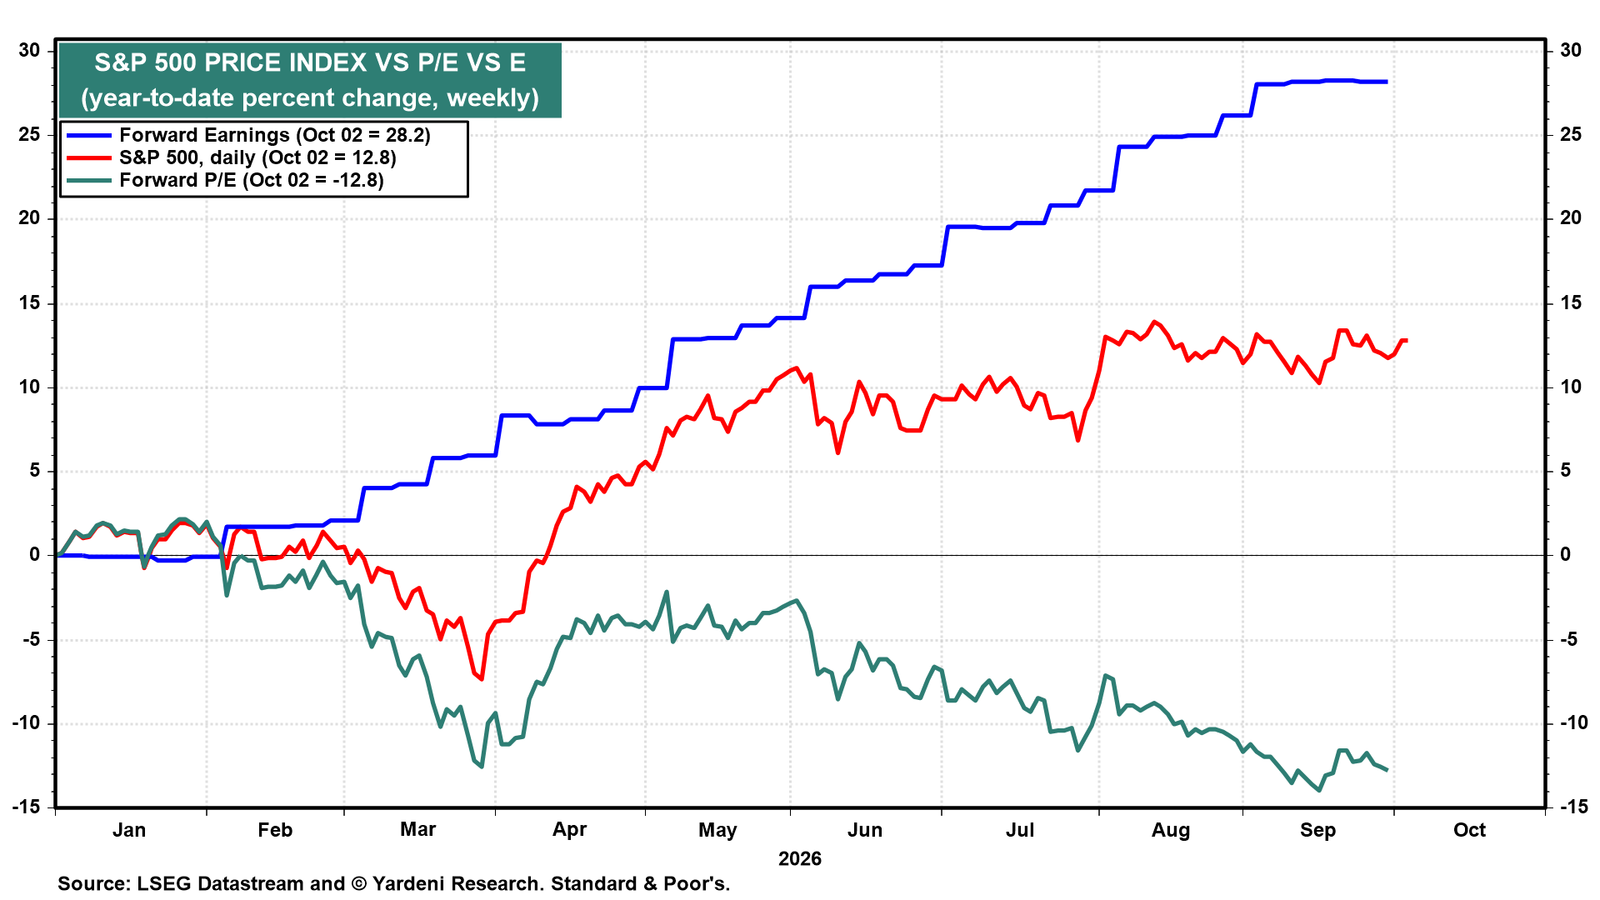
Since mid-August, the stock market's slippage has come entirely from a lower multiple. S&P 500 forward earnings is up 28.2% ytd, compared with 12.8% for the price index, while the forward P/E is down 12.8% (chart).
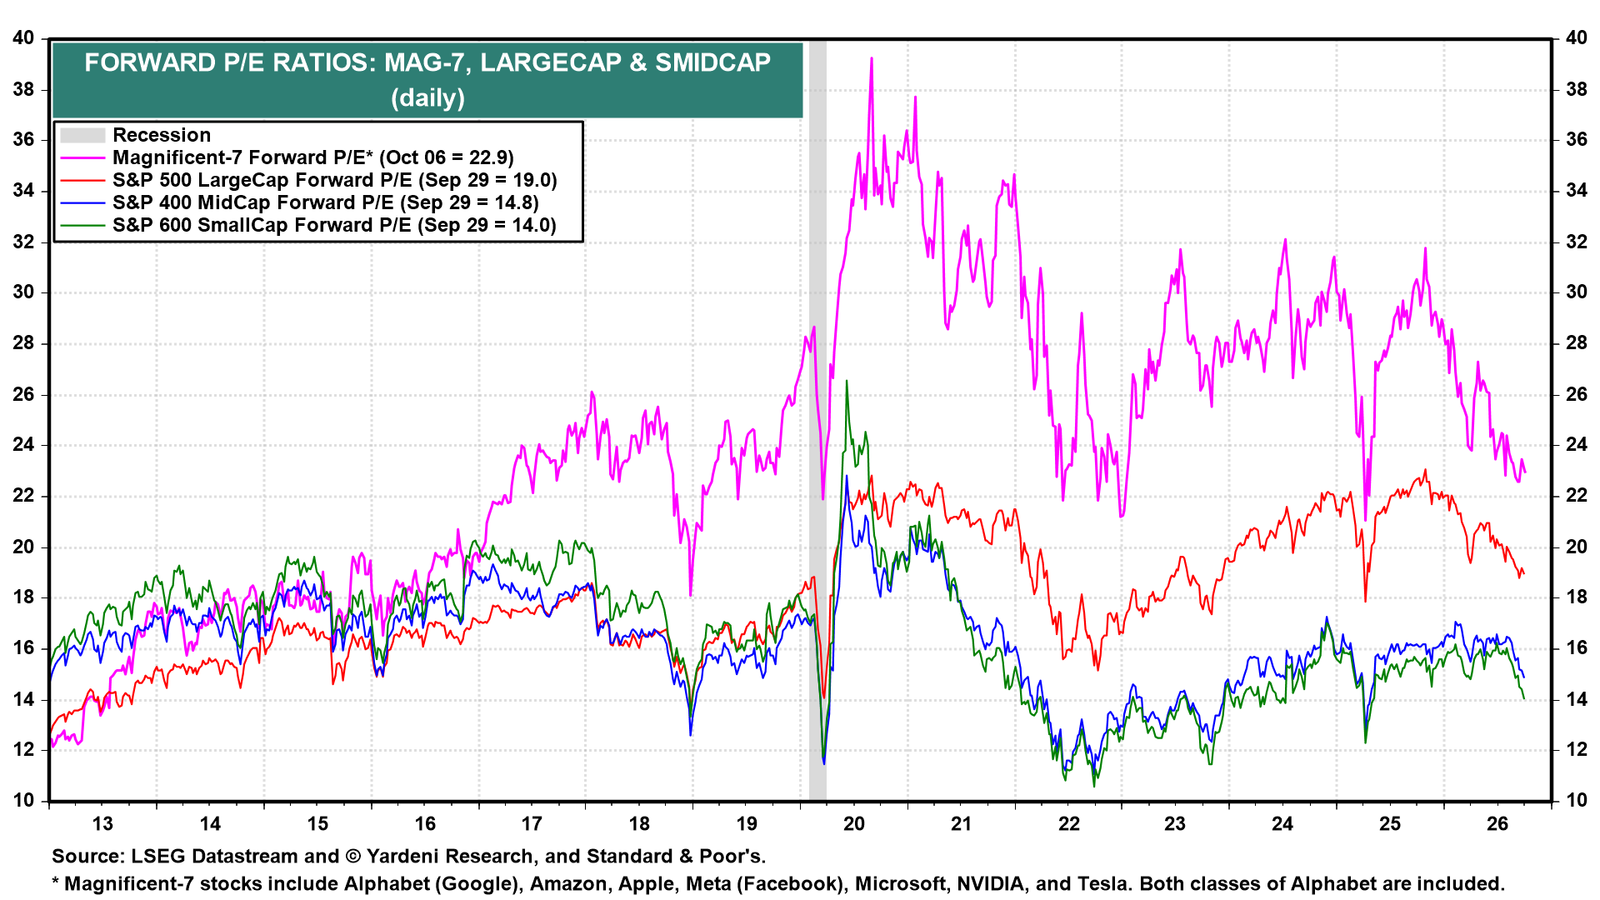
The S&P 500’s forward P/E is 19.0, the Mag-7’s is 22.9, and the SMidCaps’ (i.e., SmallCaps and MidCaps collectively) is below 15 (chart). Our 7,900 S&P 500 target assumes an 18.6 multiple. With the 10-year yield above 5.00%, we see more downside than upside for valuations through year-end.
V. Sentiment
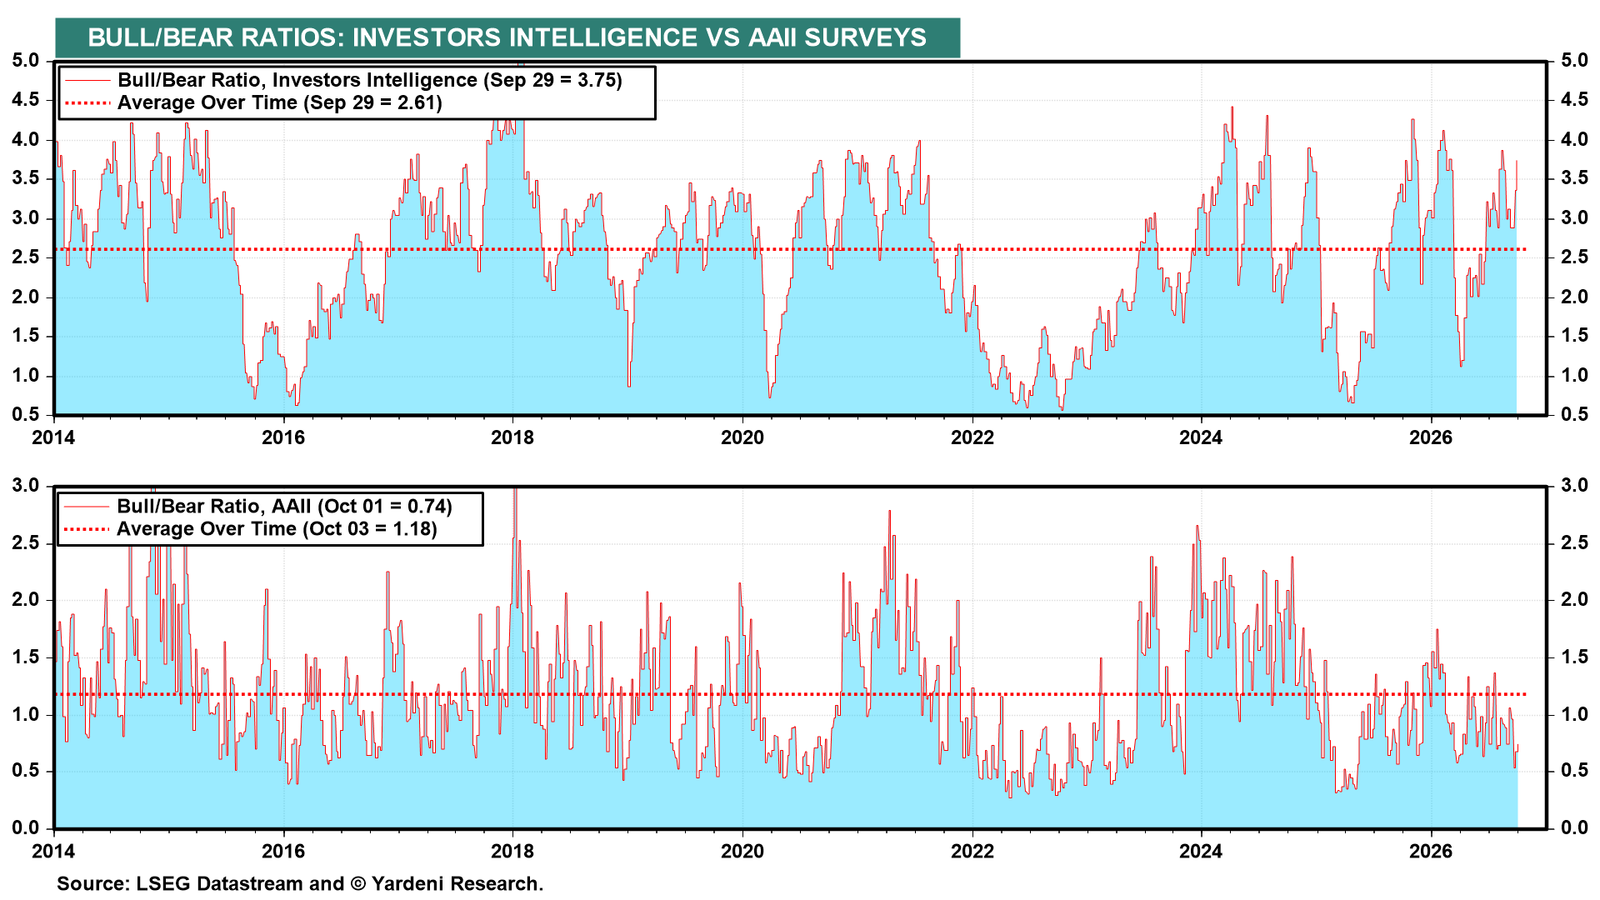
The two bull/bear ratios we follow are pointing in opposite directions. The Investors Intelligence ratio is 3.75, well above its 2.61 average, while the AAII ratio is 0.74, well below its 1.18 average (chart). Newsletter writers are too bullish. Individual investors are too bearish.
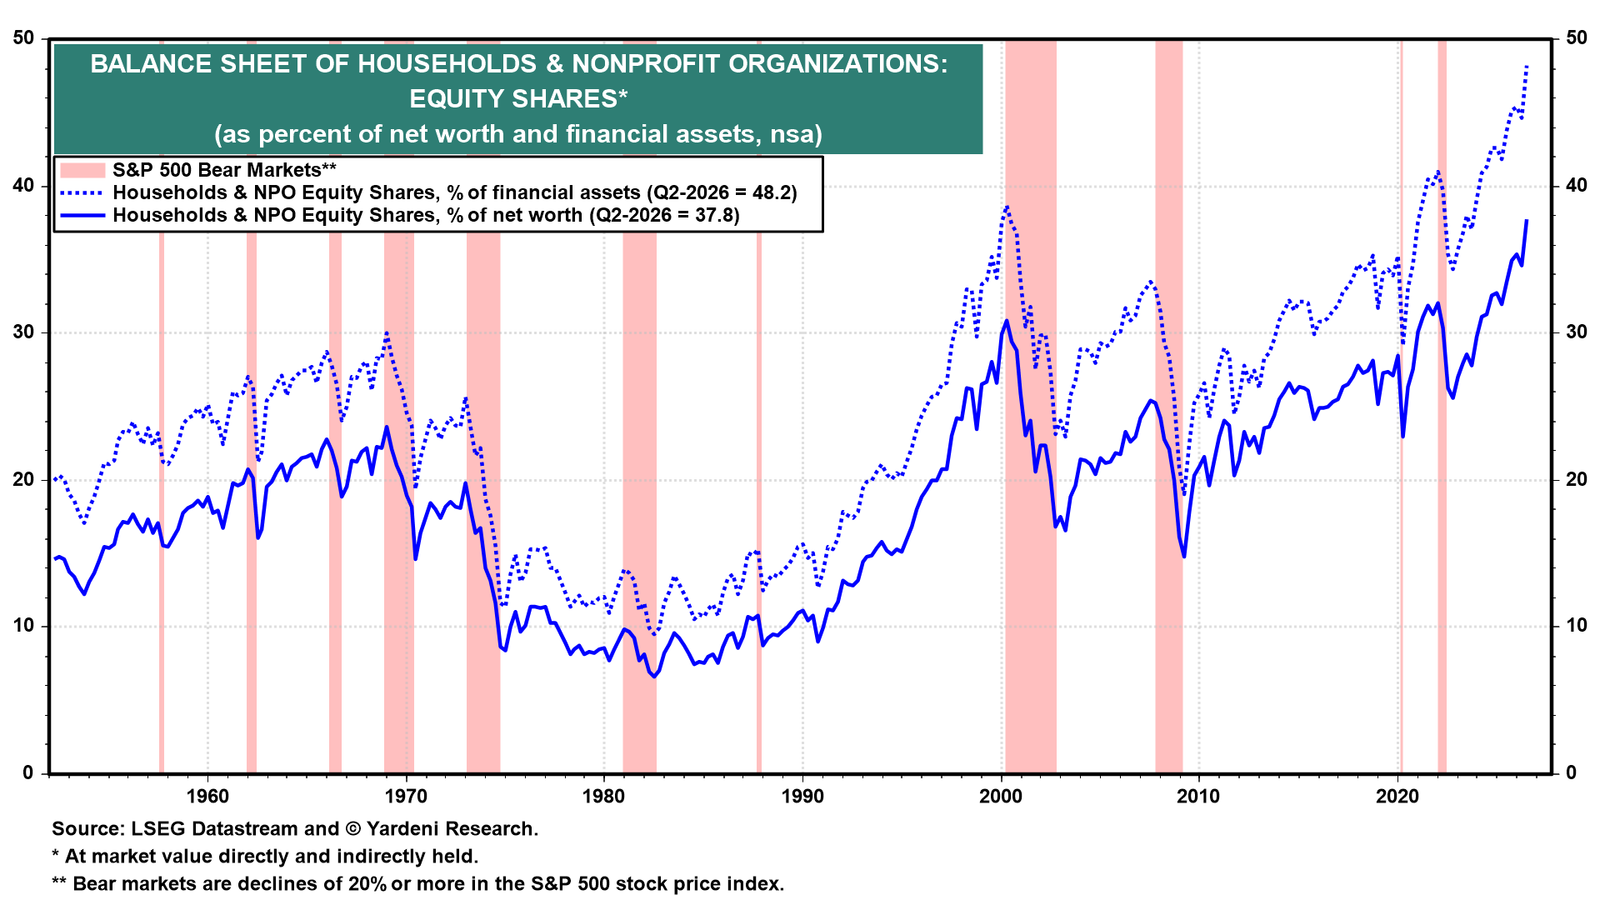
Individual investors may seem to be bearish, but they are fully invested. Equities rose to a record 37.8% of household net worth and 48.2% of household financial assets in Q2 (chart).
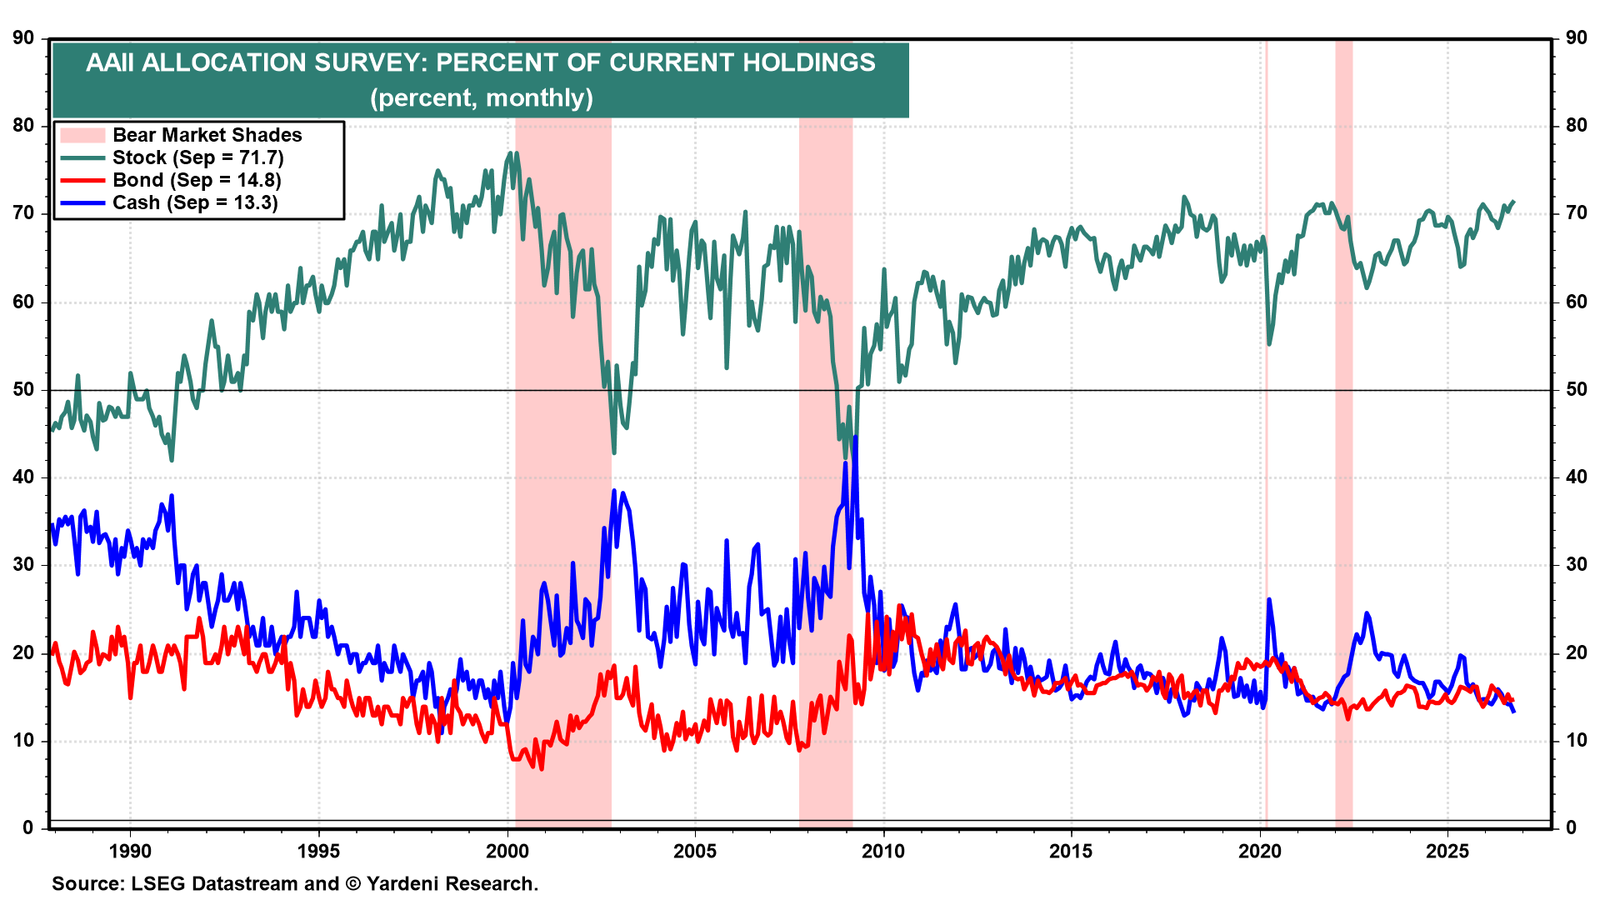
AAII members hold 71.7% of their portfolios in stocks, 14.8% in bonds, and only 13.3% in cash (chart). Retail investors are in this market with both feet.