In the spectrum of bullish stock markets, there are two polar opposites. The first is driven by FOMO, the Fear of Missing Out, which inflates P/E multiples as investors chase hope and hype rather than fundamentals, creating the conditions for a bubble. The second is driven by FEMO, or Fabulous Earnings Momentum, which works the other way around: Corporate earnings grow faster than stock prices, compressing P/E multiples rather than expanding them, and analysts raise their estimates because the fundamentals justify doing so.
The current bull market has been in the middle of the spectrum, but has moved more toward the FEMO variety this year. It is being driven by real, measurable, and record corporate profits. And it is lifting not just stock prices but the entire economy. Consider the following:
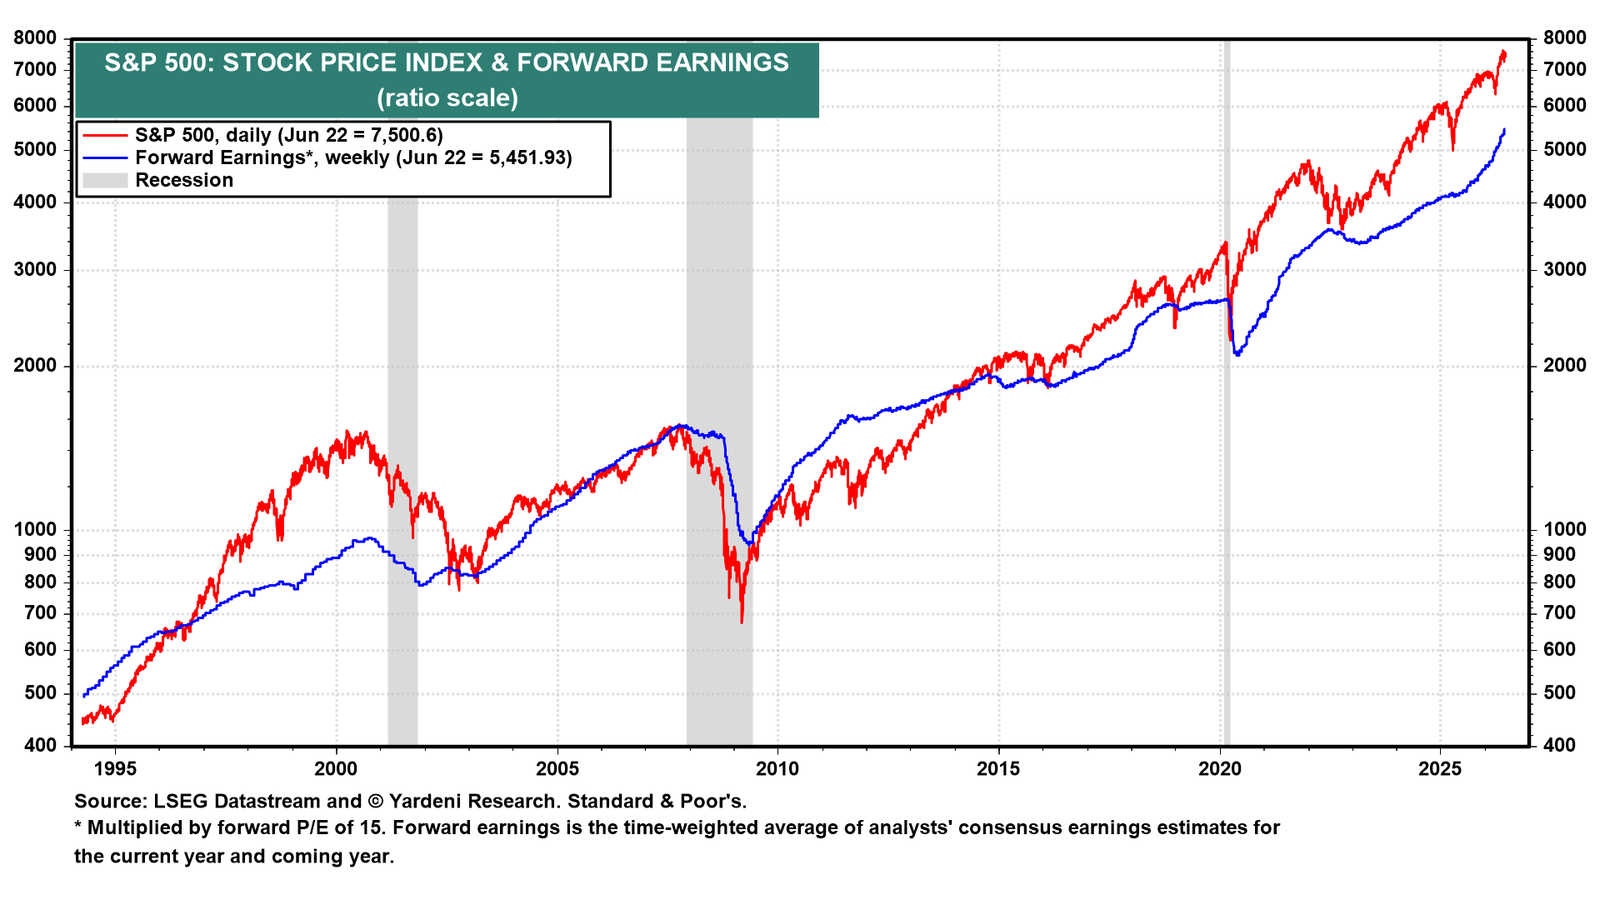
(1) FEMO & the Index of Coincident Economic Indicators. S&P 500 forward earnings multiplied by a constant forward P/E of 15.0 tracks the S&P 500 price index remarkably well over time (chart). The two series have moved together through every cycle since the mid 1990s, confirming that earnings drive the stock market. Since the bull market began in October 2022, the S&P 500 has risen above the forward earnings series multiplied by 15.0. That gap is multiple expansion: Investors are paying more per dollar of forward earnings as confidence in the upward trajectory has solidified.
The current bull market has been driven by rising forward earnings and also by multiple expansion. The index is up 105% since October 22, 2022, while forward earnings is up 56%. However, this year, the index has been led mostly by FEMO.
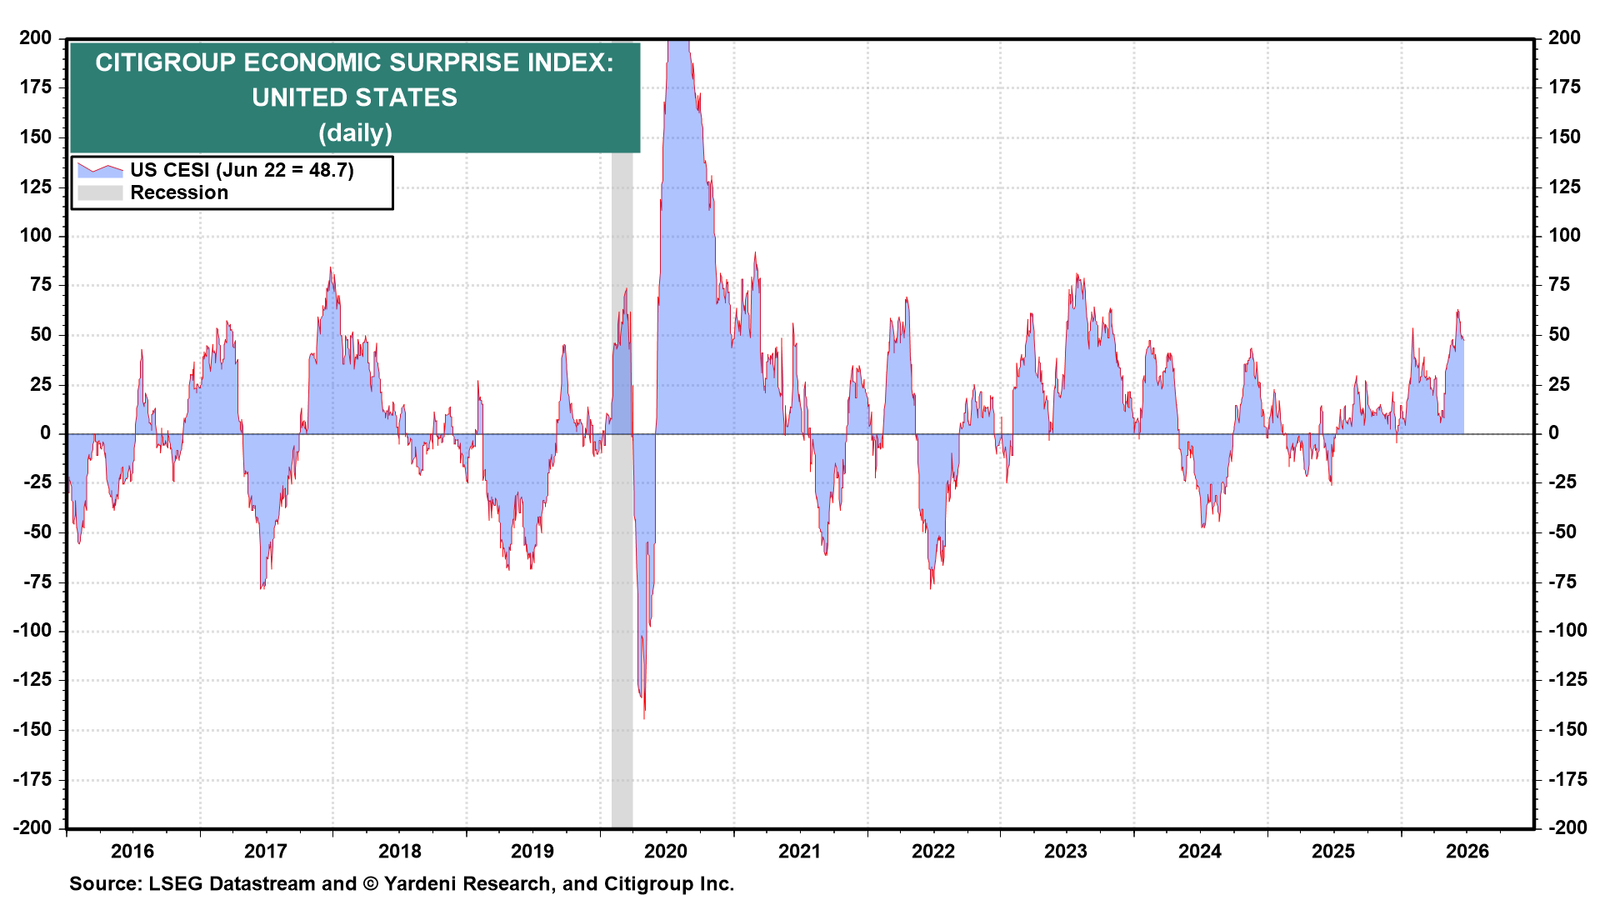
FEMO is lifting the economy through two channels. The first is the wealth effect: Rising stock prices increase household net worth, boosting consumer spending. The second is the profit channel: Profitable companies expand operations, hire more workers, pay higher wages, and invest in new productive capacity. Workers spend their wages, companies respond to demand, and a virtuous cycle takes hold. Both channels currently show up in the economic data. The Citigroup Economic Surprise Index stands at 48.7, firmly in positive territory (chart).
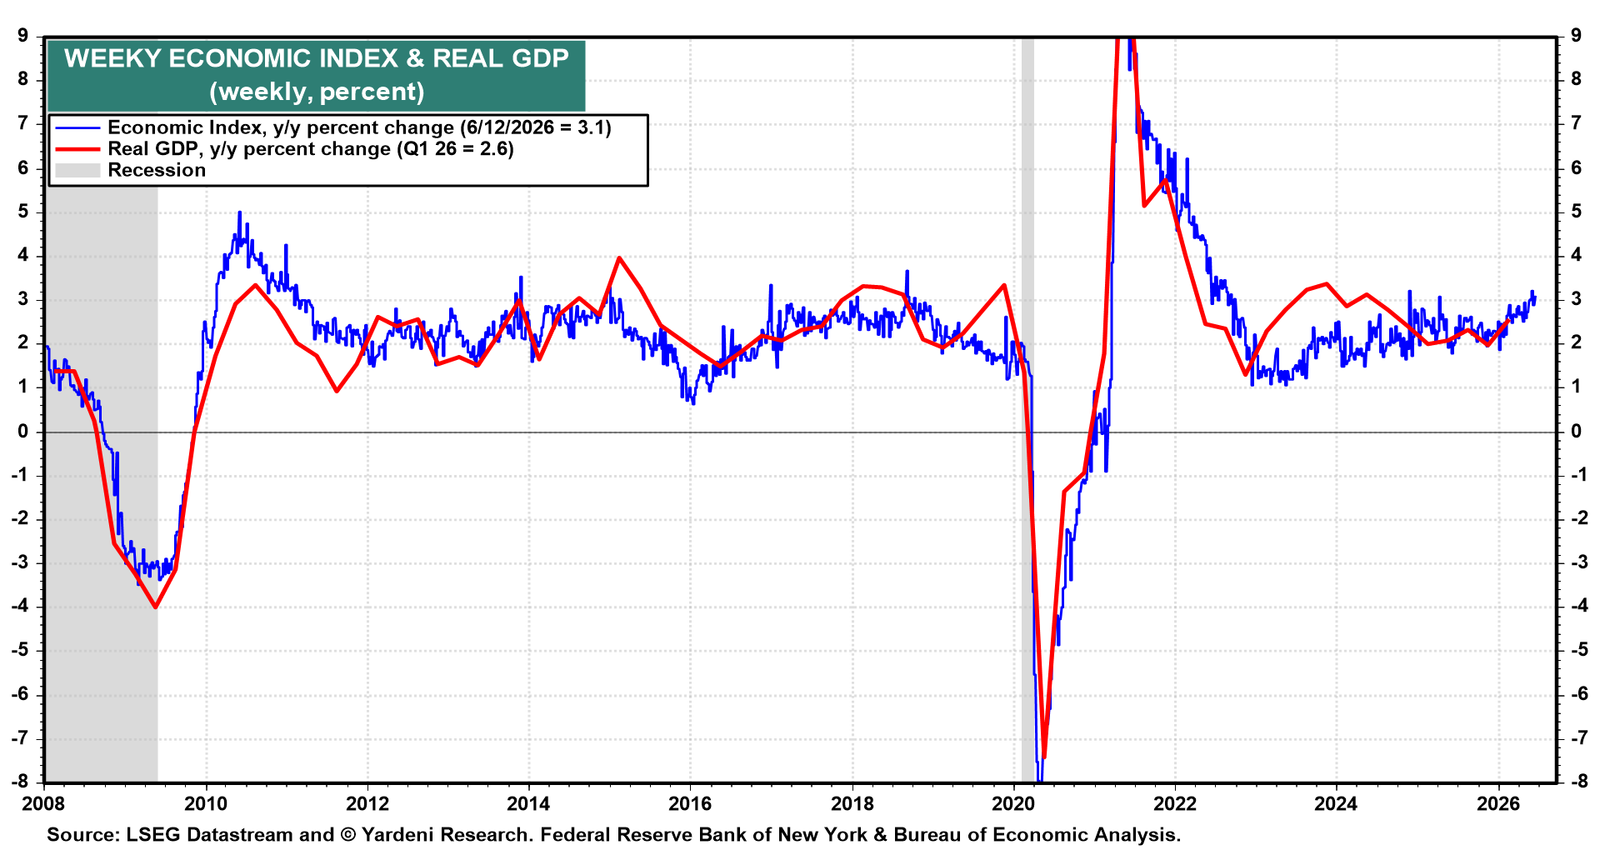
Meanwhile, the Weekly Economic Index has accelerated meaningfully, pointing to real GDP growth of around 3.1% y/y (chart).
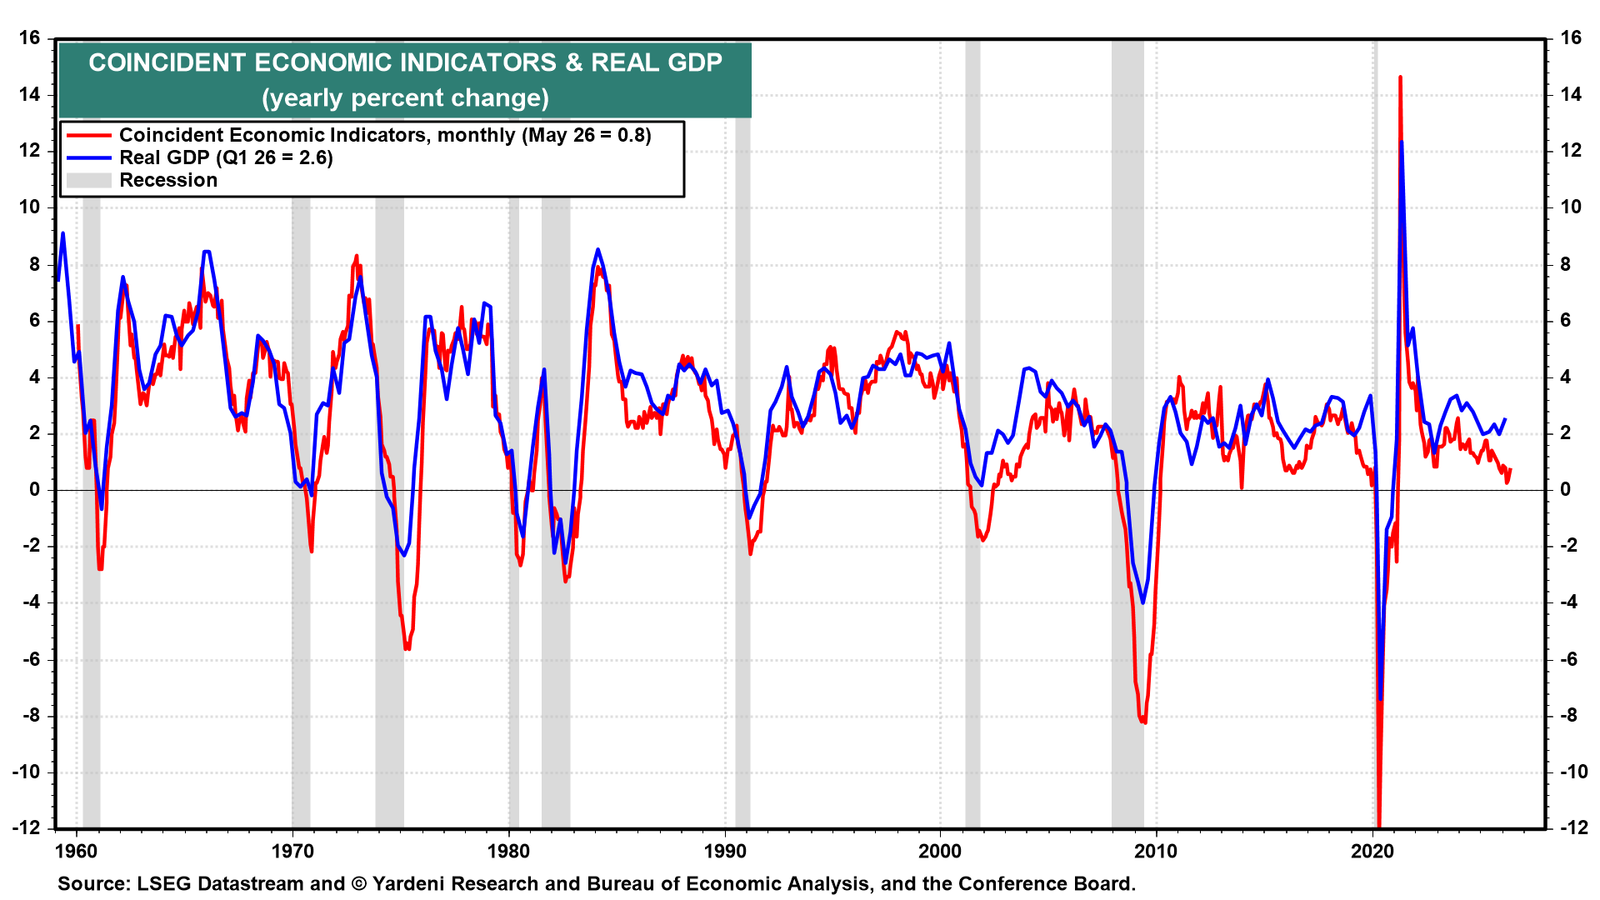
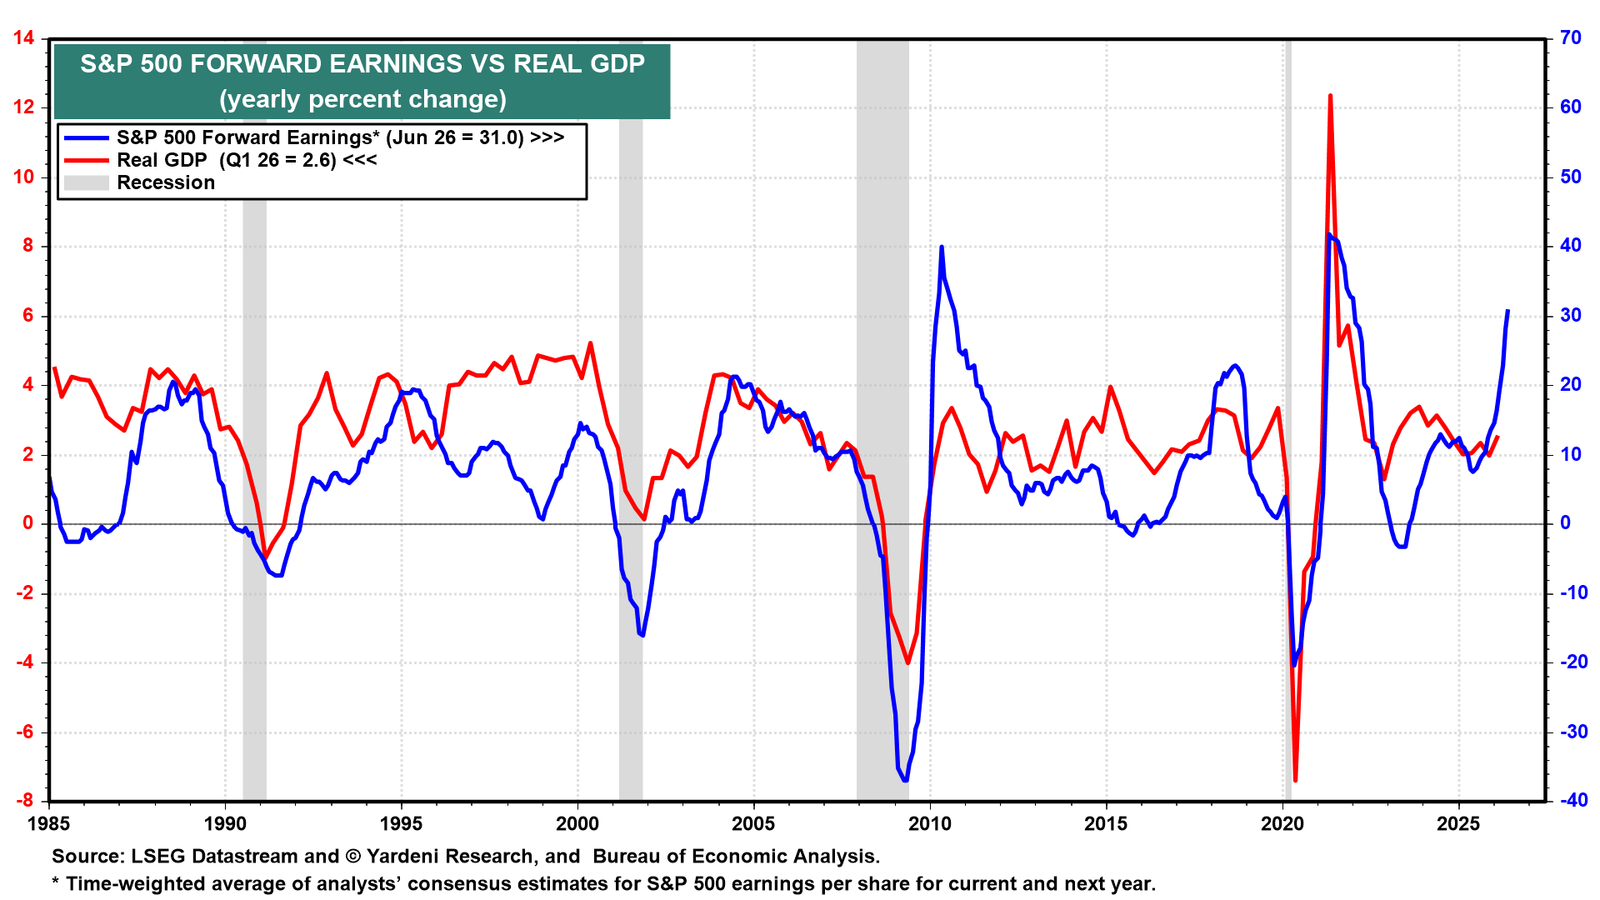
On the other hand, the index of Coincident Economic Indicators (CEI) is growing at just 0.8% y/y, well below the real GDP growth of 2.6% y/y in Q1-2026 (chart). In the past, their growth rates tended to coincide more often than not.
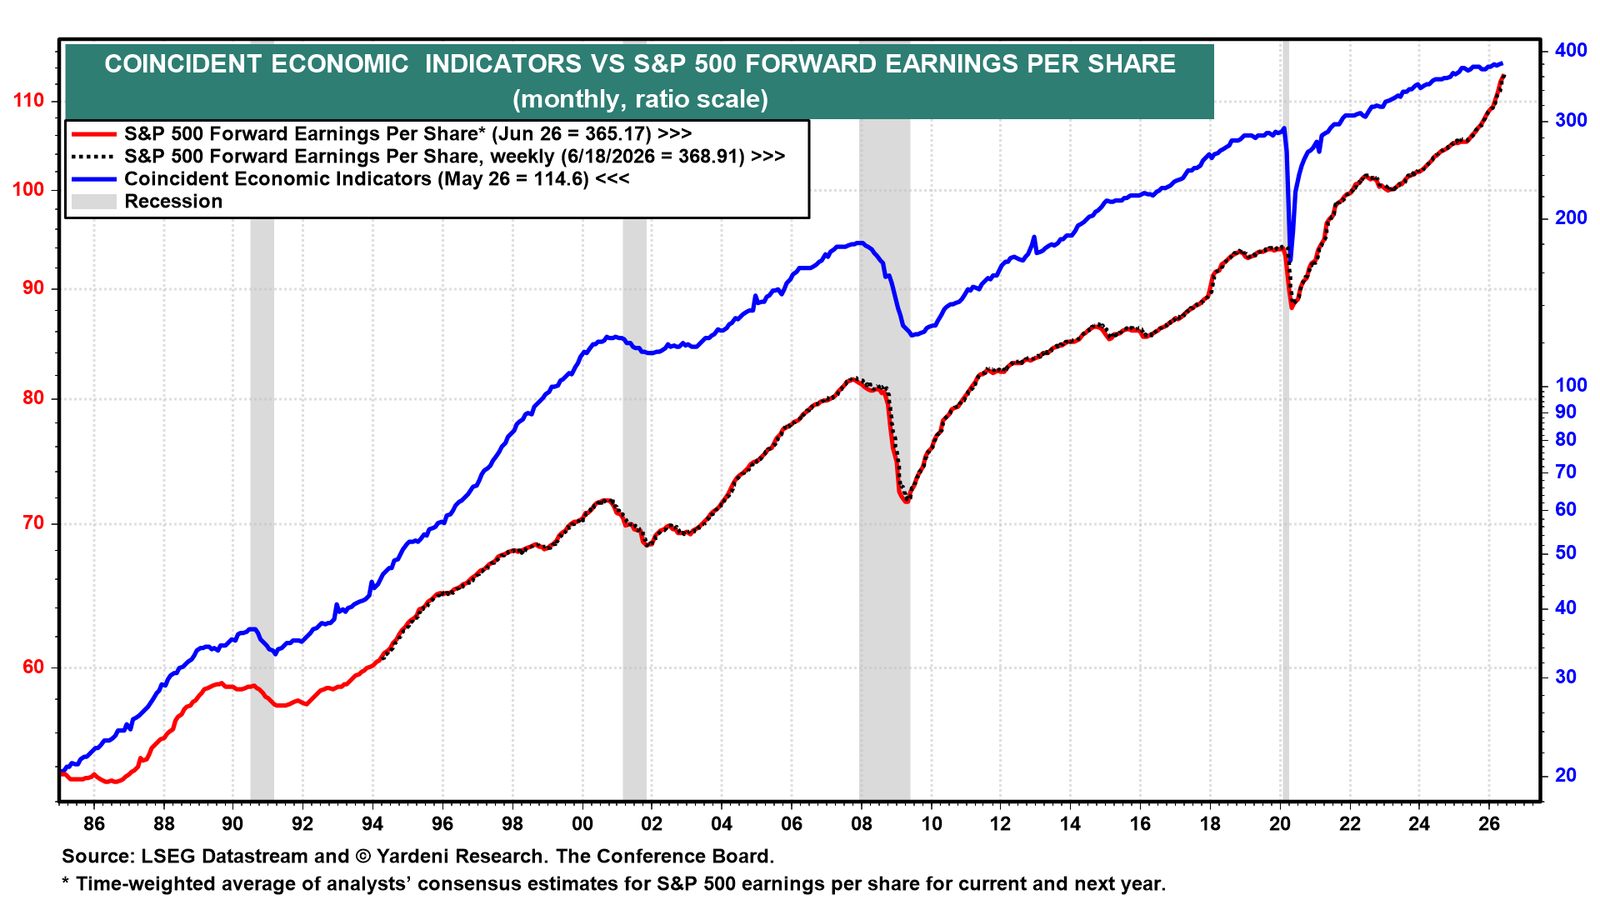
At the same time, S&P 500 forward earnings per share has grown much faster than the CEI since mid-2025, a deviation from their historically tight relationship (chart).
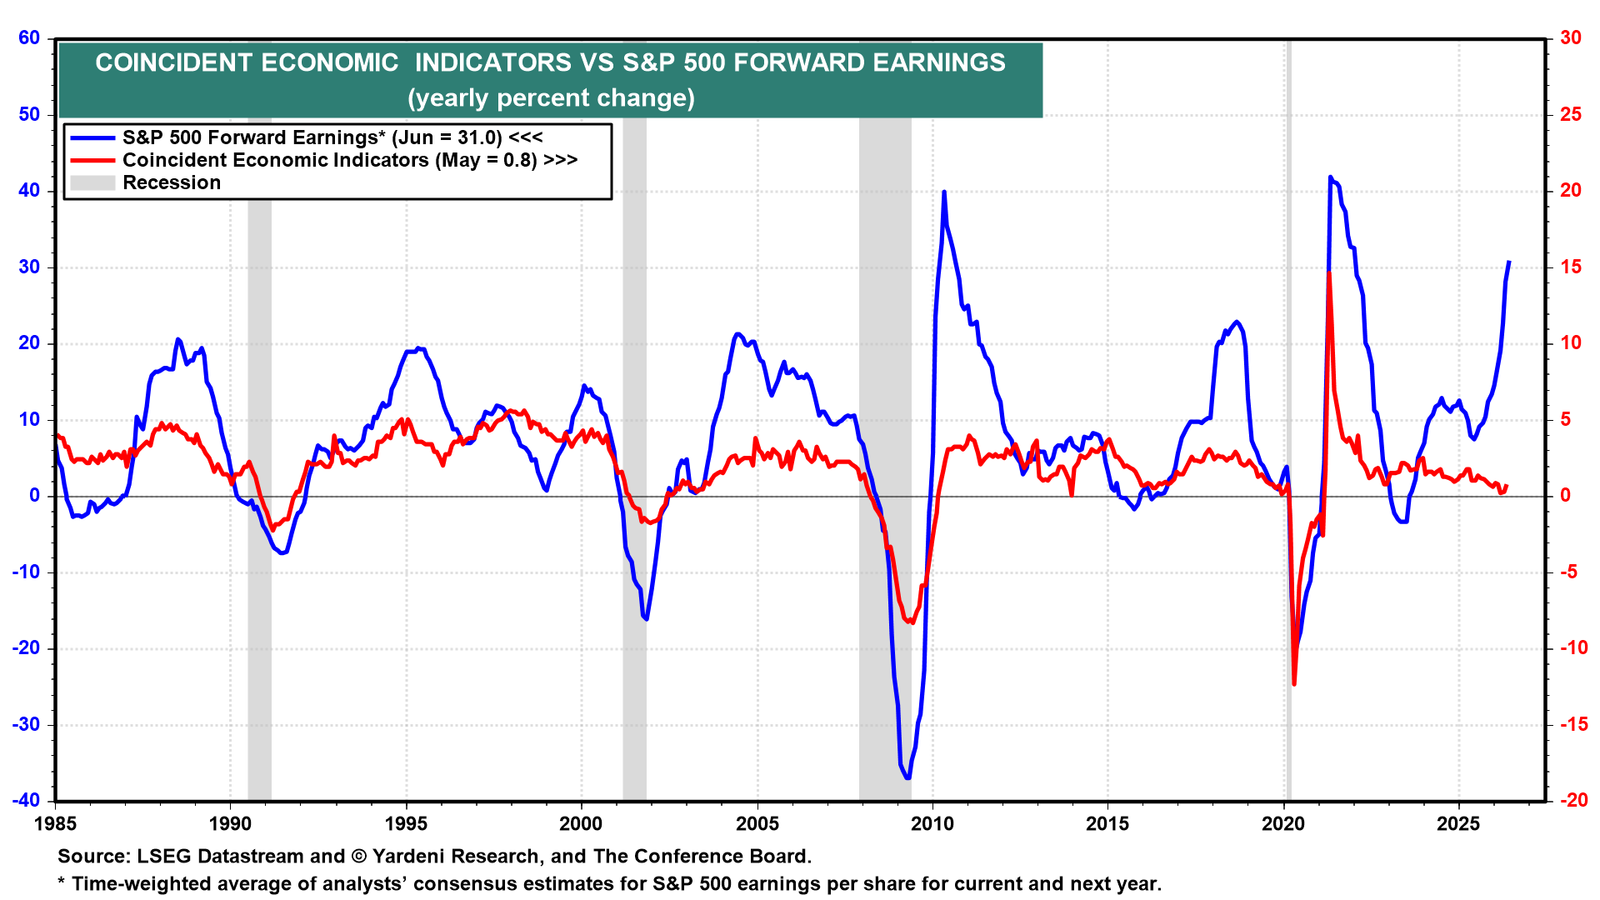
S&P 500 forward earnings per share is up 31.0% y/y through June, while the CEI is up 0.8% through May (chart).
In fact, the ratio of forward earnings to the CEI has reached an all-time high of 3.1 (chart). The rising ratio reflects a structural shift: Technological innovation is expanding profit margins across many sectors, and since profits drive investment, hiring, and consumer spending through the wealth effect, GDP follows corporate profitability.
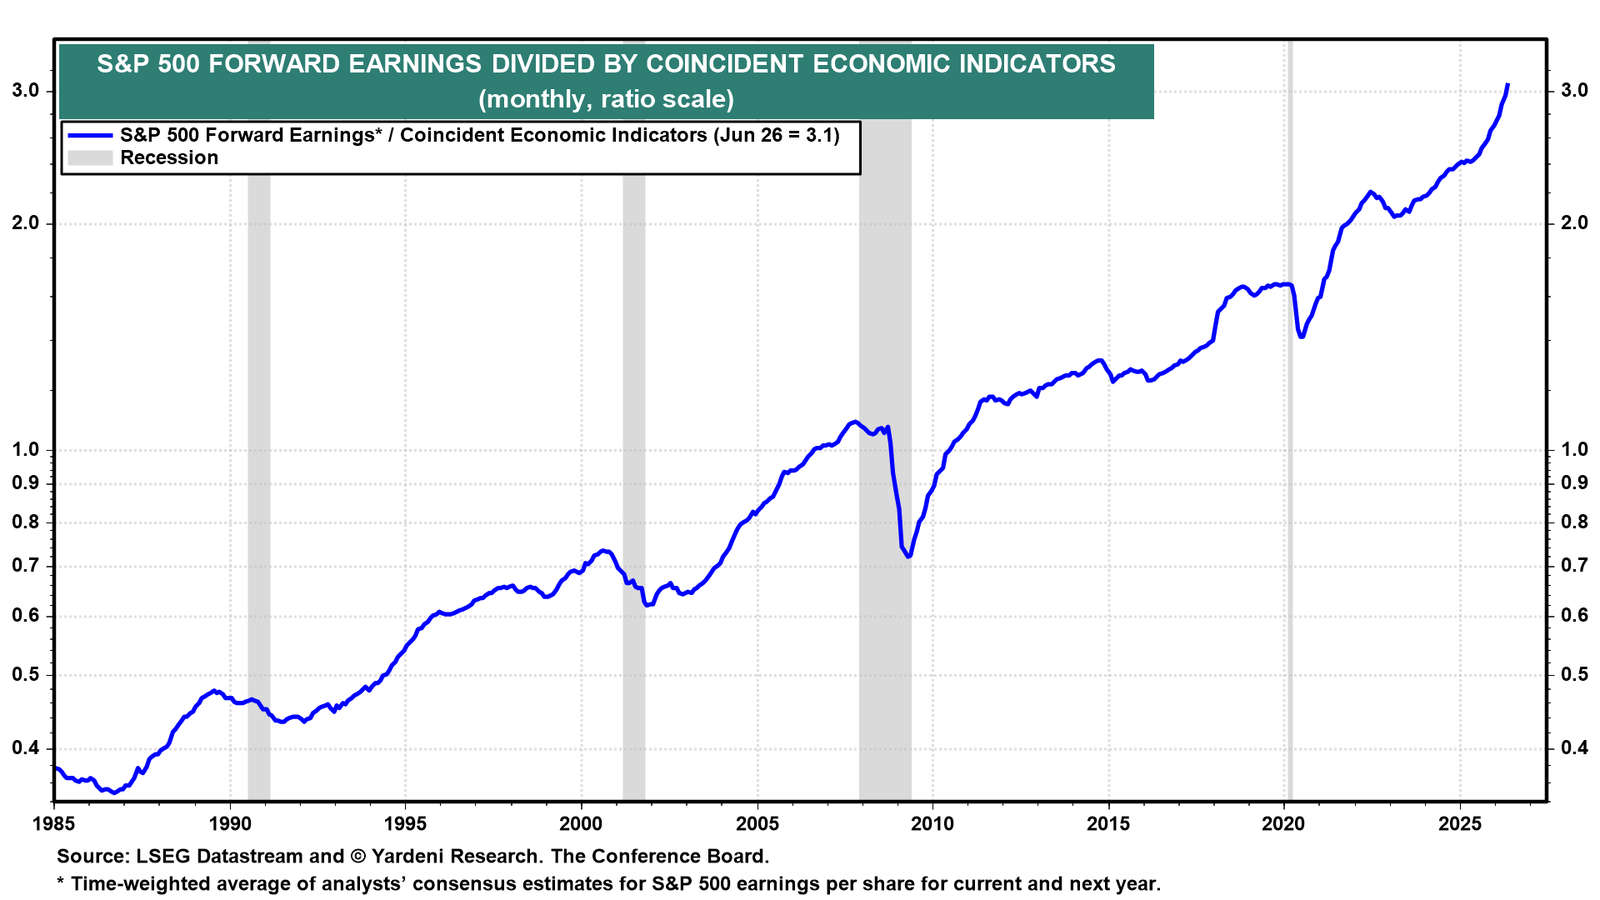
That is why S&P 500 forward earnings is a better leading indicator of the real economy than the CEI, in our opinion, especially recently (chart).
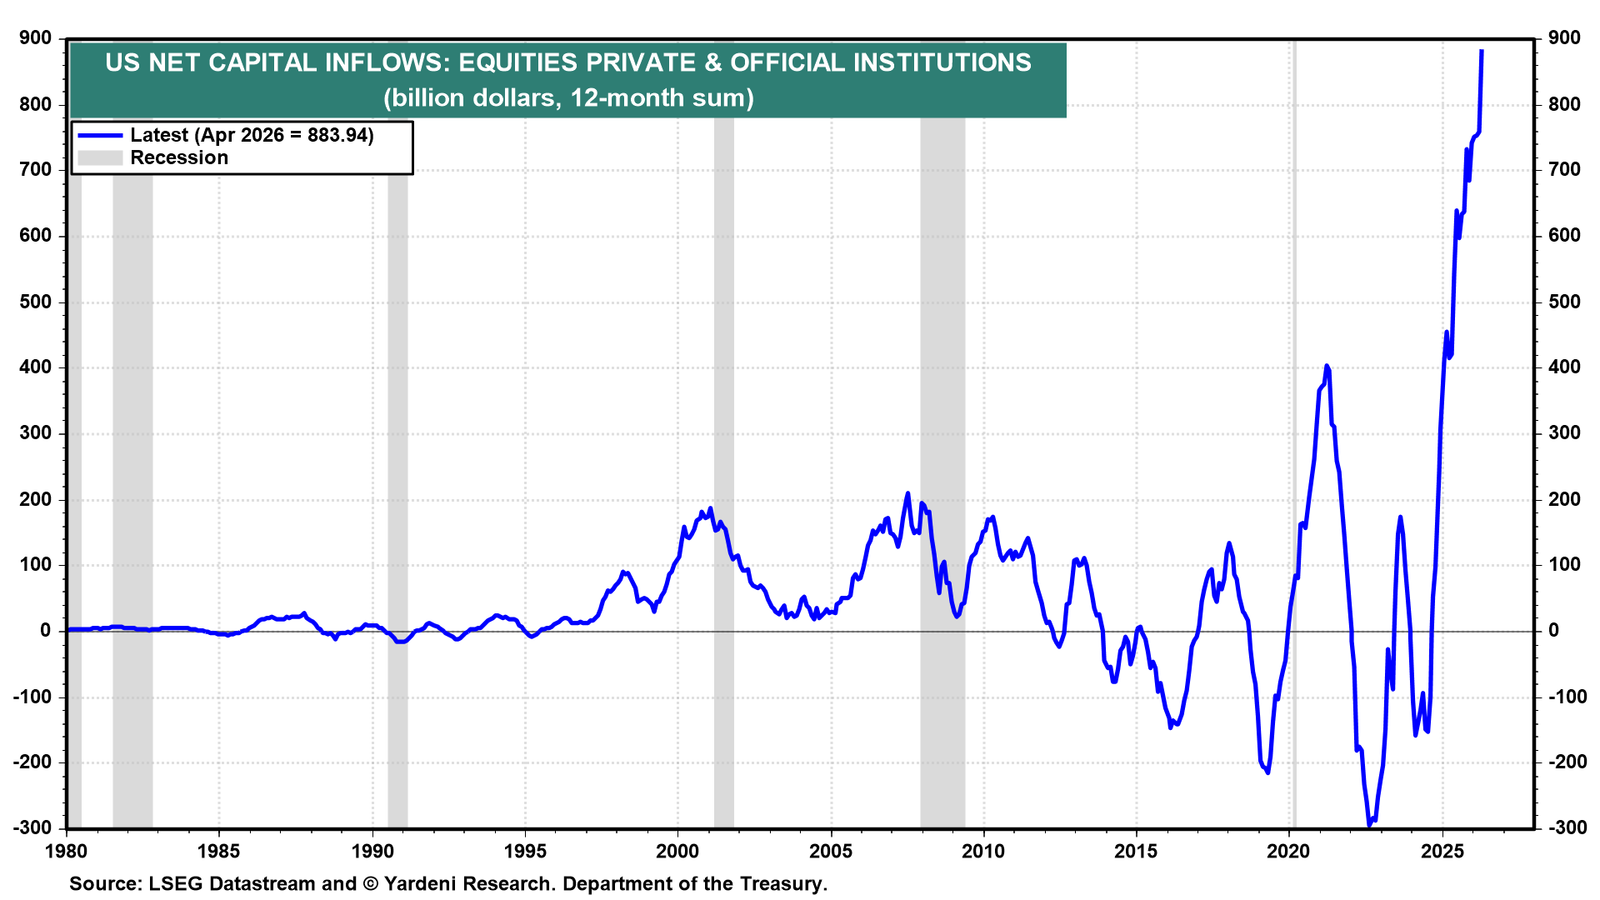
(2) Treasury International Capital System. Just as domestic investors are following FEMO's lead, so too are foreign investors. Net capital inflows into US equities from private and official institutions reached a record $883.9 billion over the past 12 months through April (chart).
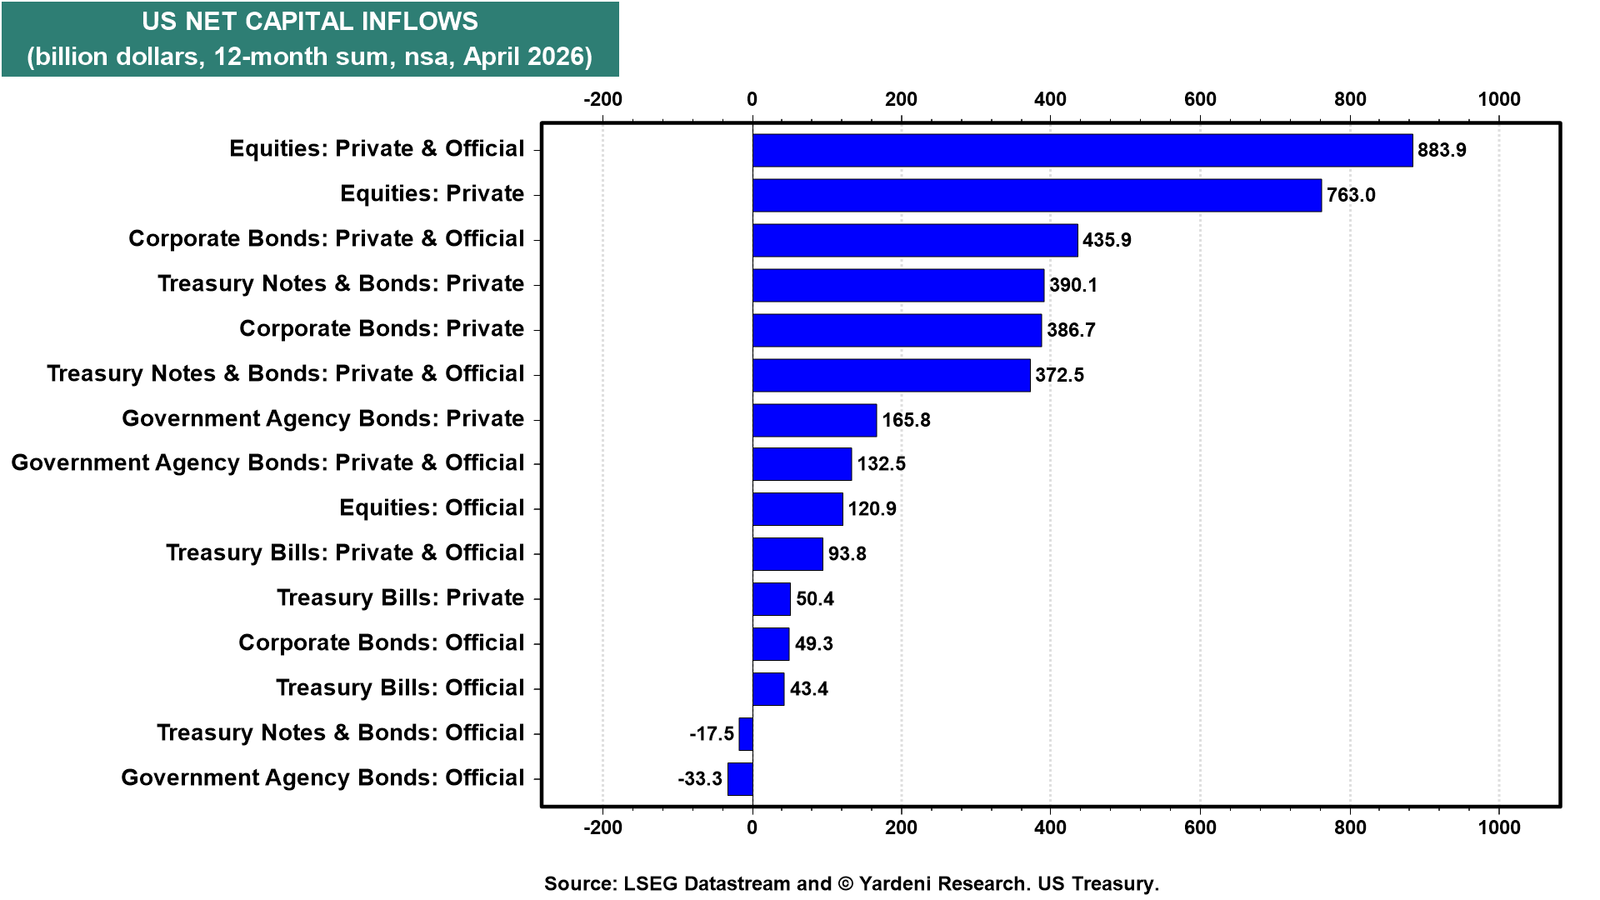
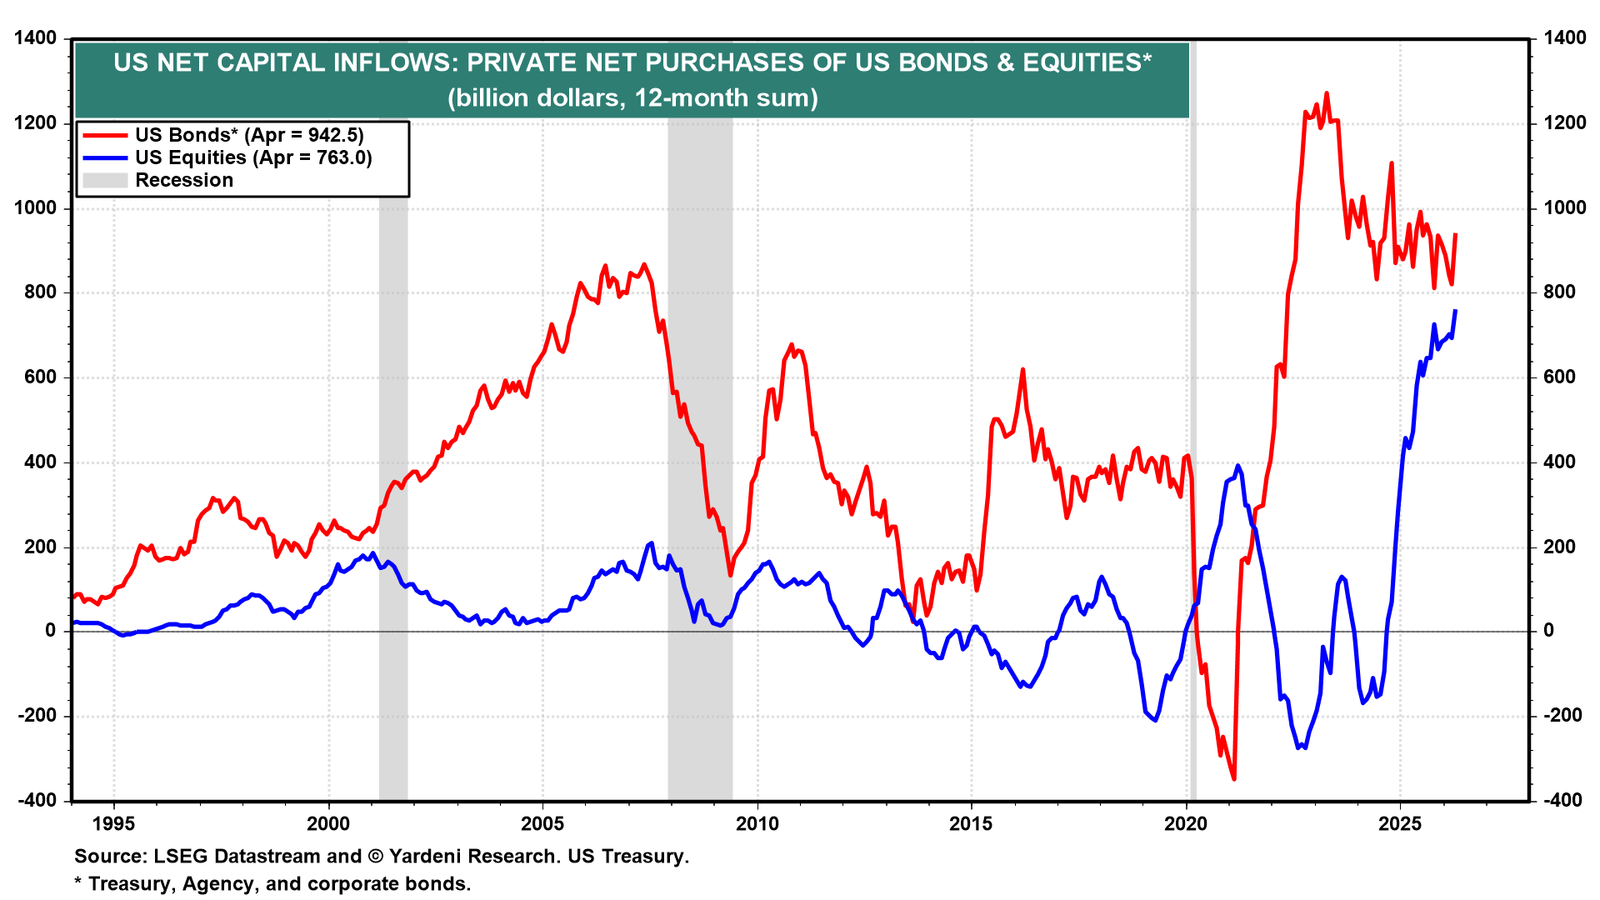
Private foreign investors purchased a record $763.0 billion in US equities over the same period (chart). Purchases of US bonds, including Treasuries and corporate debt, added an additional $942.5 billion to net capital inflows.
Net capital inflows into US equities from private and official institutions have surged to $883.9 billion, a record high that dwarfs anything seen in prior cycles and reflects the sheer scale of foreign conviction in the American earnings story (chart).
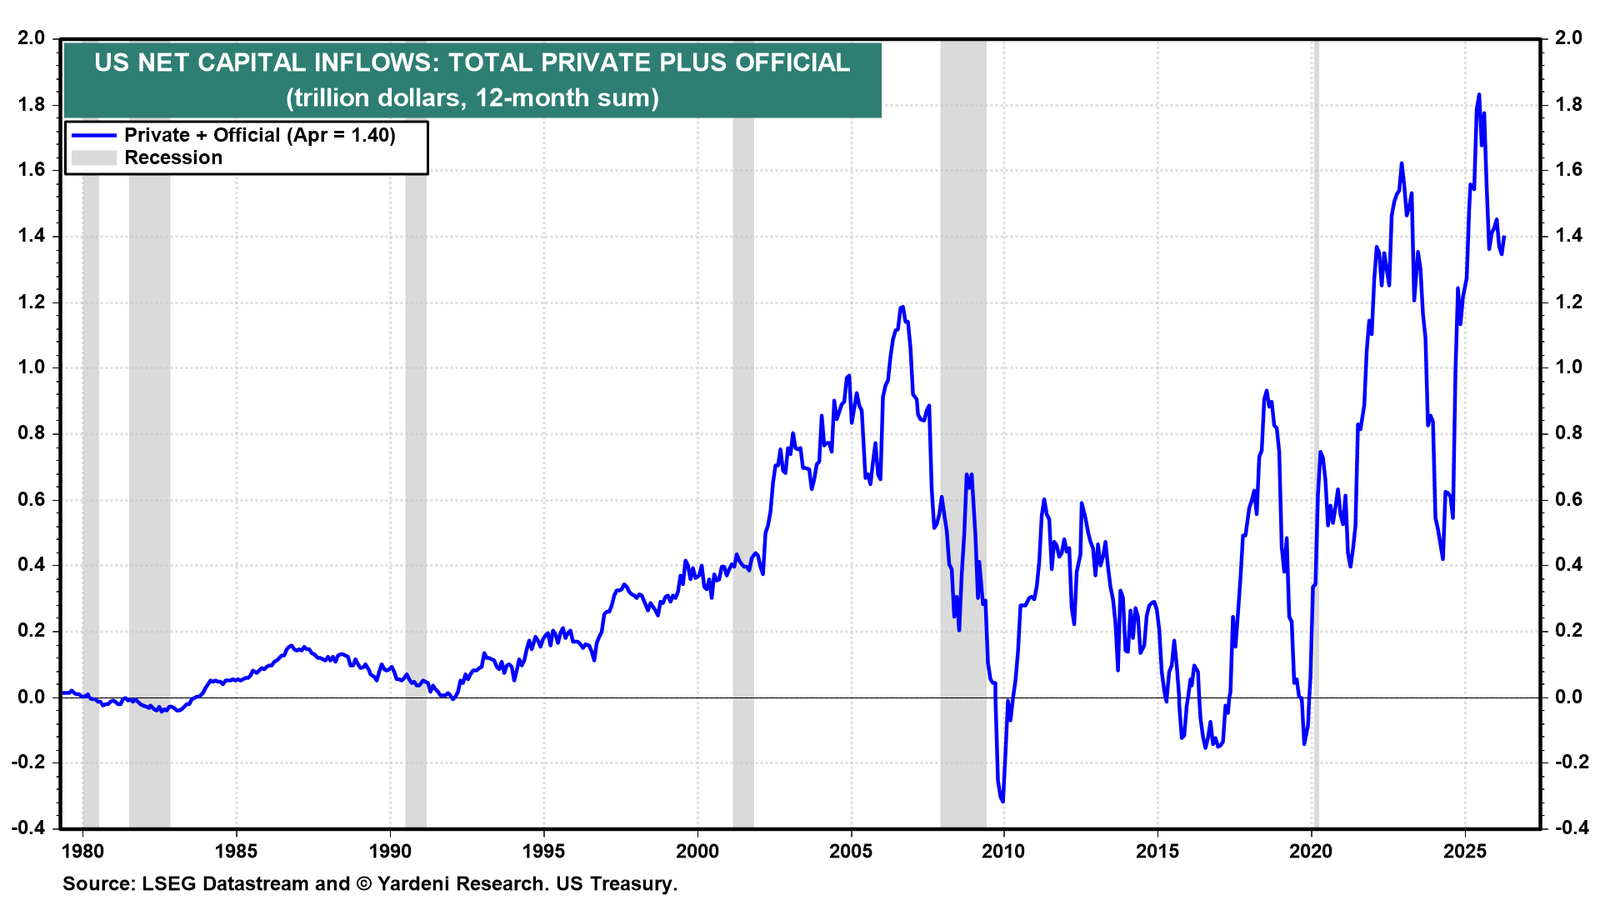
Total net capital inflows from private and official sources combined to $1.40 trillion over the past 12 months through April (chart). Foreigners have been buying US securities, not selling them as the sell-America naysayers have claimed.