We are downgrading emerging markets to market weight, not because the Go Global thesis is broken but because four separate short-term headwinds are converging at once: (1) The price of oil is back above $80 a barrel as the IRGC keeps the Strait of Hormuz contested. (2) The FOMC is hawkish. With inflation still sticky and a solid labor market, financial markets are currently pricing in one rate hike before the end of this year. (3) That's boosting the dollar. (4) AI fatigue is showing up in South Korea and Taiwan.
None of these reverse the multi-year case for international equities. Valuations abroad are cheaper than in the US, and the structural rotation away from decades of US stock market leadership is intact.
Let's look further:
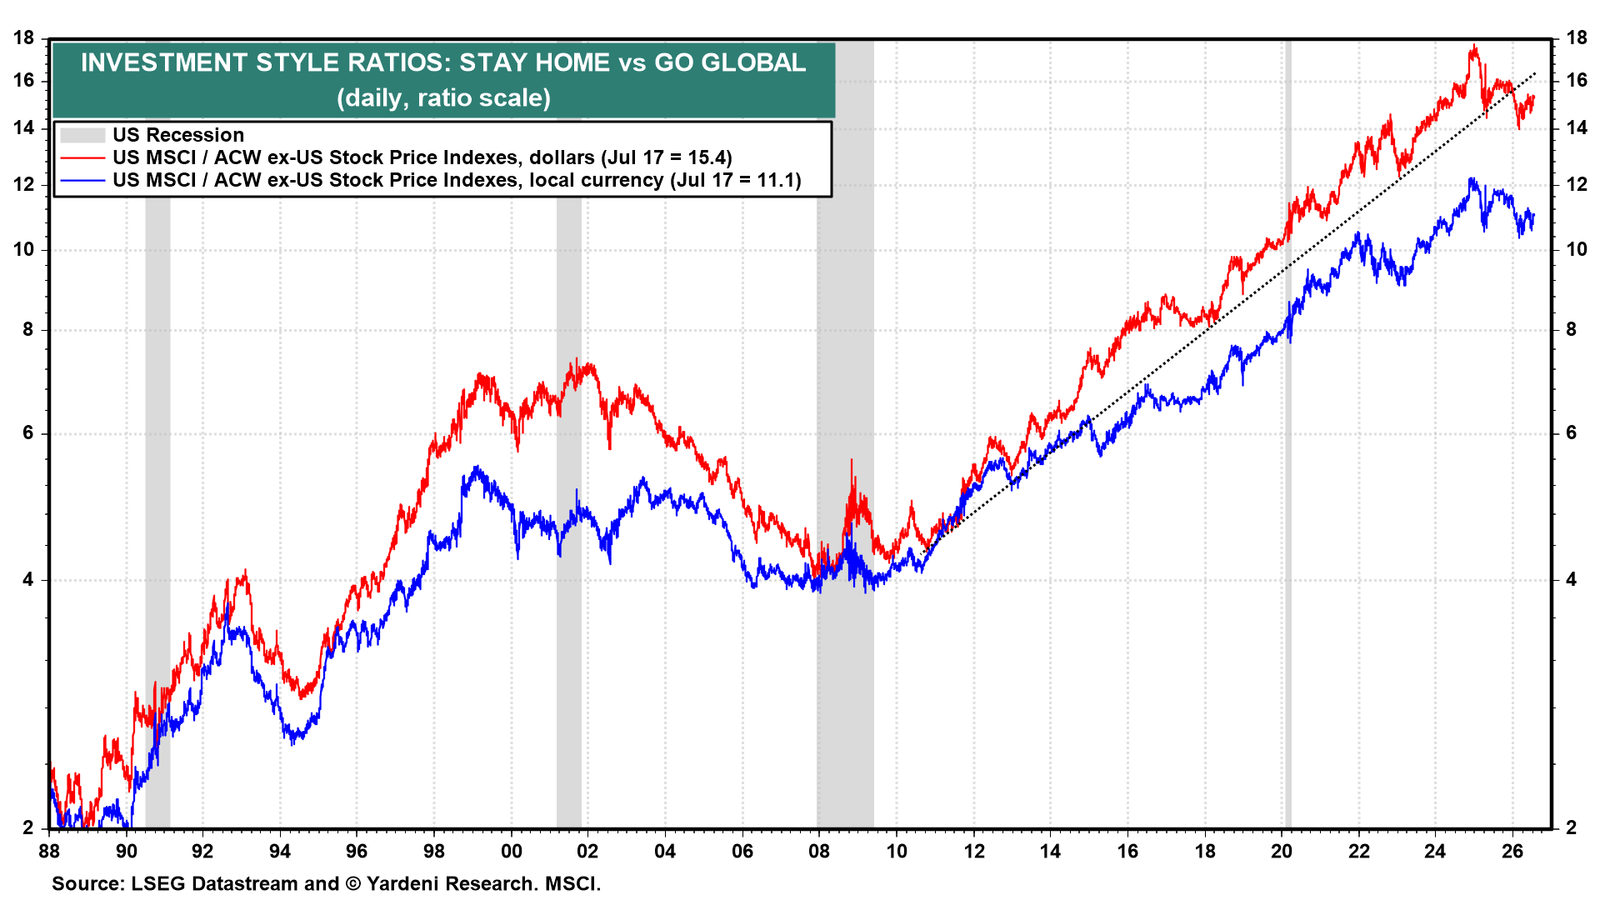
(1) Stay Home vs Go Global. The price ratios between these two long-run investment styles representing the US stock market (Stay Home) and the rest of the world’s stock markets (Go Global) remain below their early 2025 peaks in both dollar and local currency terms (chart). They are also still below their long-term uptrends from 2010 through early 2025, and on short-term downtrends since then.
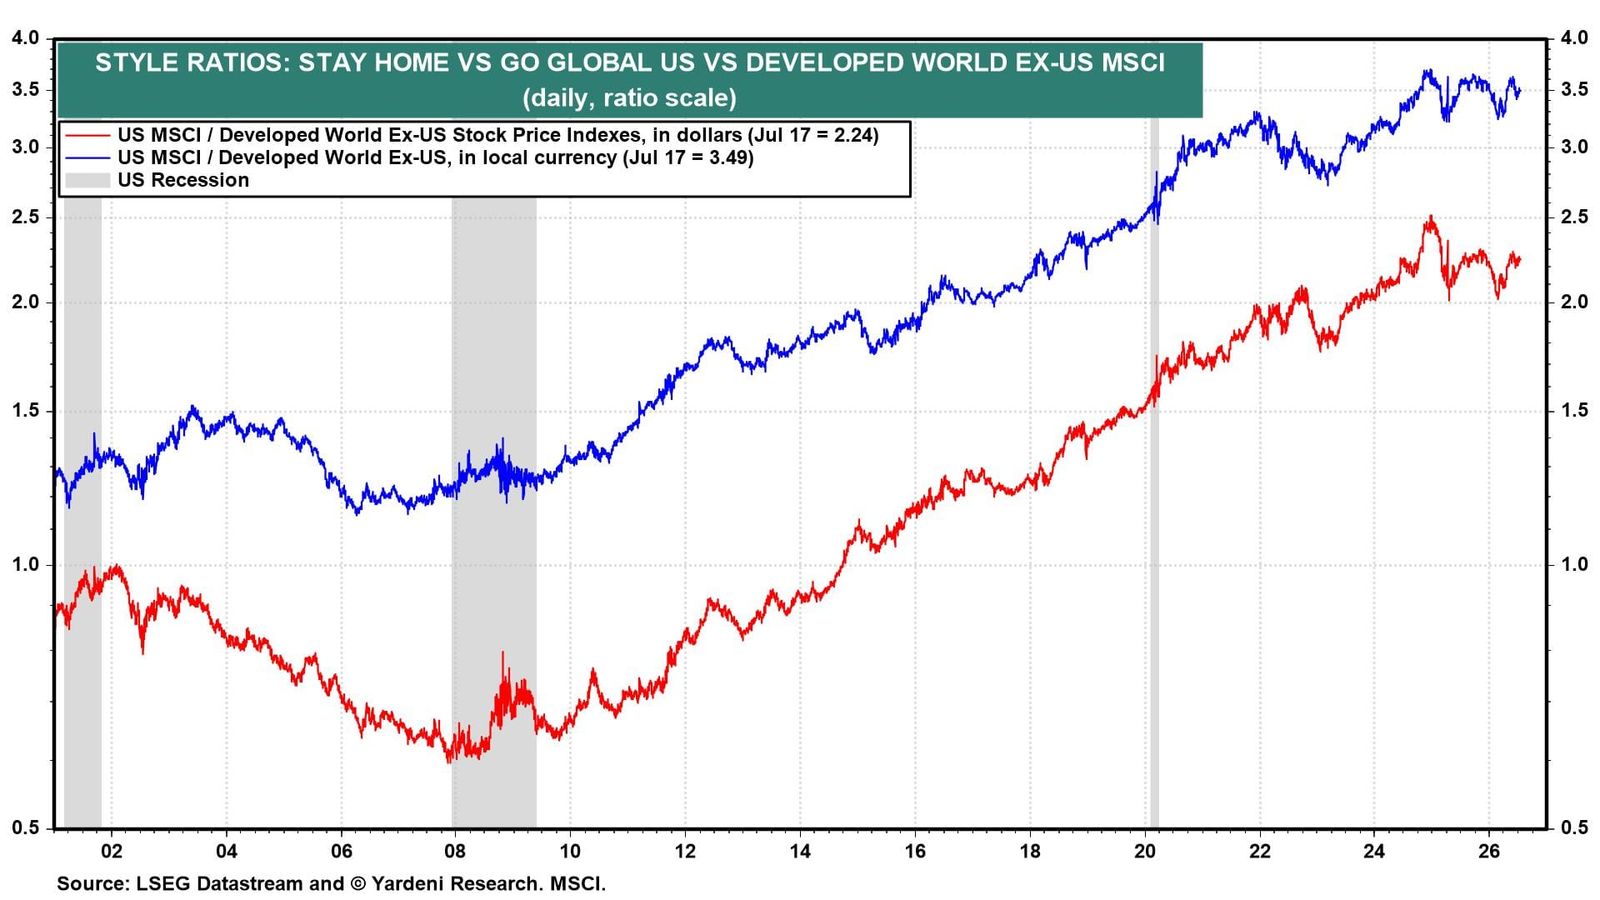
Since early 2025, stock markets in the US and other developed economies have kept pace with each other (chart). From 2010 through early 2025, the US market outperformed.
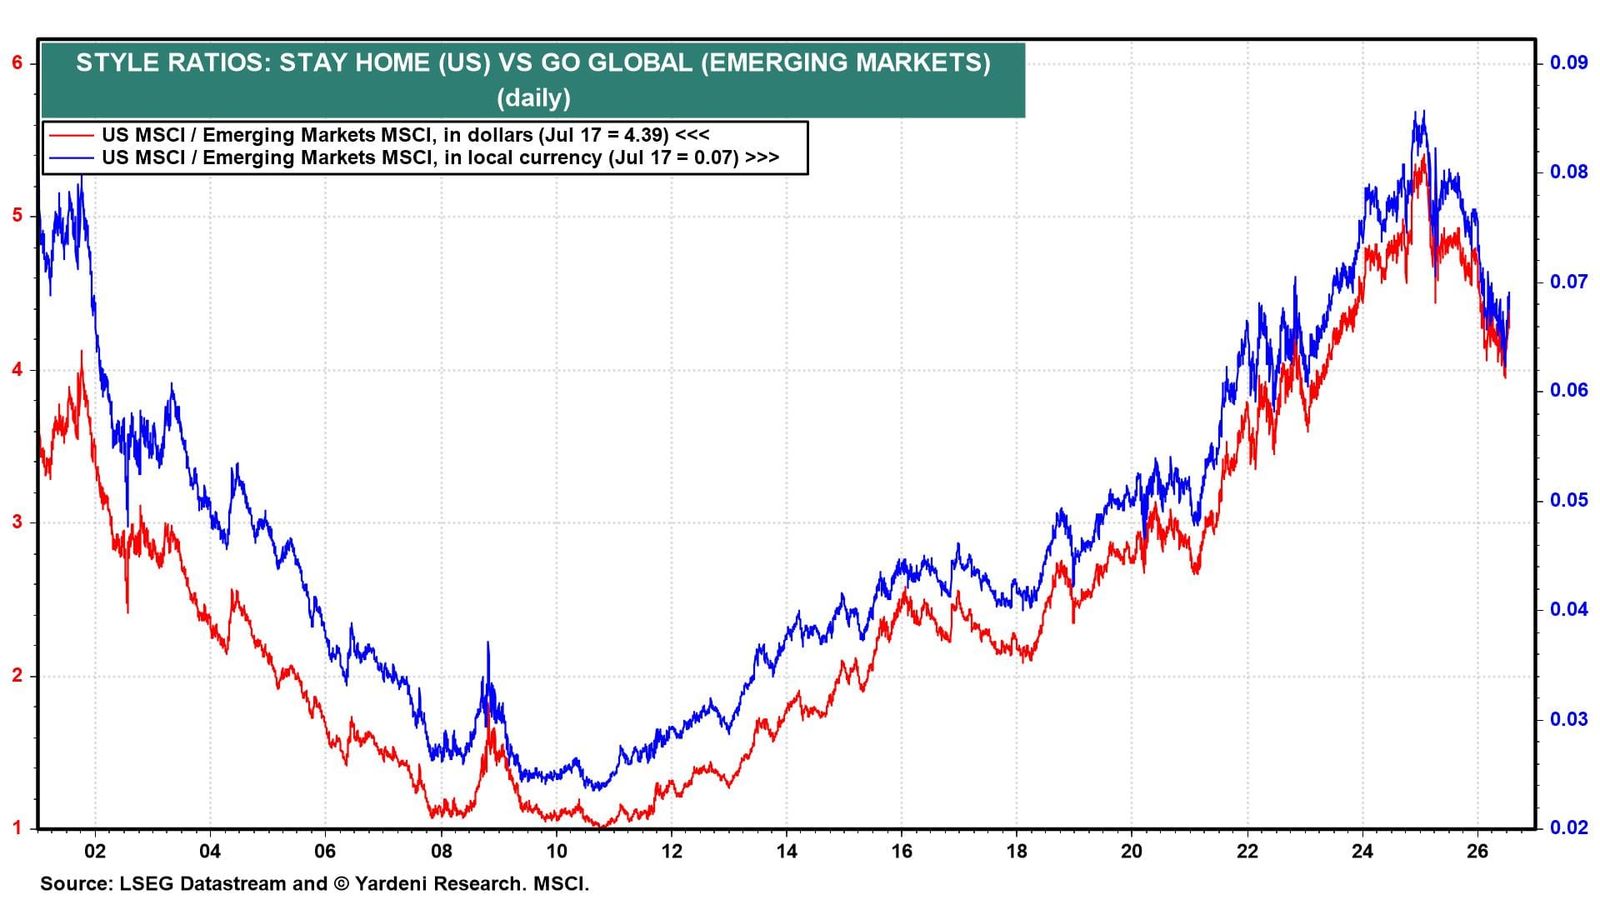
The ratios of the US versus emerging markets show the latter outperforming the former since early 2025 after underperforming since 2010 (chart). The downturn in the ratios since early 2025 was largely attributable to the AI-fueled booms in South Korea and Taiwan.
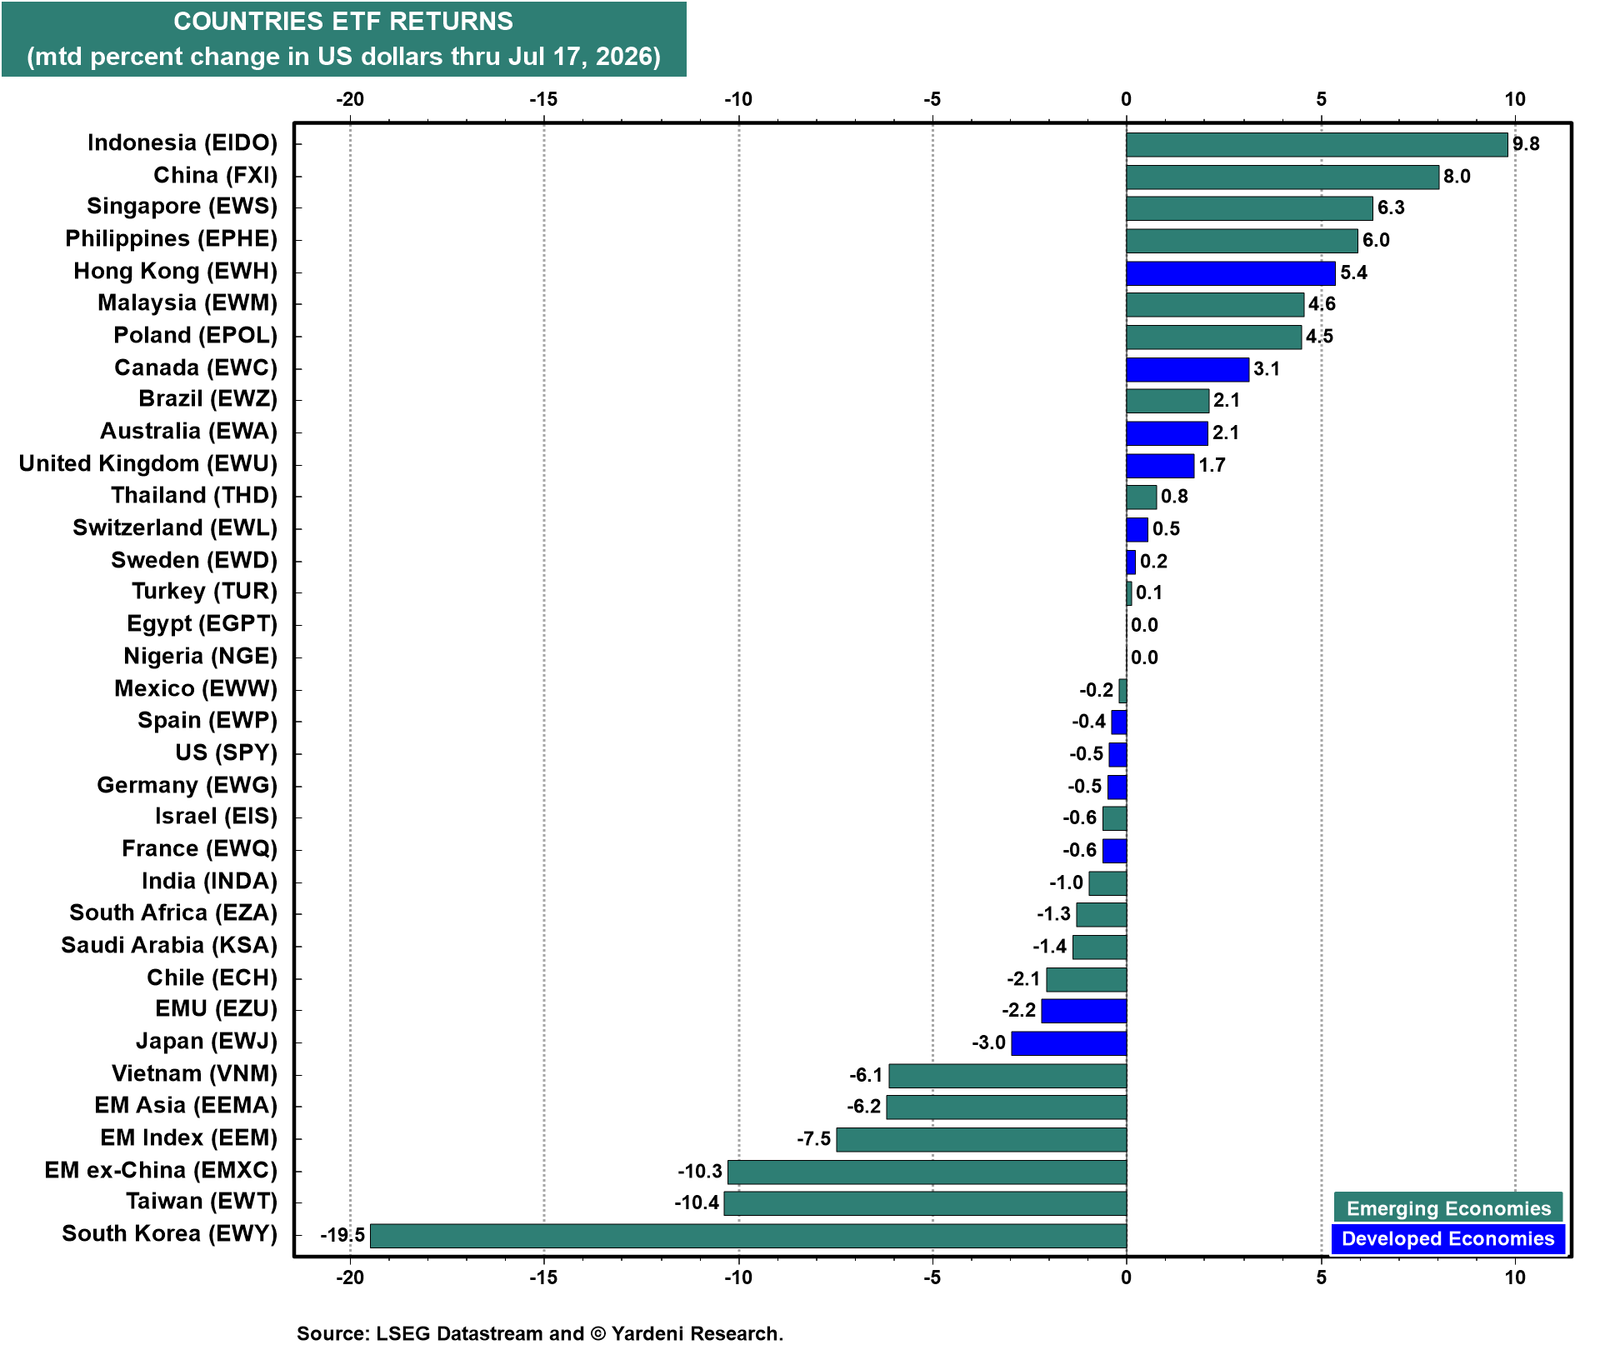
There has been quite a bit of rotation in leadership so far in July. The countries that led the broader 2026 rally, South Korea and Taiwan, are the worst performers this month to date, down 19.5% and 10.4% respectively (chart). China and Indonesia are at the top of the leaderboard this month, with gains of 8.0% and 9.8%, respectively. The US is in the middle of the pack.
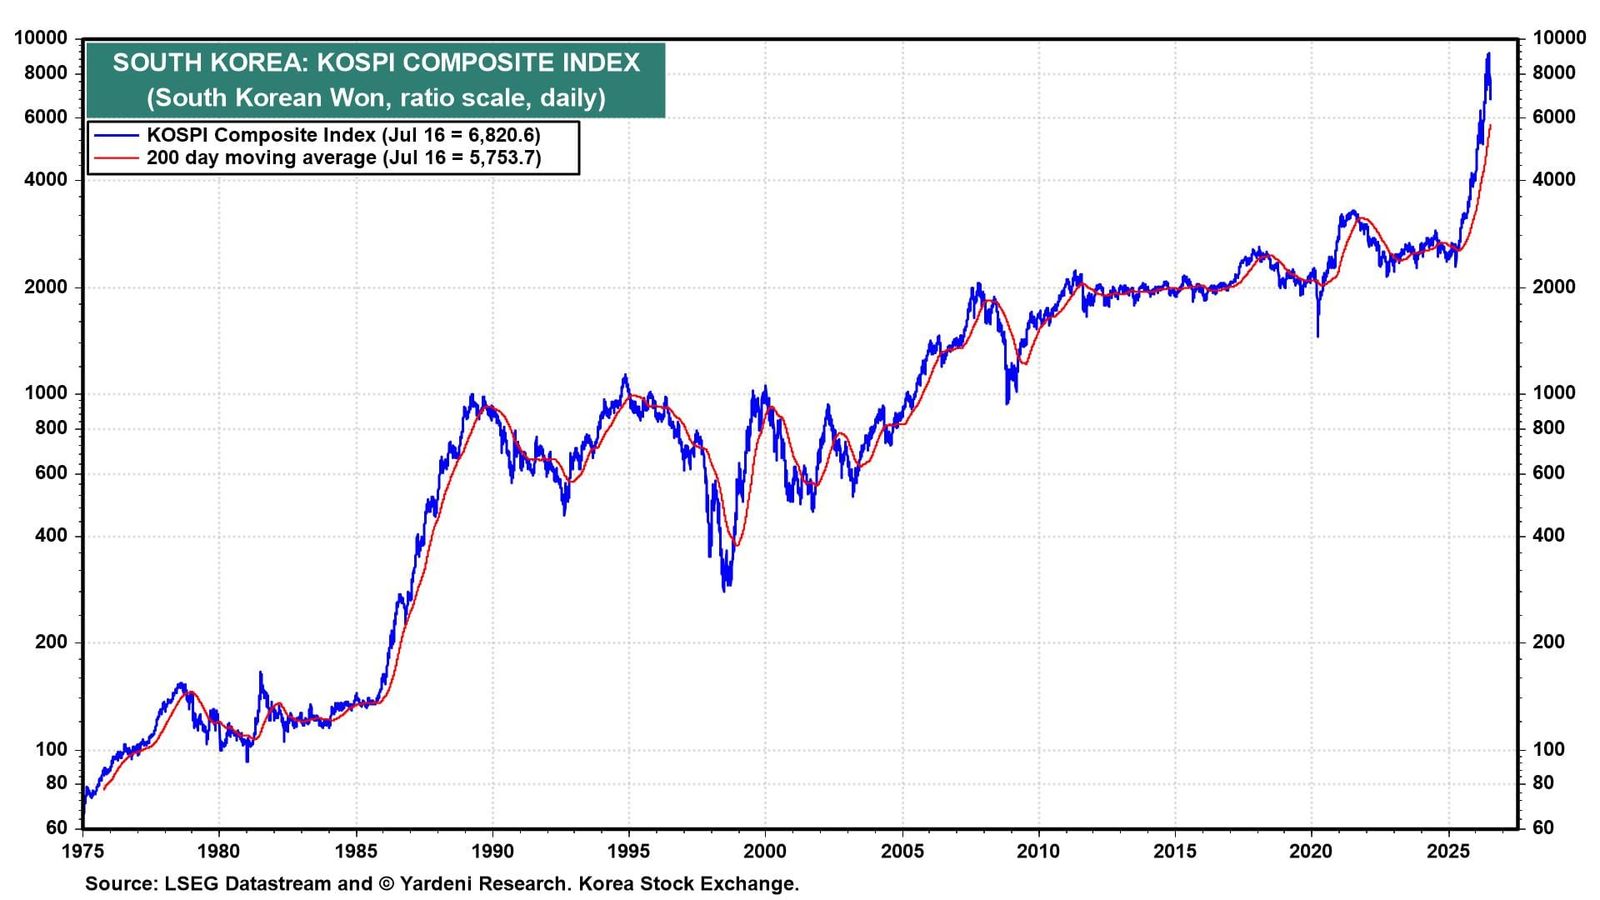
(2) South Korea & Taiwan. South Korea's KOSPI is concentrated in two companies: Samsung Electronics and SK Hynix. Leveraged ETFs tied to each stock launched only in May and attracted a flood of retail money, sending the KOSPI soaring (chart). When these stocks turned down, margin calls cascaded, forcing brokerages to liquidate roughly 426 billion won in positions over the first 10 trading days of July alone. The minimum margin deposit was tripled, and purchases per trade were capped. The Bank of Korea hiked to 2.75%, its first move since January 2023, targeting a won near 17-year lows and inflation above 3% y/y.
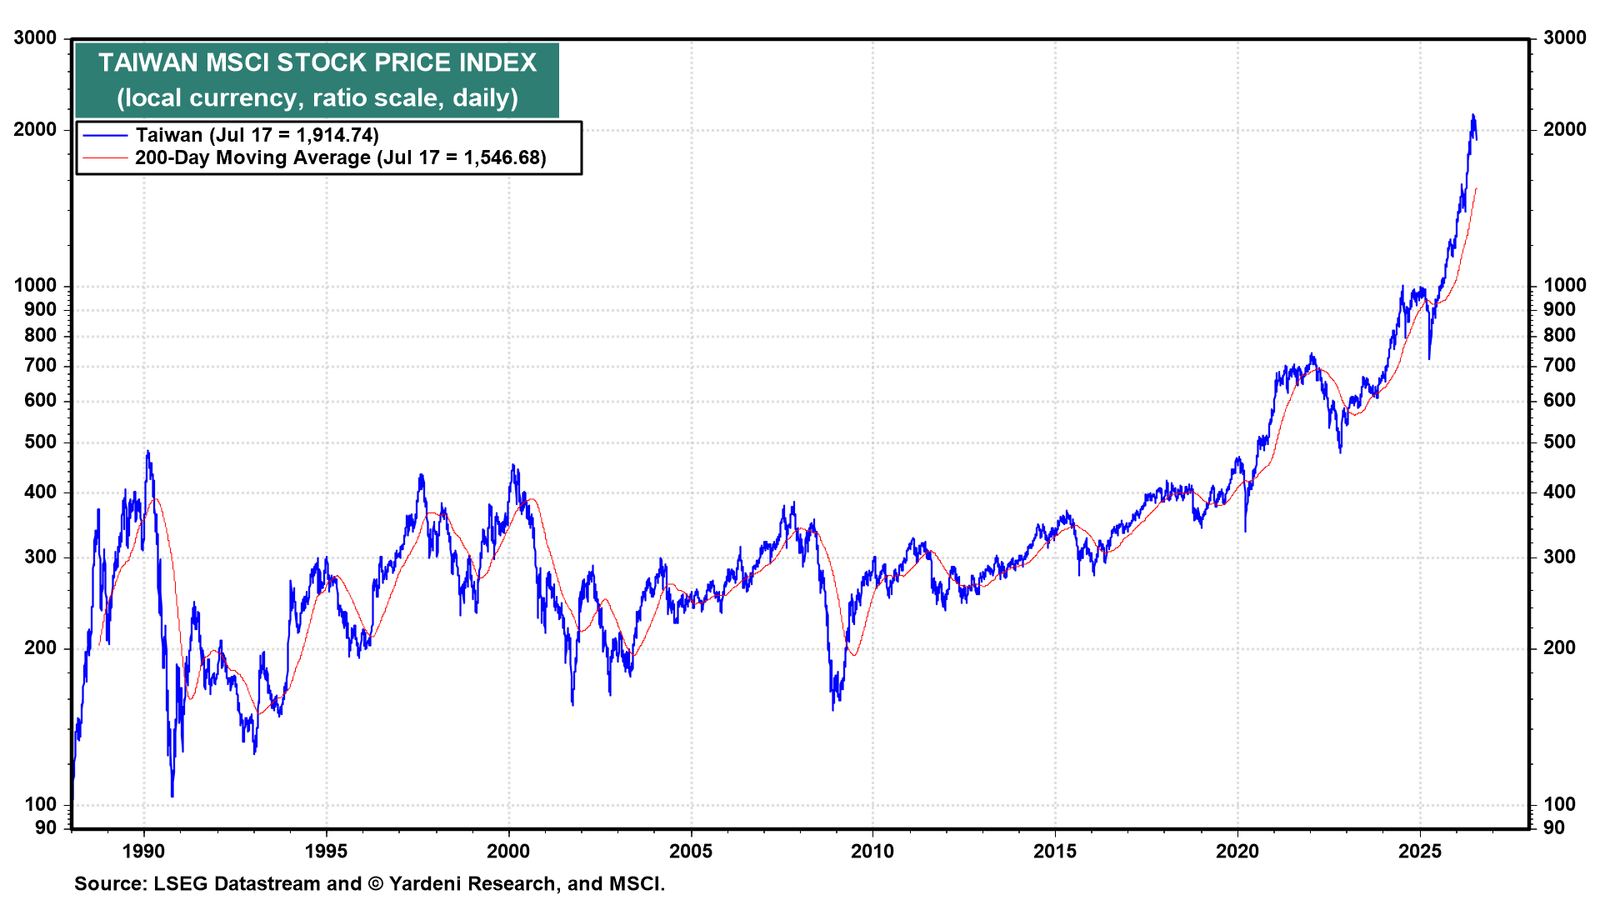
Taiwan has been a calmer version of the same AI trade. Its MSCI index is about 24% above its 200-day moving average, elevated but without the leveraged retail mania or the sharp reversal that hit South Korea (chart). The move remains orderly, a reminder that concentration risk and leverage, not AI exposure itself, drove South Korea's whipsaw.
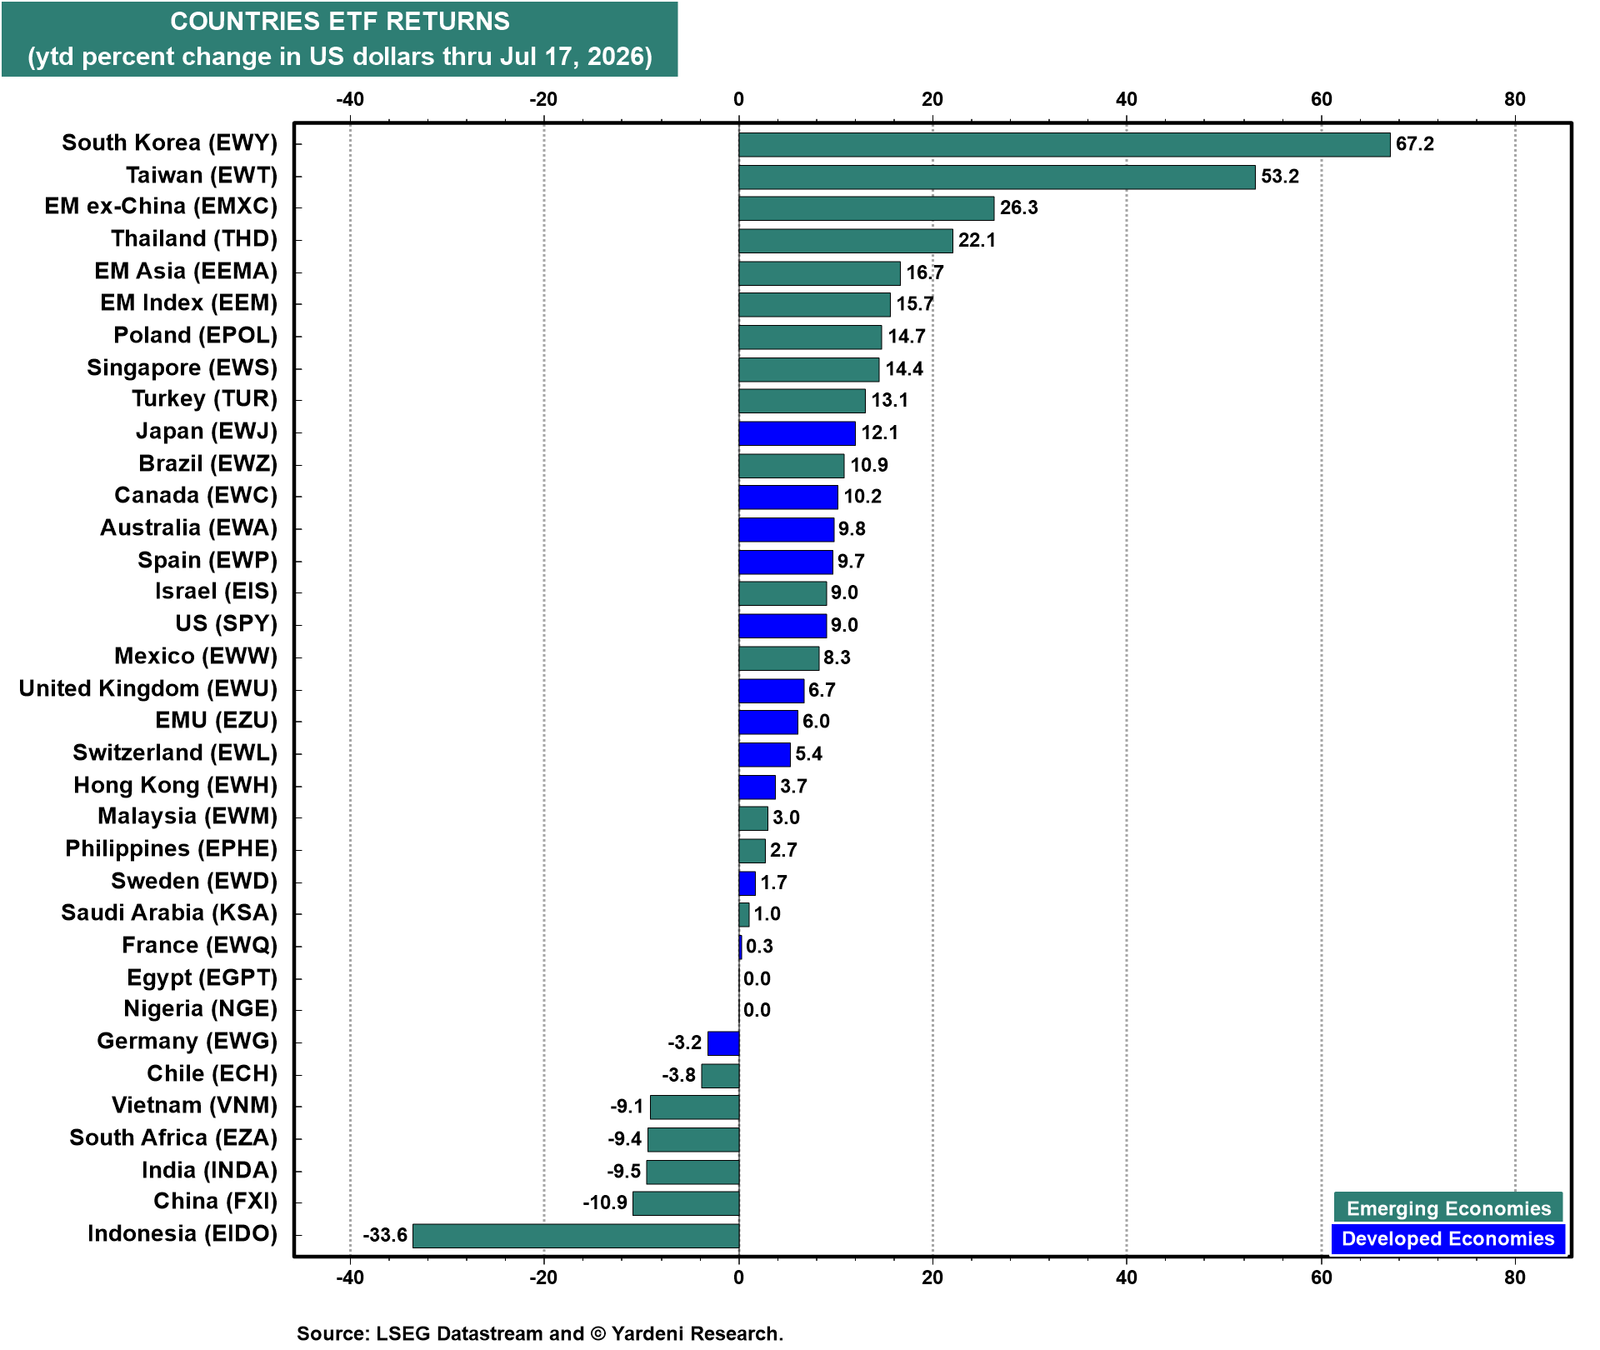
The South Korea and Taiwan ETFs are still up the most of any country ytd, at 67.2% and 53.2% in US dollar terms, respectively, significantly ahead of any other nation's ETF (chart).
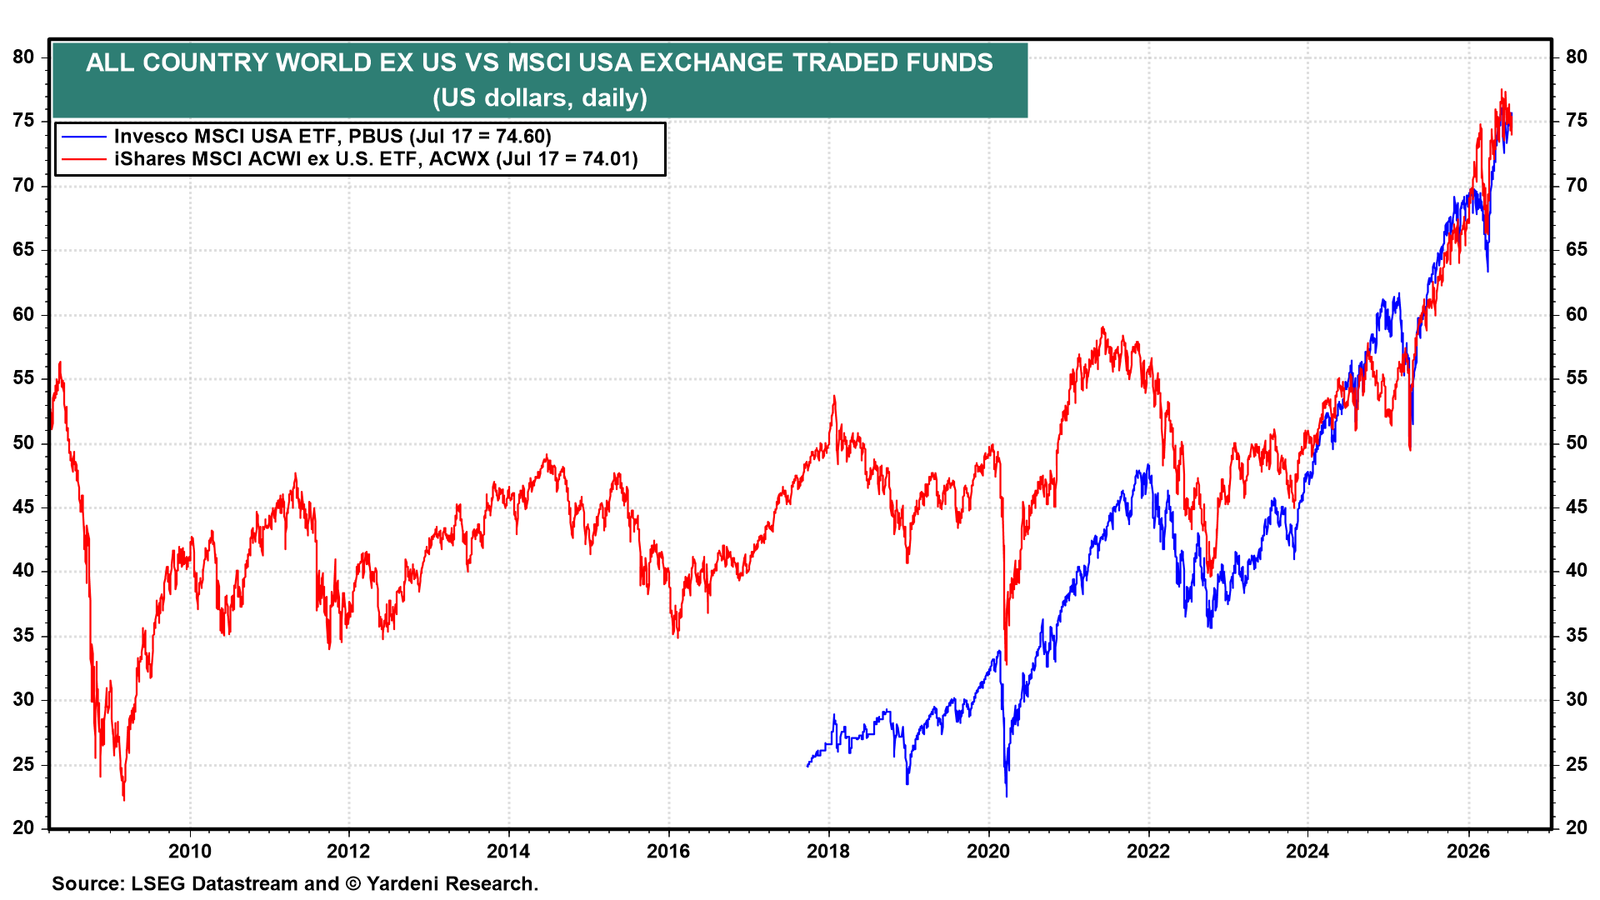
(3) ETFs. PBUS and ACWX, our US versus ex-US proxies, remain locked together near record highs, confirming that the broad Go Global trade is intact (chart).
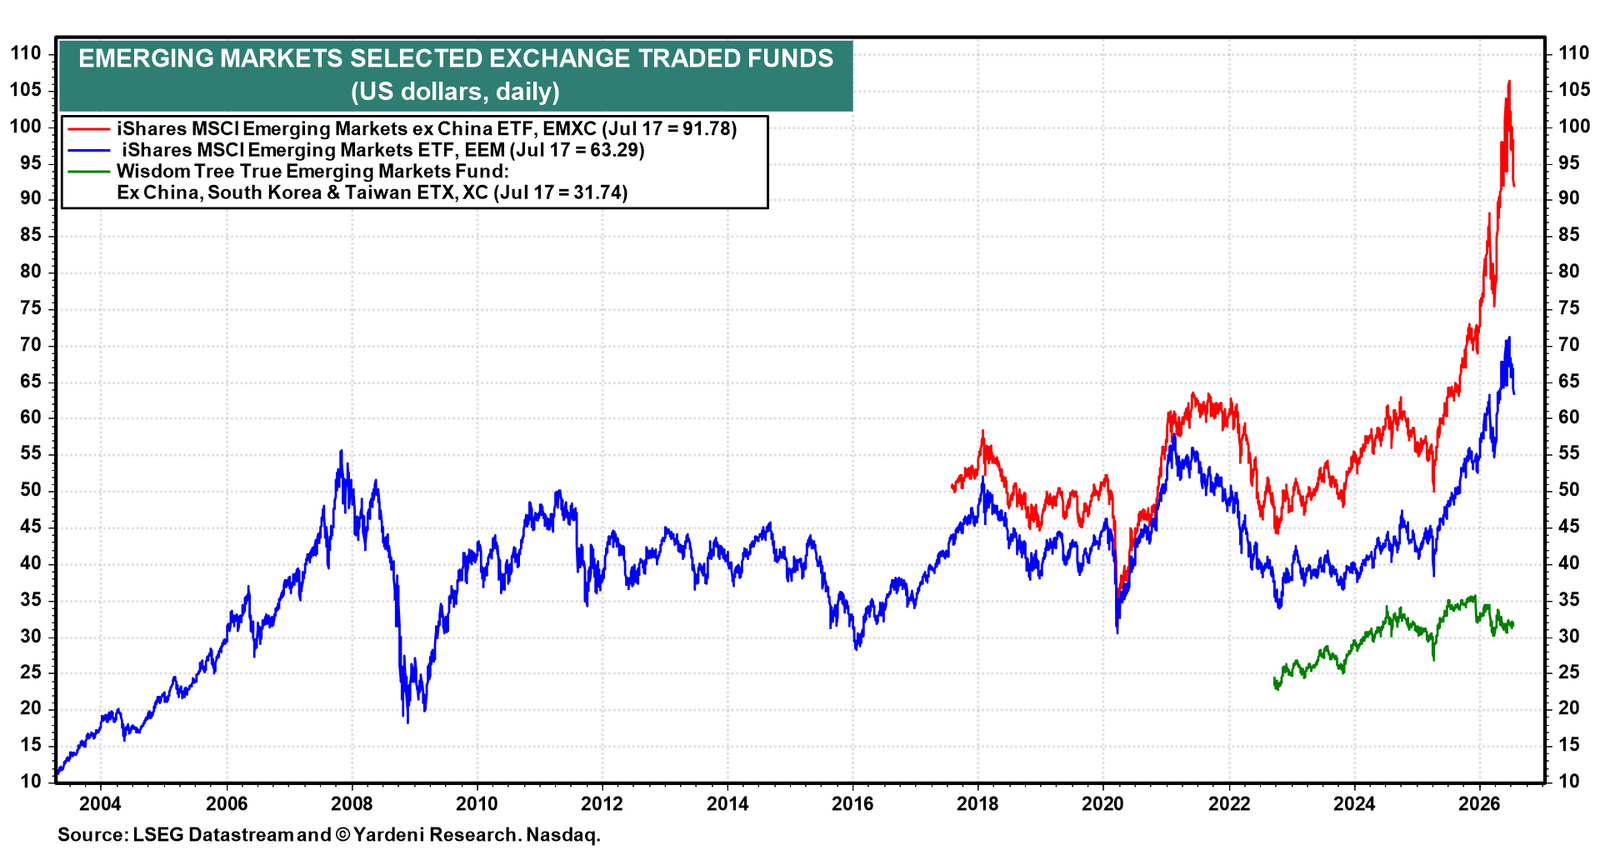
EMXC has been hit hard recently, unsurprisingly given its heavy exposure to South Korea and Taiwan. XC, which strips out those two markets entirely, trades at levels seen two years ago and continues to lag (chart).
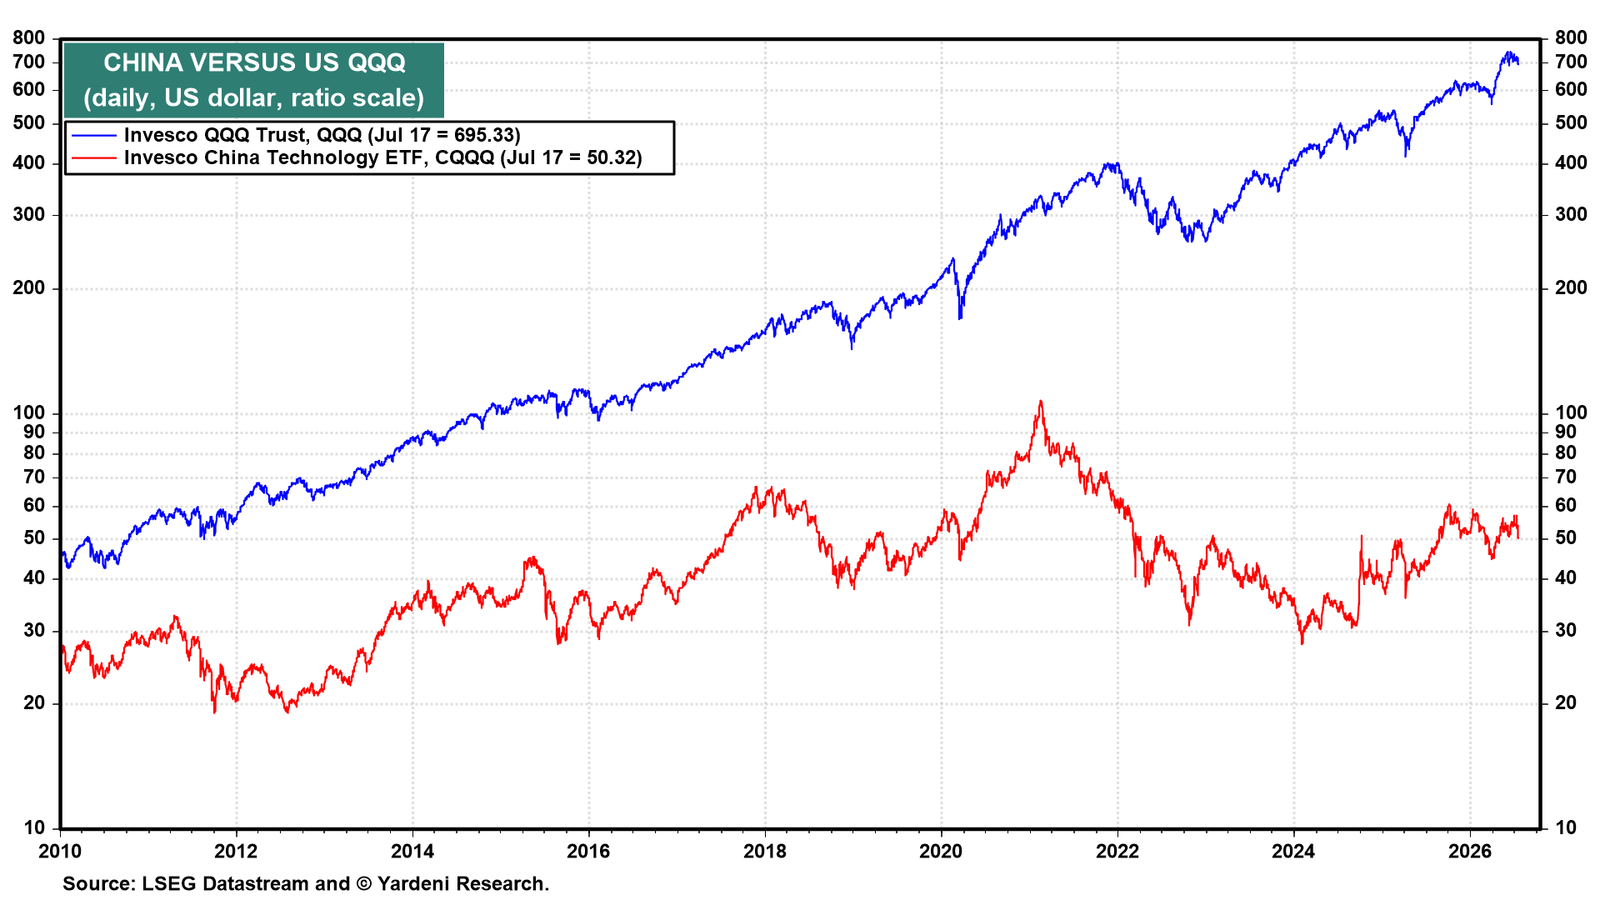
CQQQ has bounced off its 2026 low but remains a fraction of QQQ on any long horizon, a reminder that China tech hasn't joined the AI rally in the US or the ones in South Korea and Taiwan (chart).