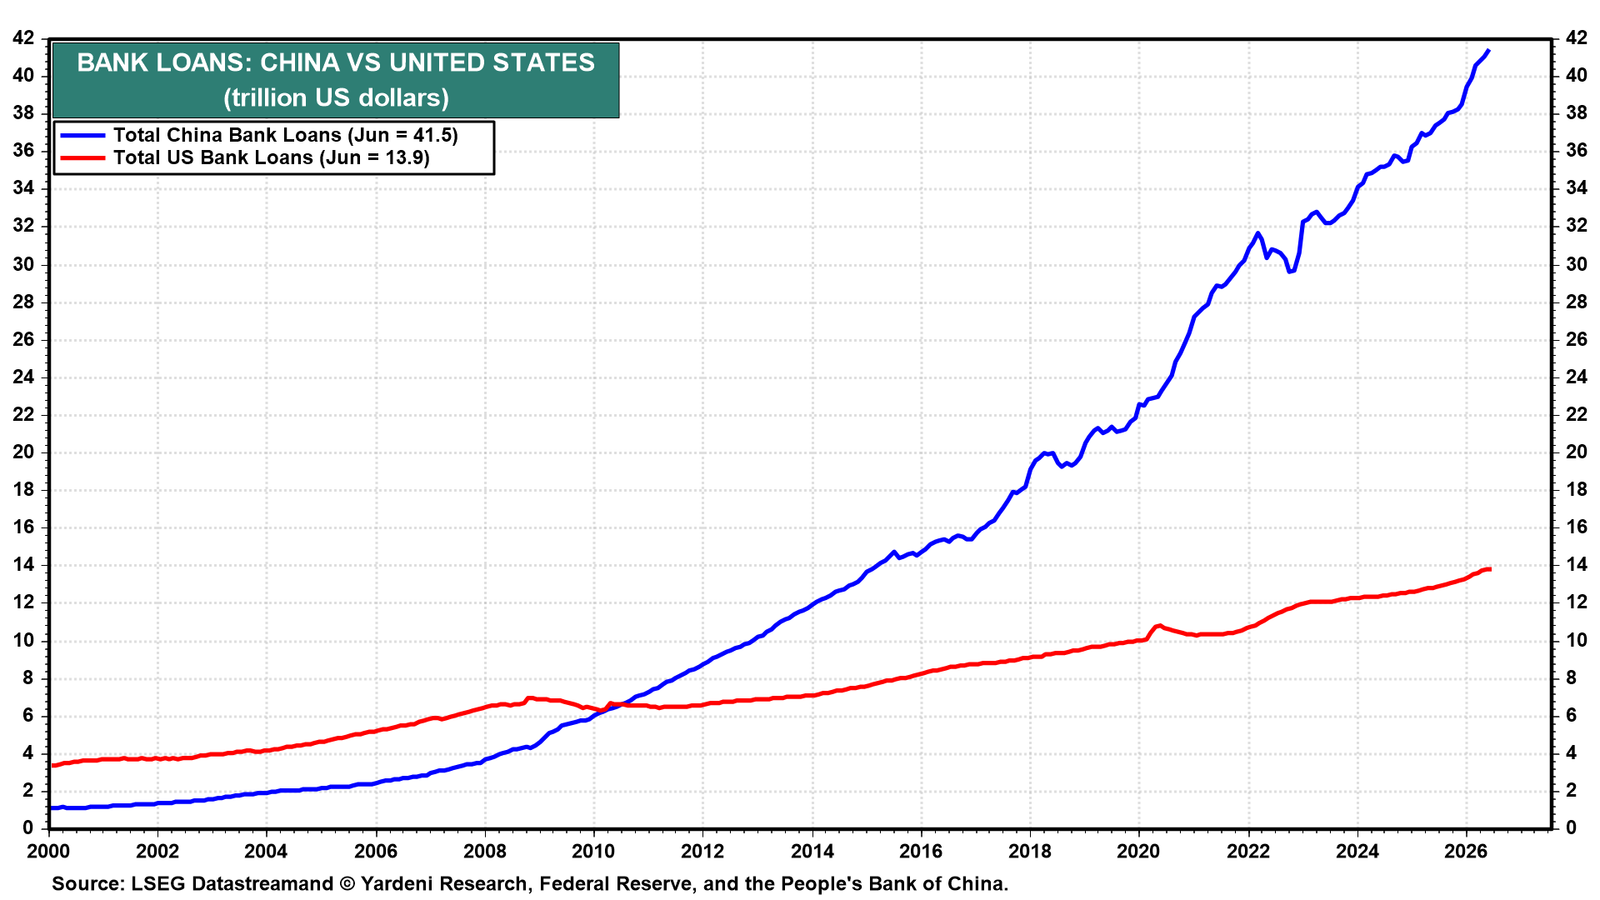
The re-escalation of the latest Gulf War pushed the price of Brent crude oil back up to $101.06 on Thursday. It was back down this evening as low as $86.58 after Iran reportedly said it would suspend attacks as long as the US does the same. Last week, rising oil prices were a headwind for the Go Global trade relative to Stay Home, because they fall harder on the oil-importing economies abroad than on the US, which exports oil. Hopefully, oil prices will be lower this week, providing a tailwind to Go Global. In any event, it seems that the plunge in China's June oil imports helps explain the rapid plunge in oil prices that month, when there was also a ceasefire (chart).
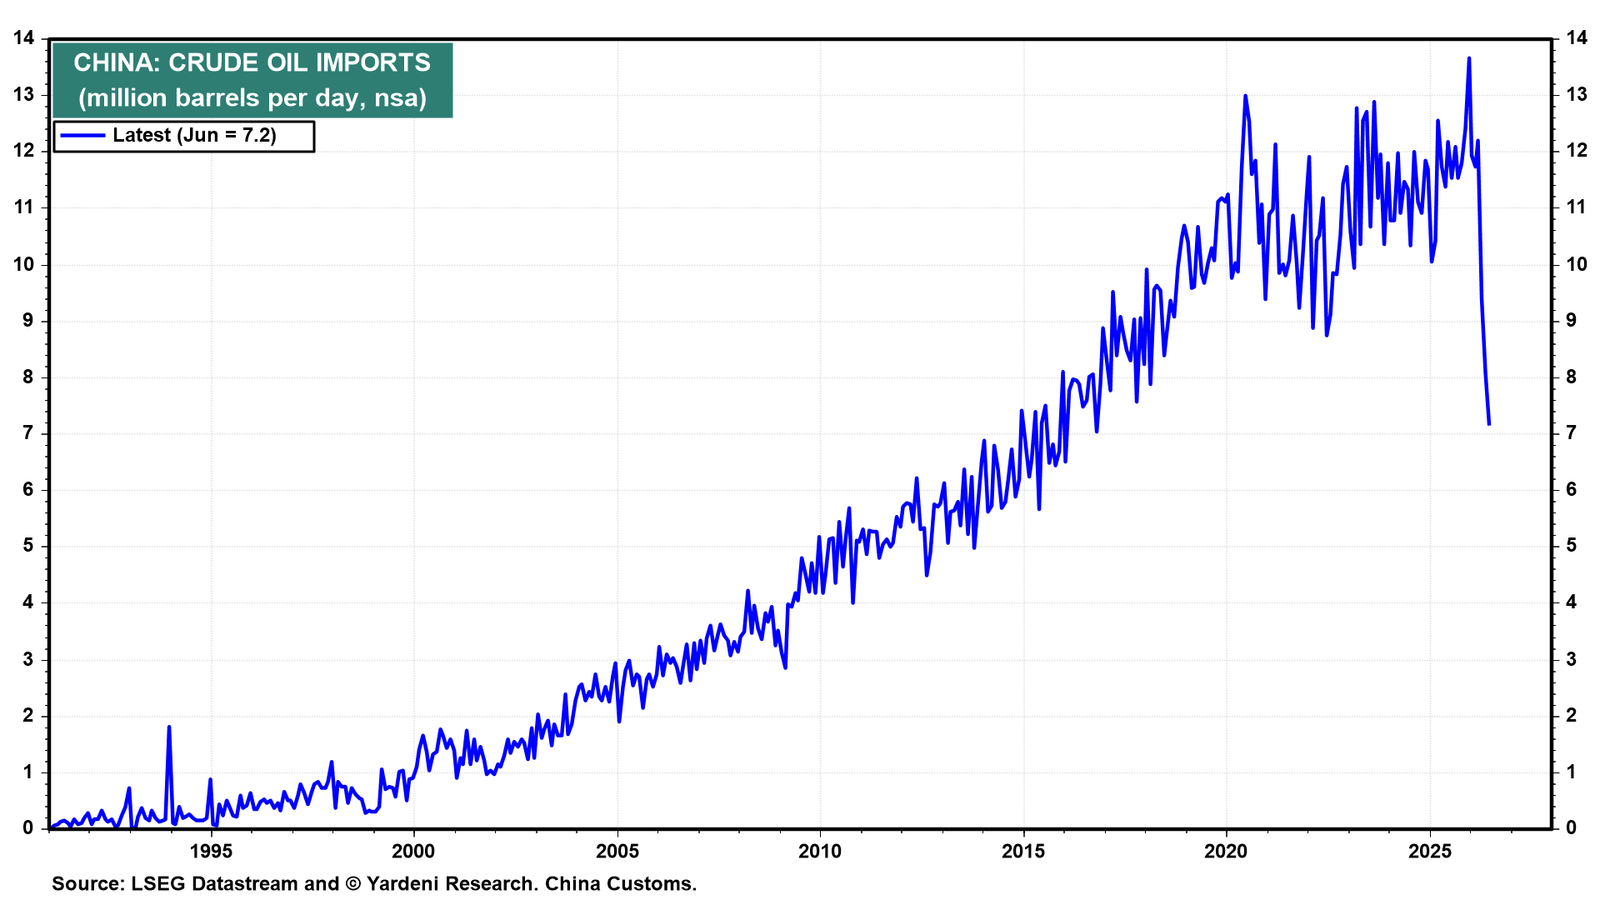
Global stock market leadership rotated sharply this month. The 2026 AI-related leaders, South Korea and Taiwan, are among the worst performers mtd, down 19.3% and 9.8% respectively (chart). China tops the leaderboard, up 9.5%, with Indonesia, Hong Kong, and Singapore close behind. Yet both Korea and Taiwan steadied this past week, up 0.3% and 0.7%, an early sign the sharp selloff is easing.
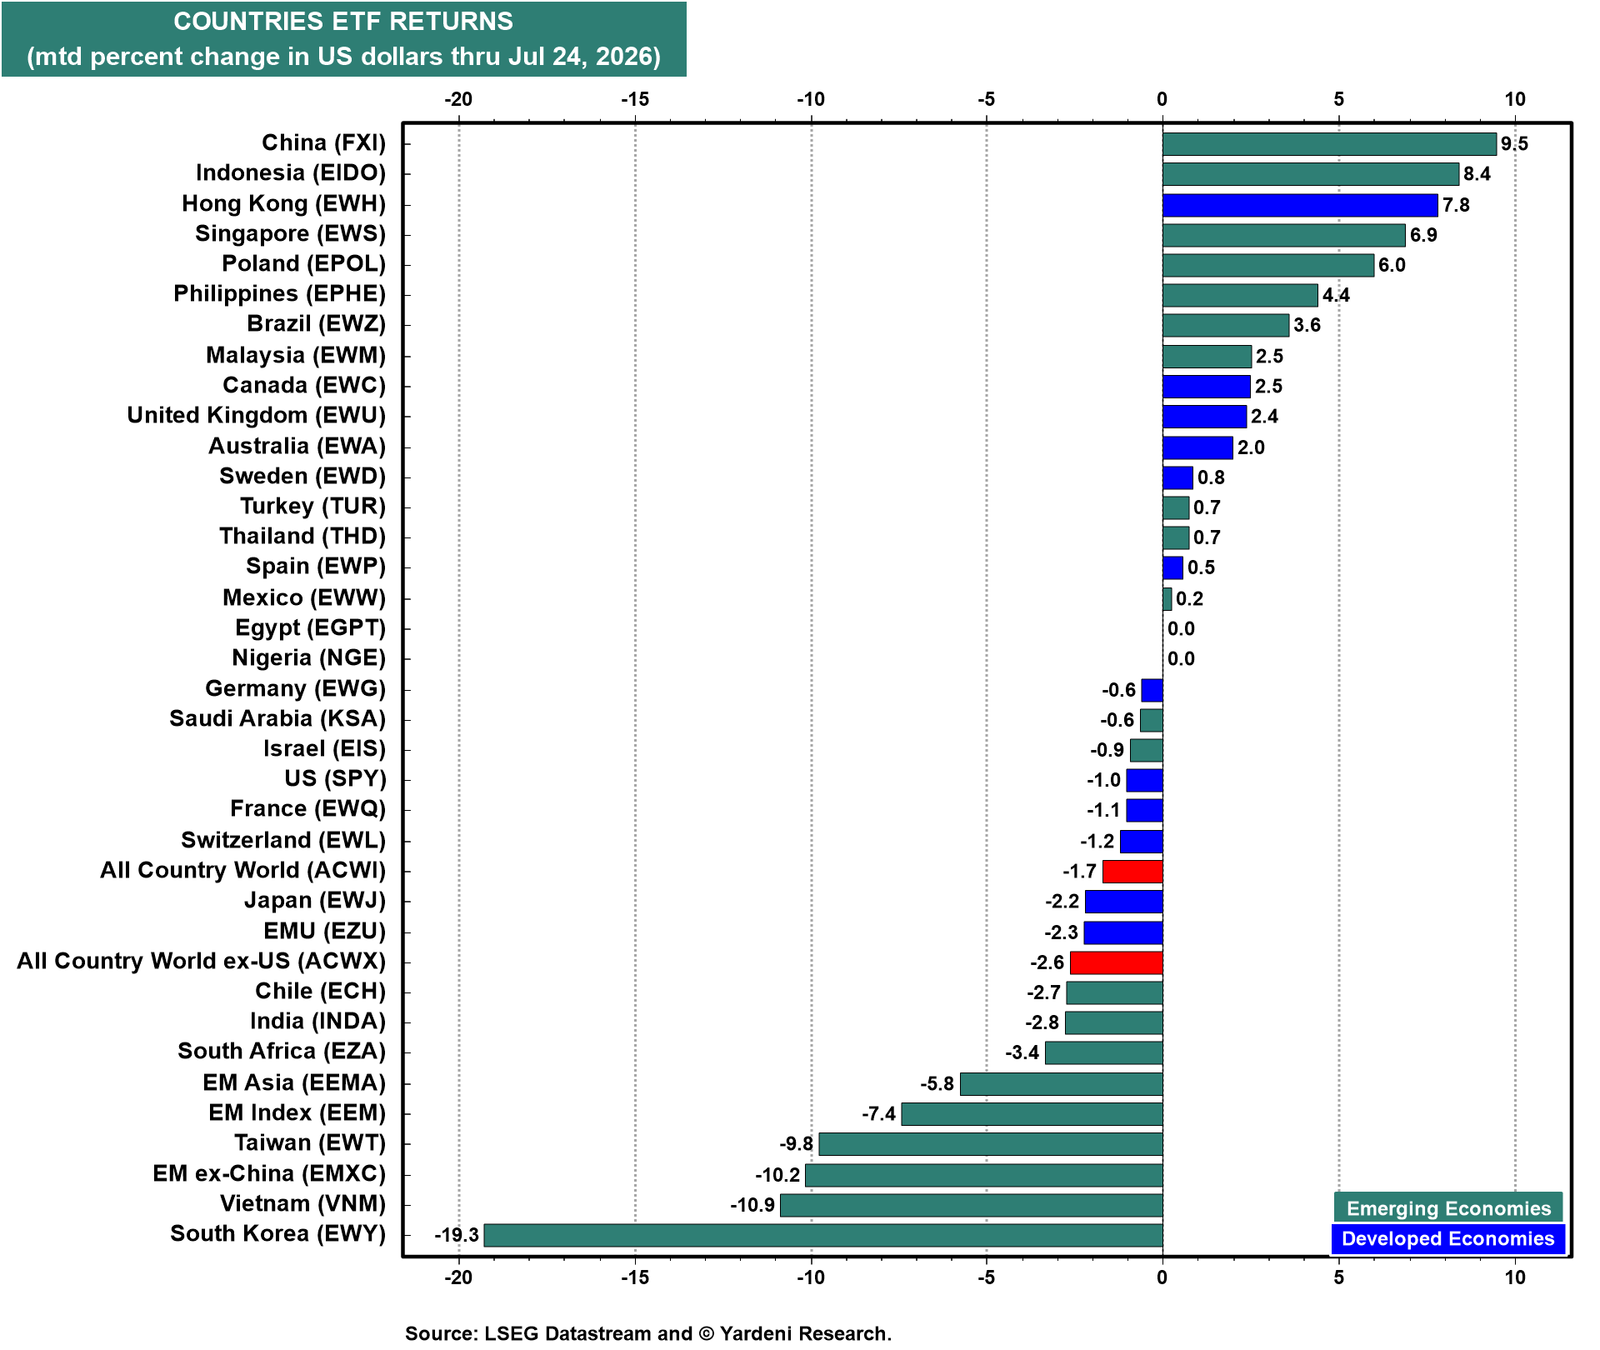
The structural case for Go Global remains intact underneath the rotation. Foreign stock valuations remain cheaper than the US, and forward revenues and earnings abroad are climbing to new records. Most importantly, Stay Home worked well for us from 2010 through 2024, and now accounts for 64.2% of global stock market capitalization (chart). Diversifying globally makes more sense to us now.
Here's more:
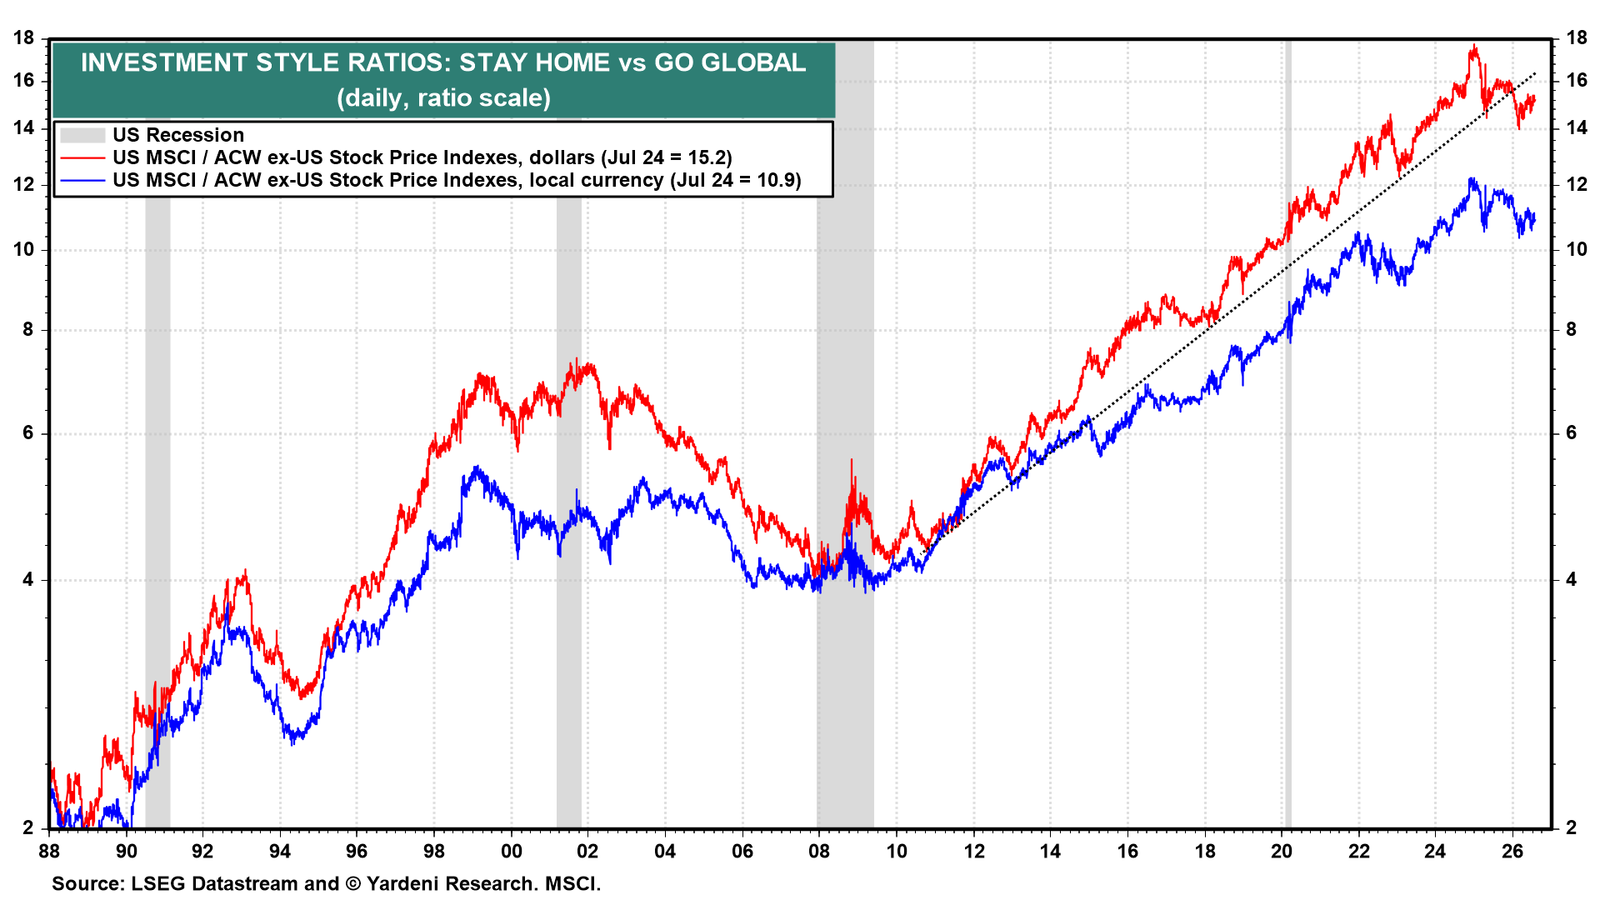
(1) Stay Home vs Go Global. The price ratios of the US stock market to the rest of the world remain on downtrends below their early 2025 peaks in both dollar and local currency terms (chart).
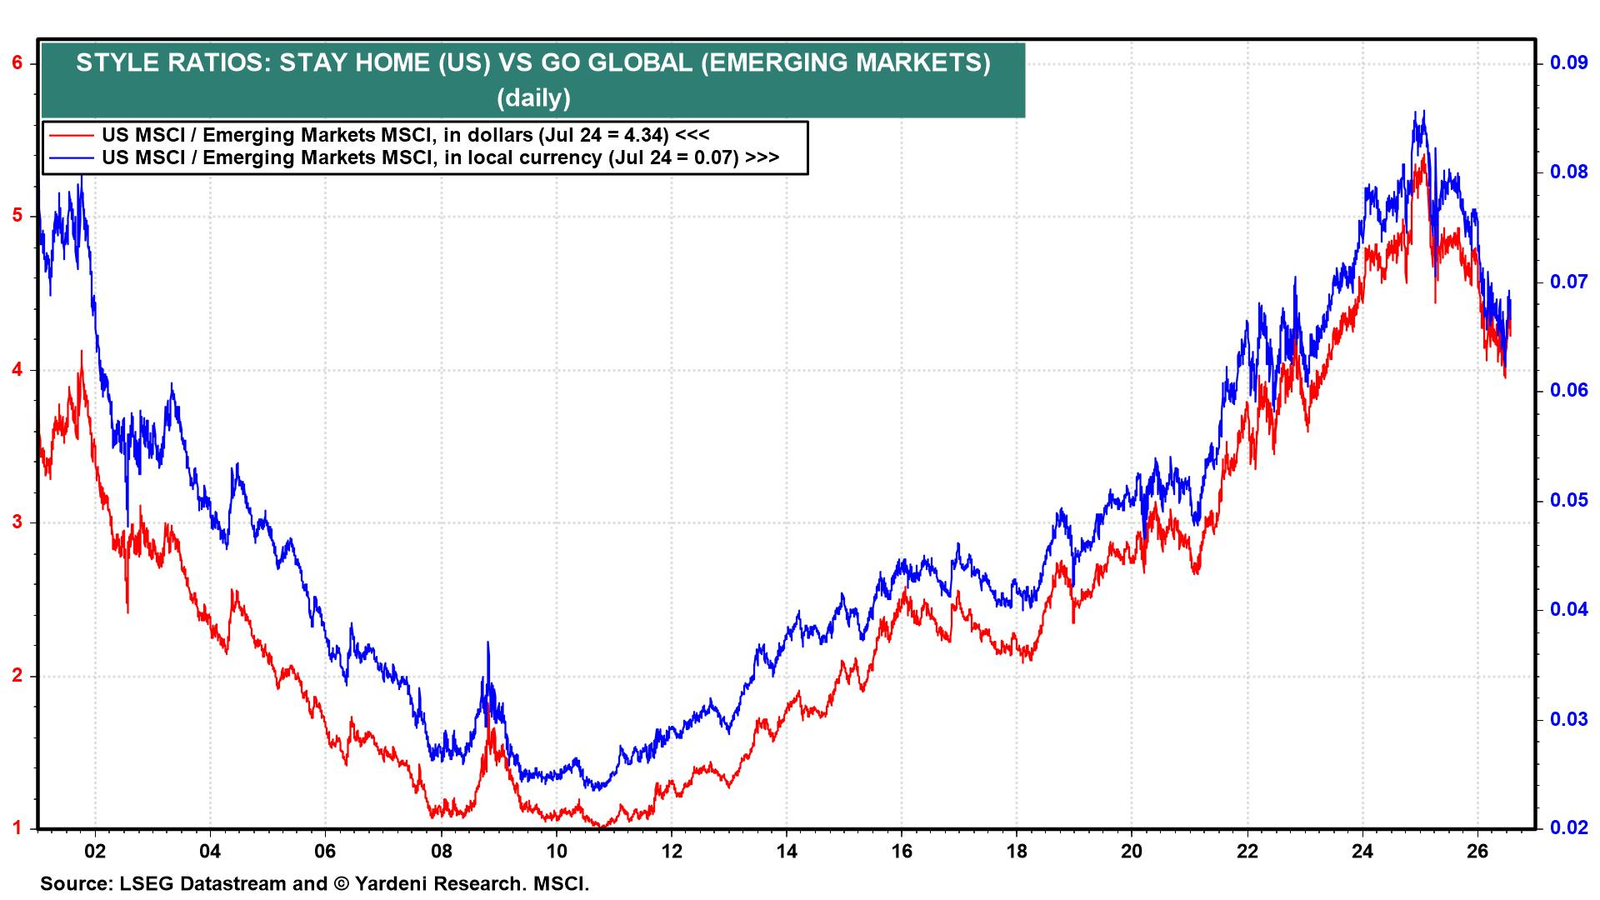
The ratios of the US MSCI to the emerging markets (EMs) MSCI have remained in decline since early 2025, when EMs began outperforming after underperforming since 2010 (chart). South Korea and Taiwan's outperformance clearly dominated the recent downtrends in the ratios.
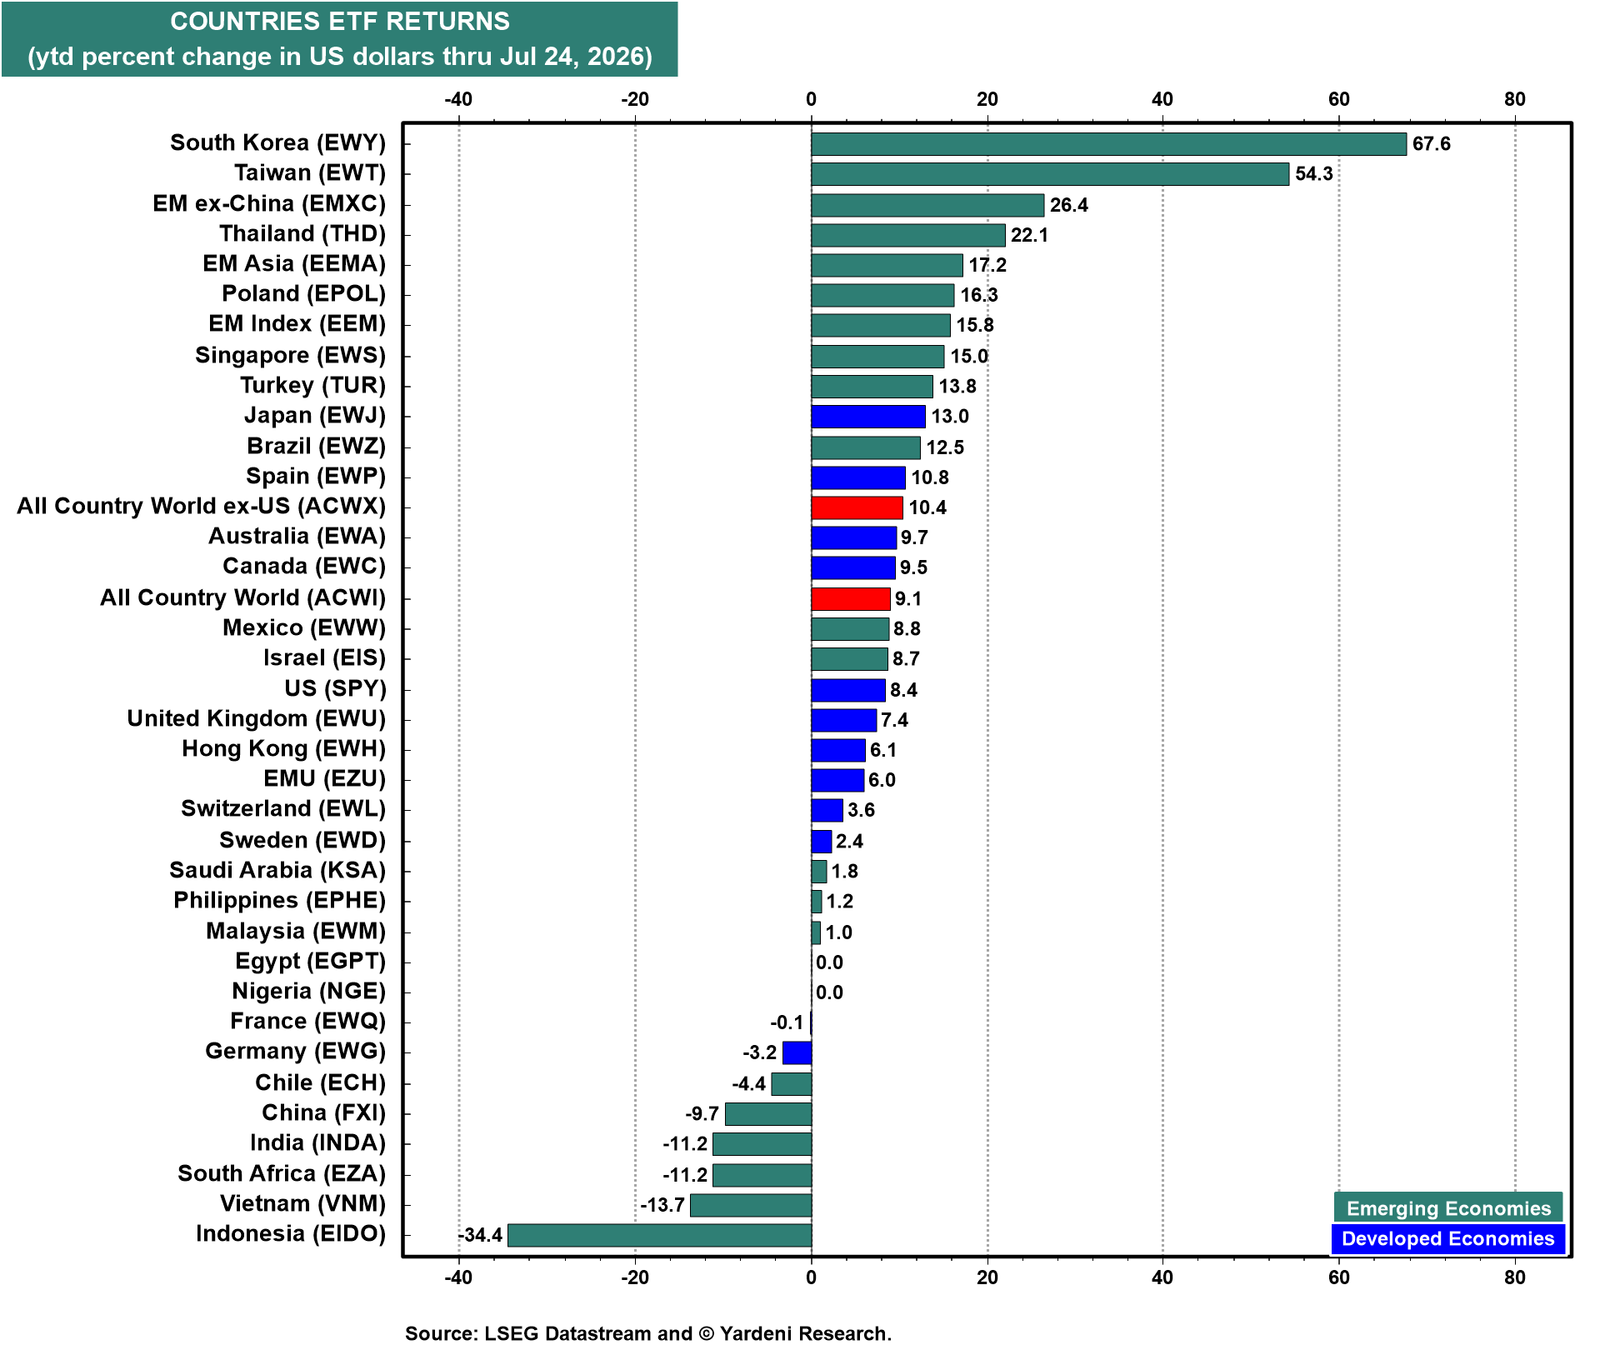
Year to date, South Korea and Taiwan still lead every country, up 67.6% and 54.3% in US dollar terms (chart). The month's pullback is a correction within a powerful run, not a reversal of it.
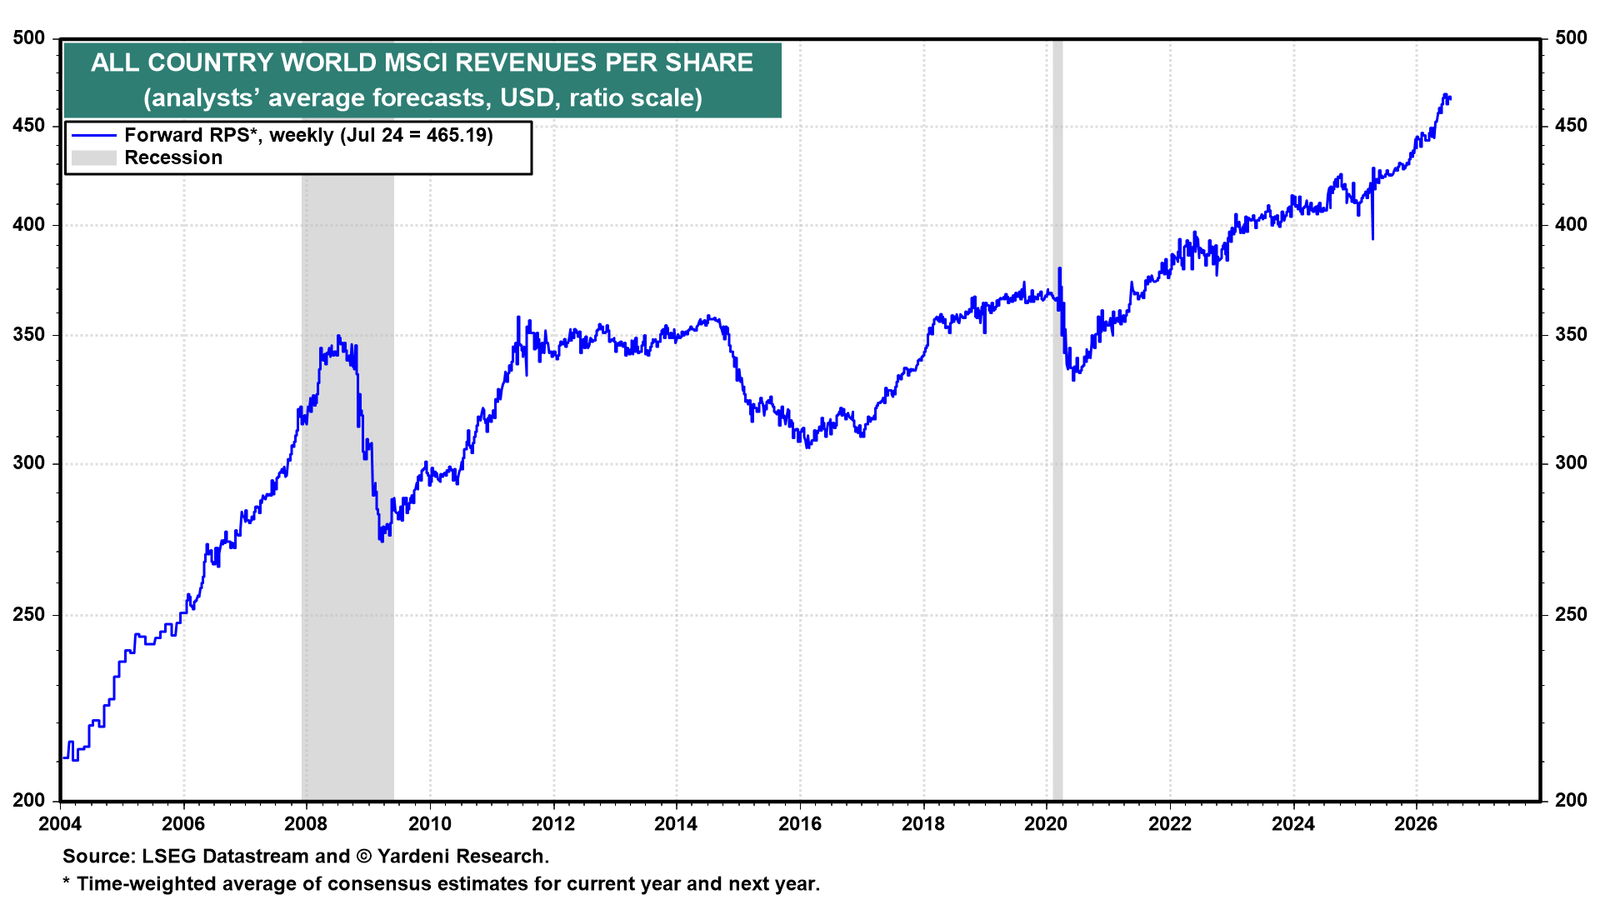
(2) Global revenues and earnings. The All Country World MSCI's forward revenues per share continues to hit record highs (chart). The world's top line has never been greater. The global economy is growing despite the recent oil shock.
The All Country World MSCI's forward earnings per share is also rising to new record highs (chart).
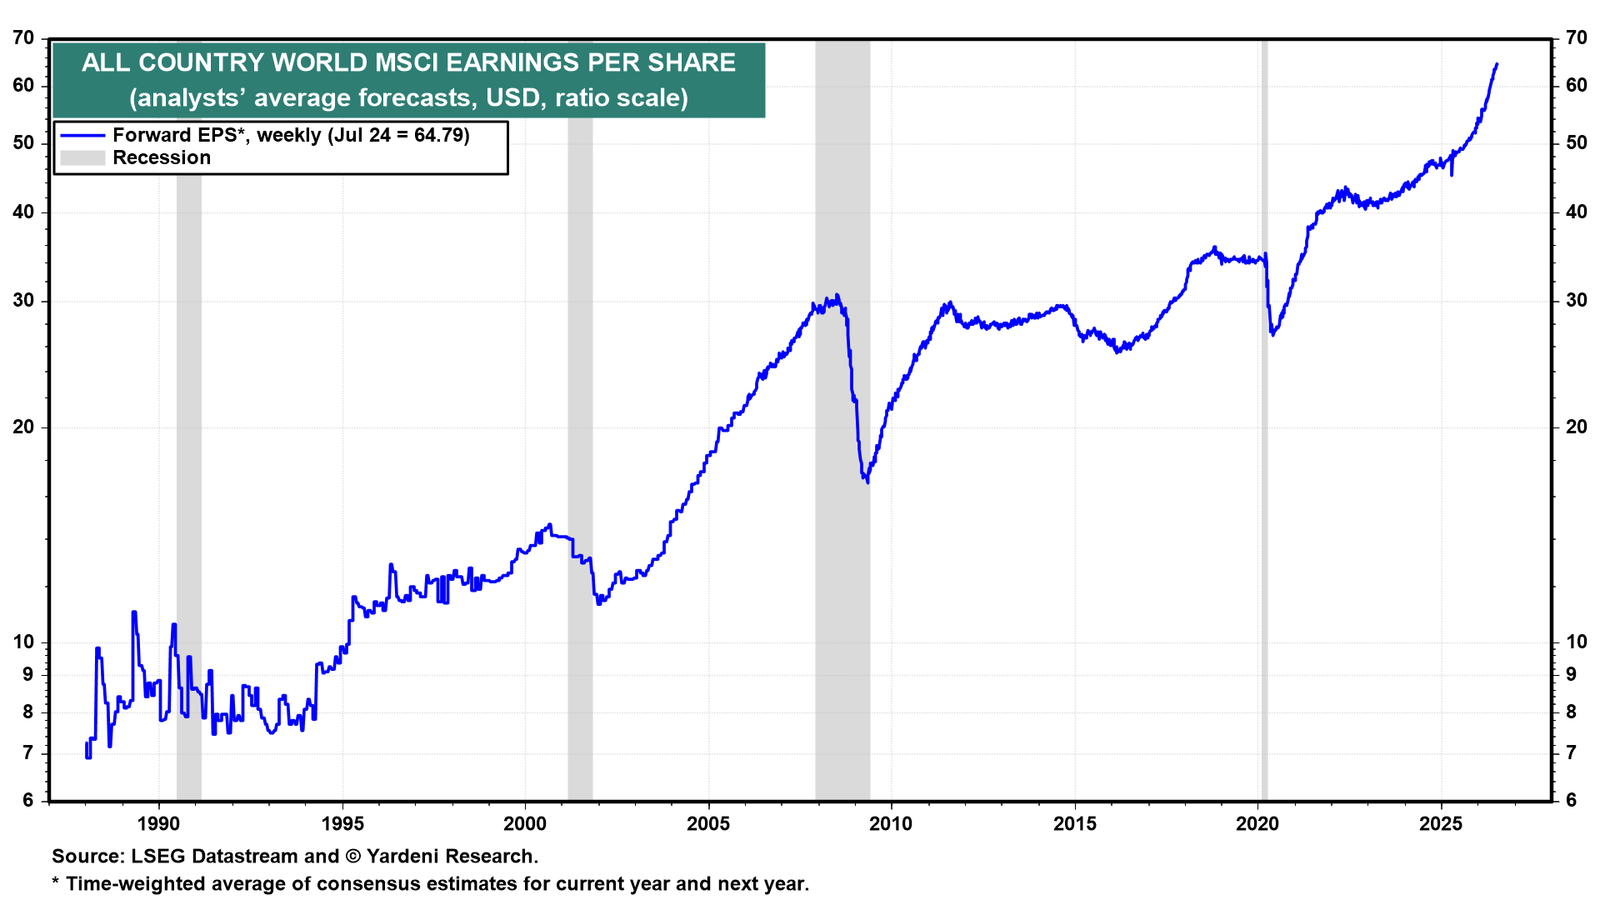
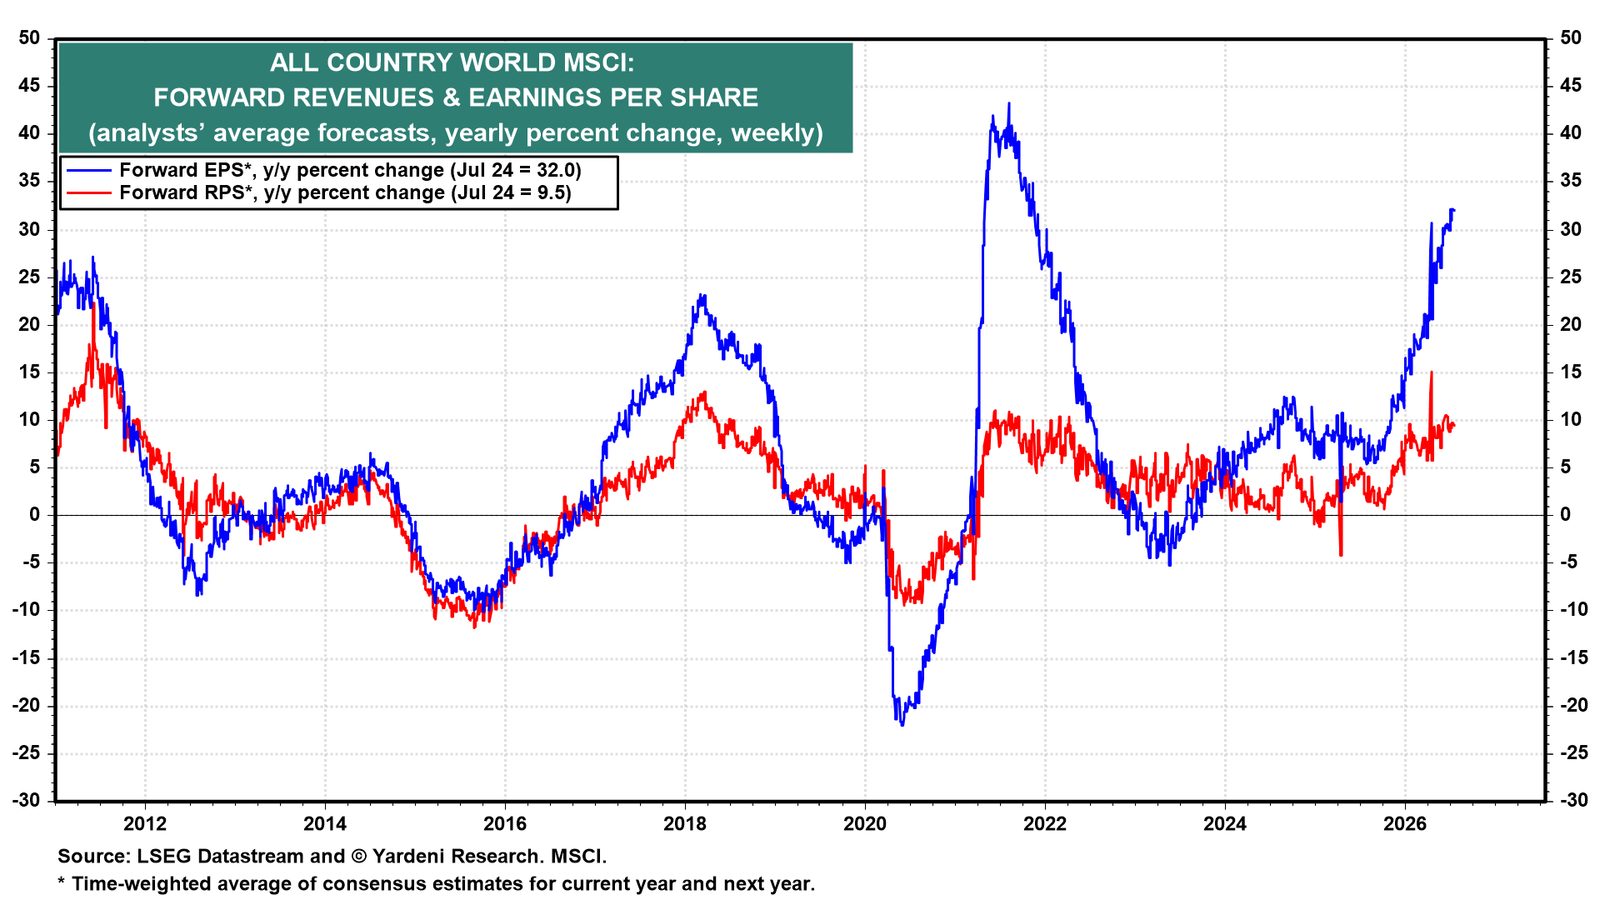
Global forward revenues is up 9.5% y/y and forward earnings is up 32.0% (chart).
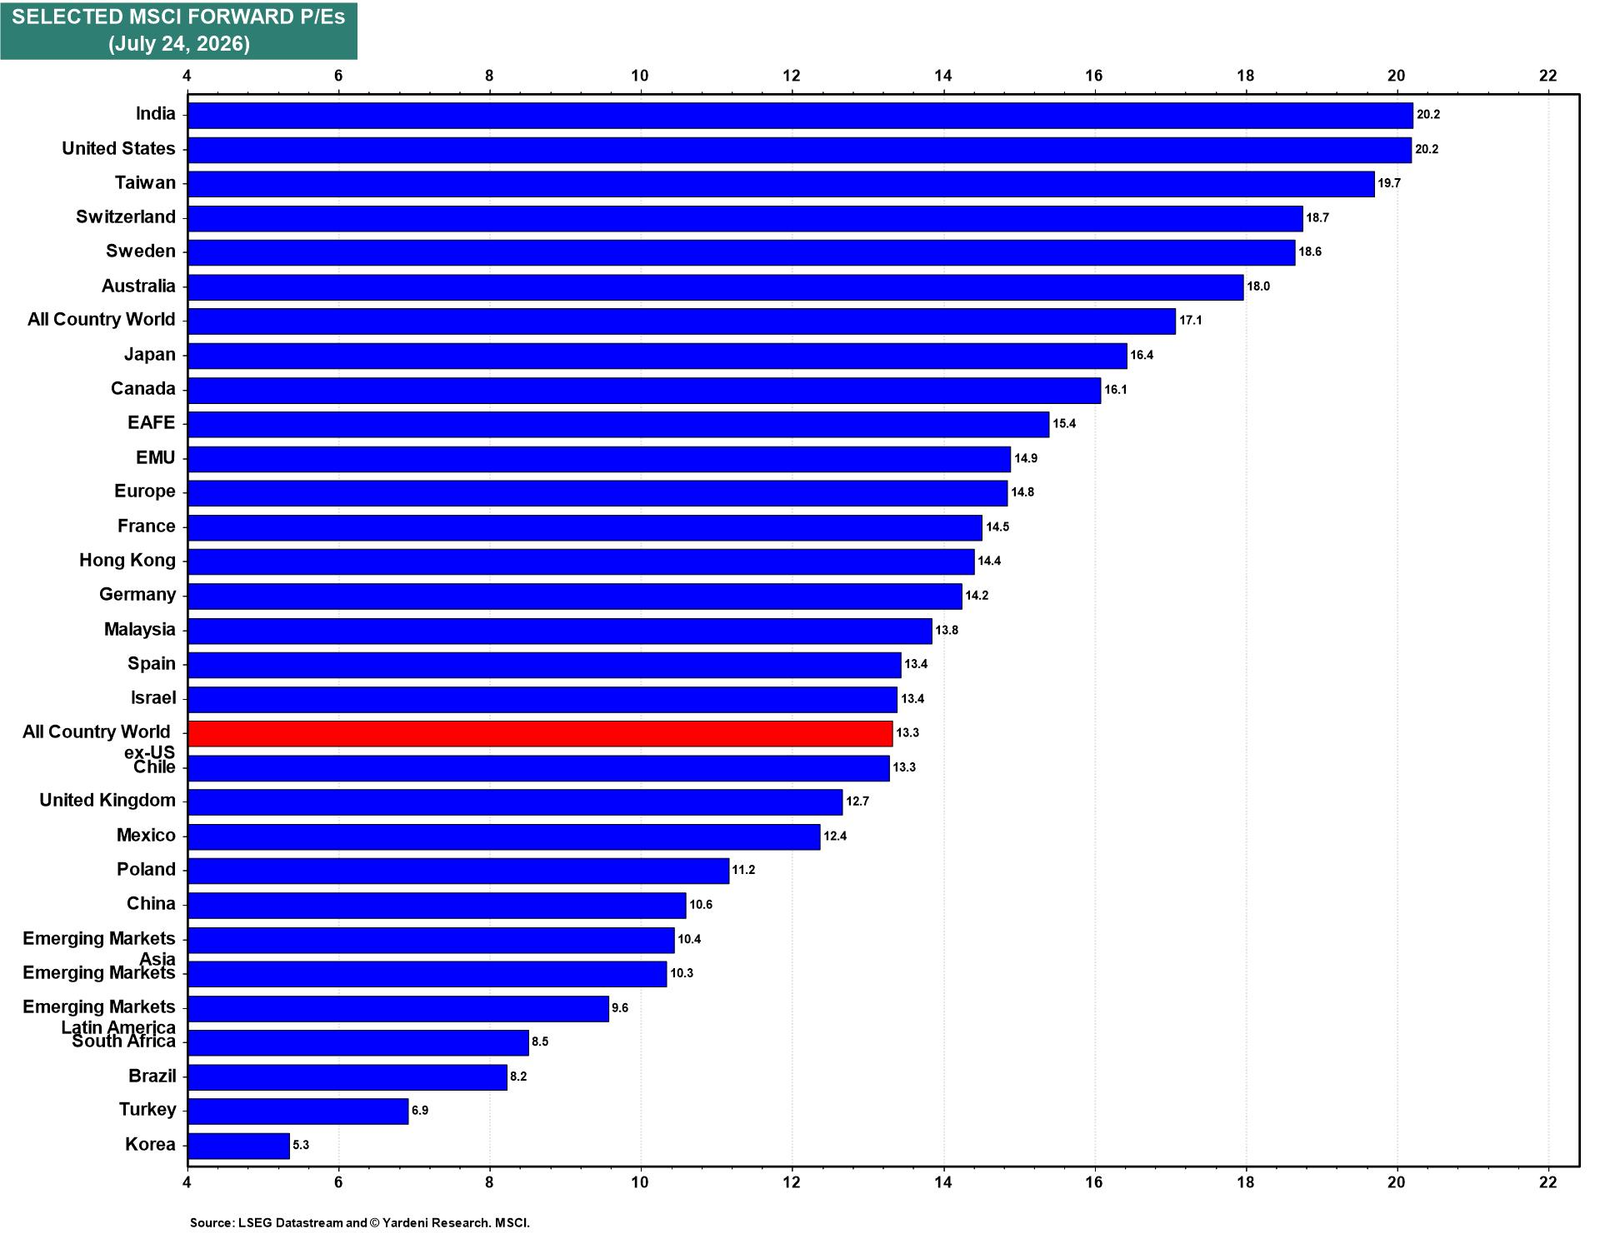
(3) Valuation. Foreign stock markets remain cheaper than the US across the board with the exception of India (chart). South Korea is the cheapest major market with a 5.3 forward P/E, and this month's selloff has only increased that discount. We think the KOSPI pullback is opening up an attractive buying opportunity.
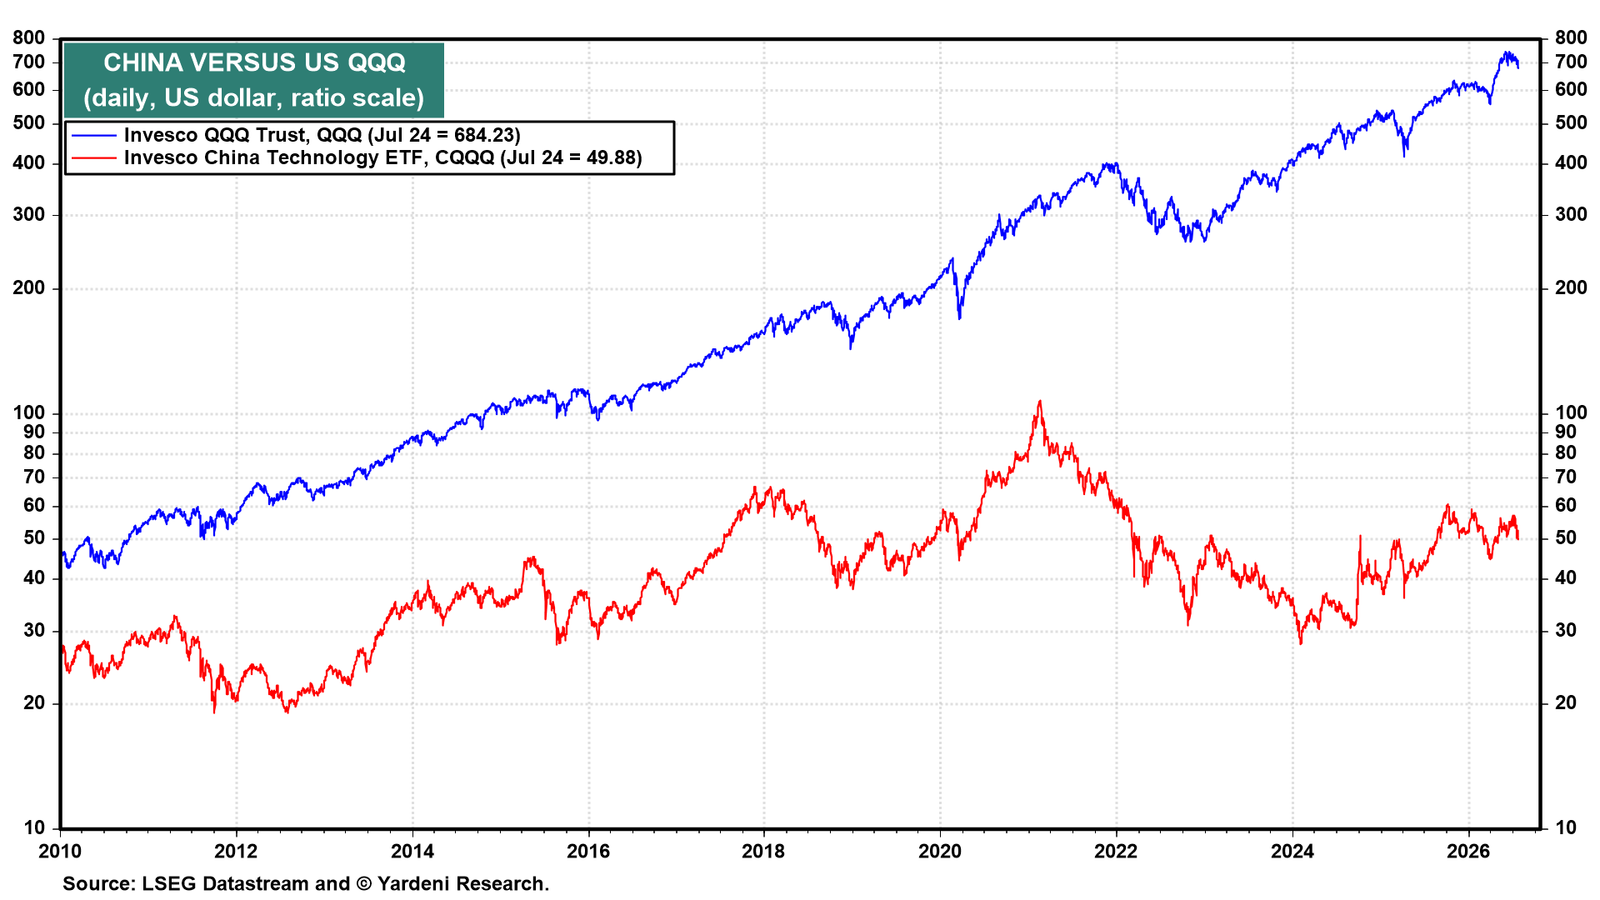
(4) China. China's Kimi K3 model has narrowed the gap with the top US AI labs, yet none of that progress is showing up in Chinese equities. China bounced hard this month but is still down 9.7% ytd, and the Invesco China Technology ETF continues to trail the US Invesco QQQ Trust on any long horizon (chart).
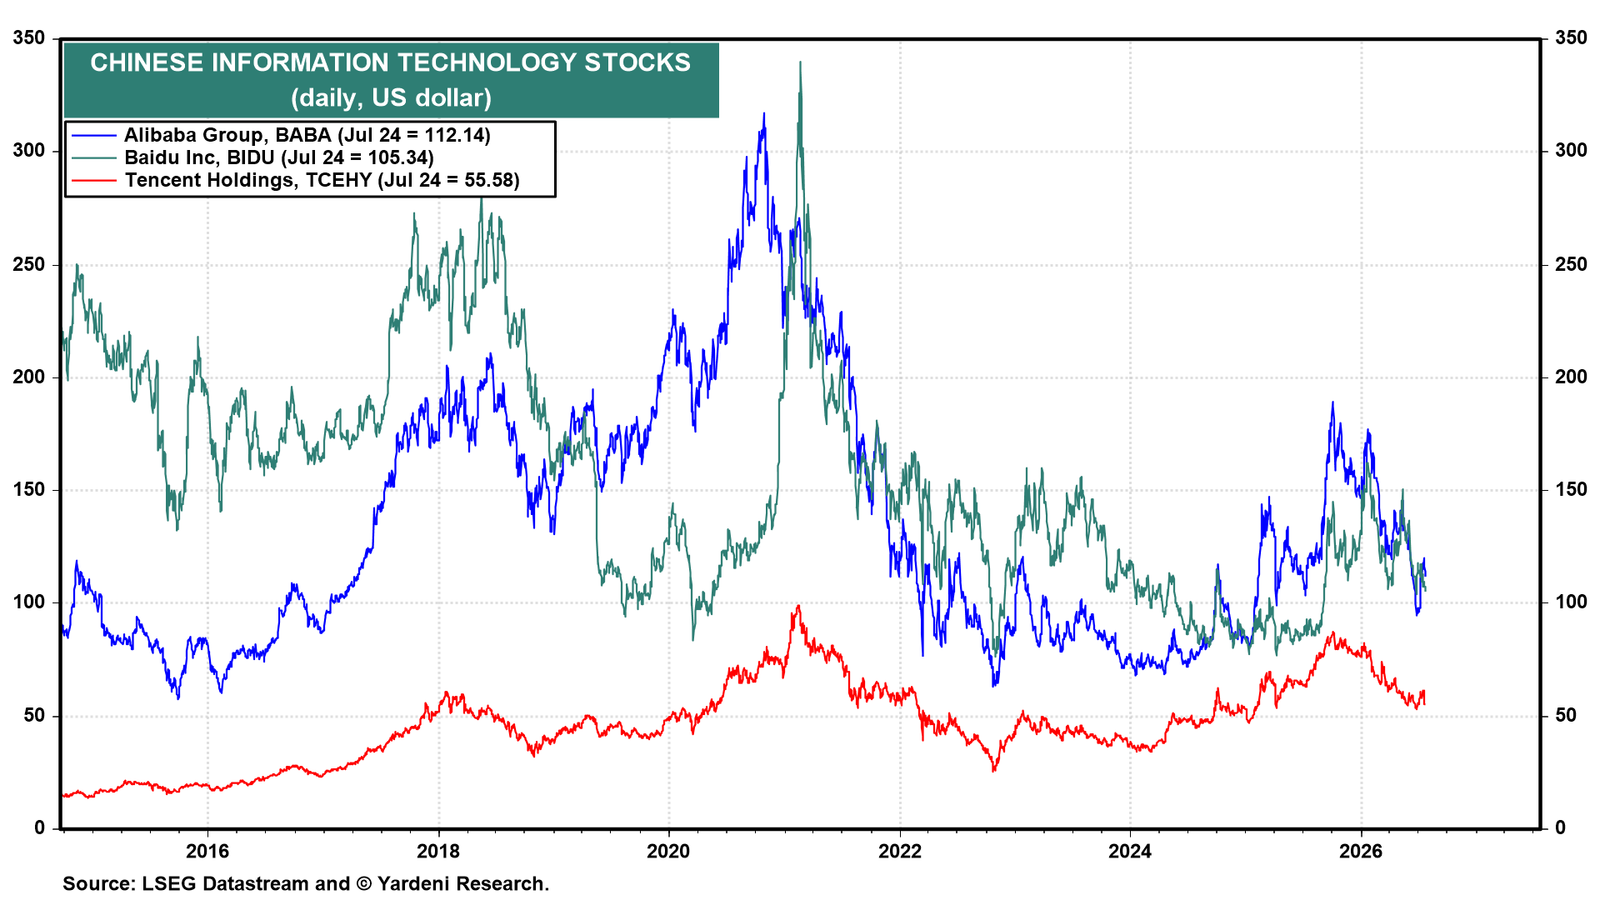
The big Chinese internet names tell the same story. Alibaba, Baidu, and Tencent all trade well below their 2025 peaks, a reminder that the market has yet to reward China's platform giants despite their AI investments (chart). China tech has not joined the AI rally driving the US, South Korea, and Taiwan.
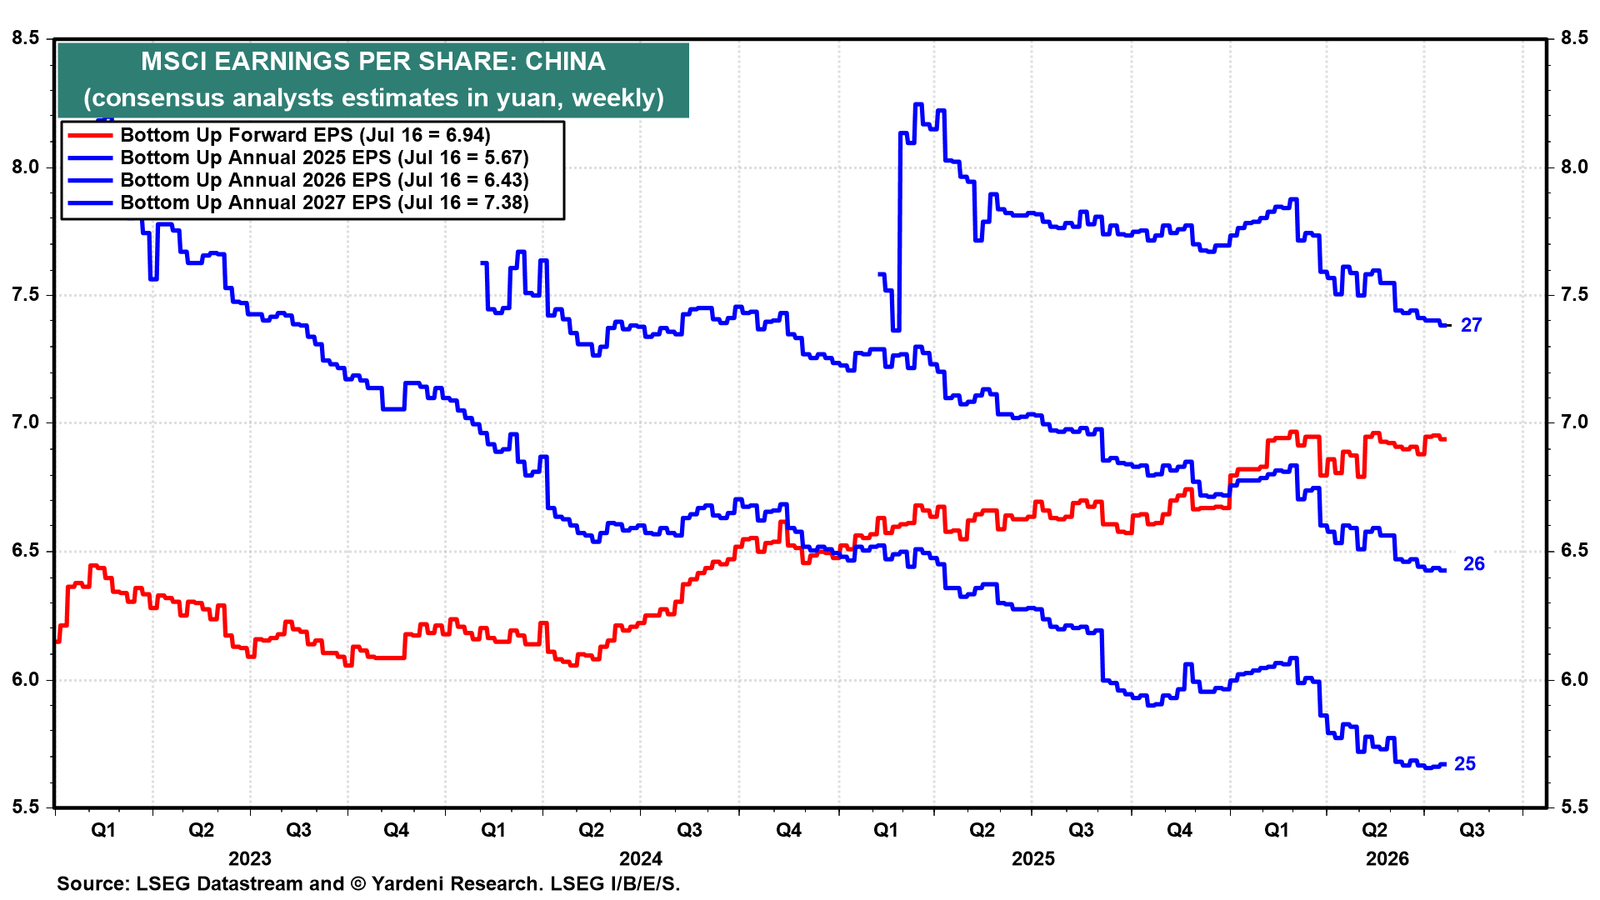
China MSCI's 2026 and 2027 earnings estimates continue to drift lower while forward earnings has stagnated, reflecting persistent doubts about the country's growth outlook (chart). China trades at a 10.6 forward P/E, low by global standards but weighed down by those anemic earnings trends.
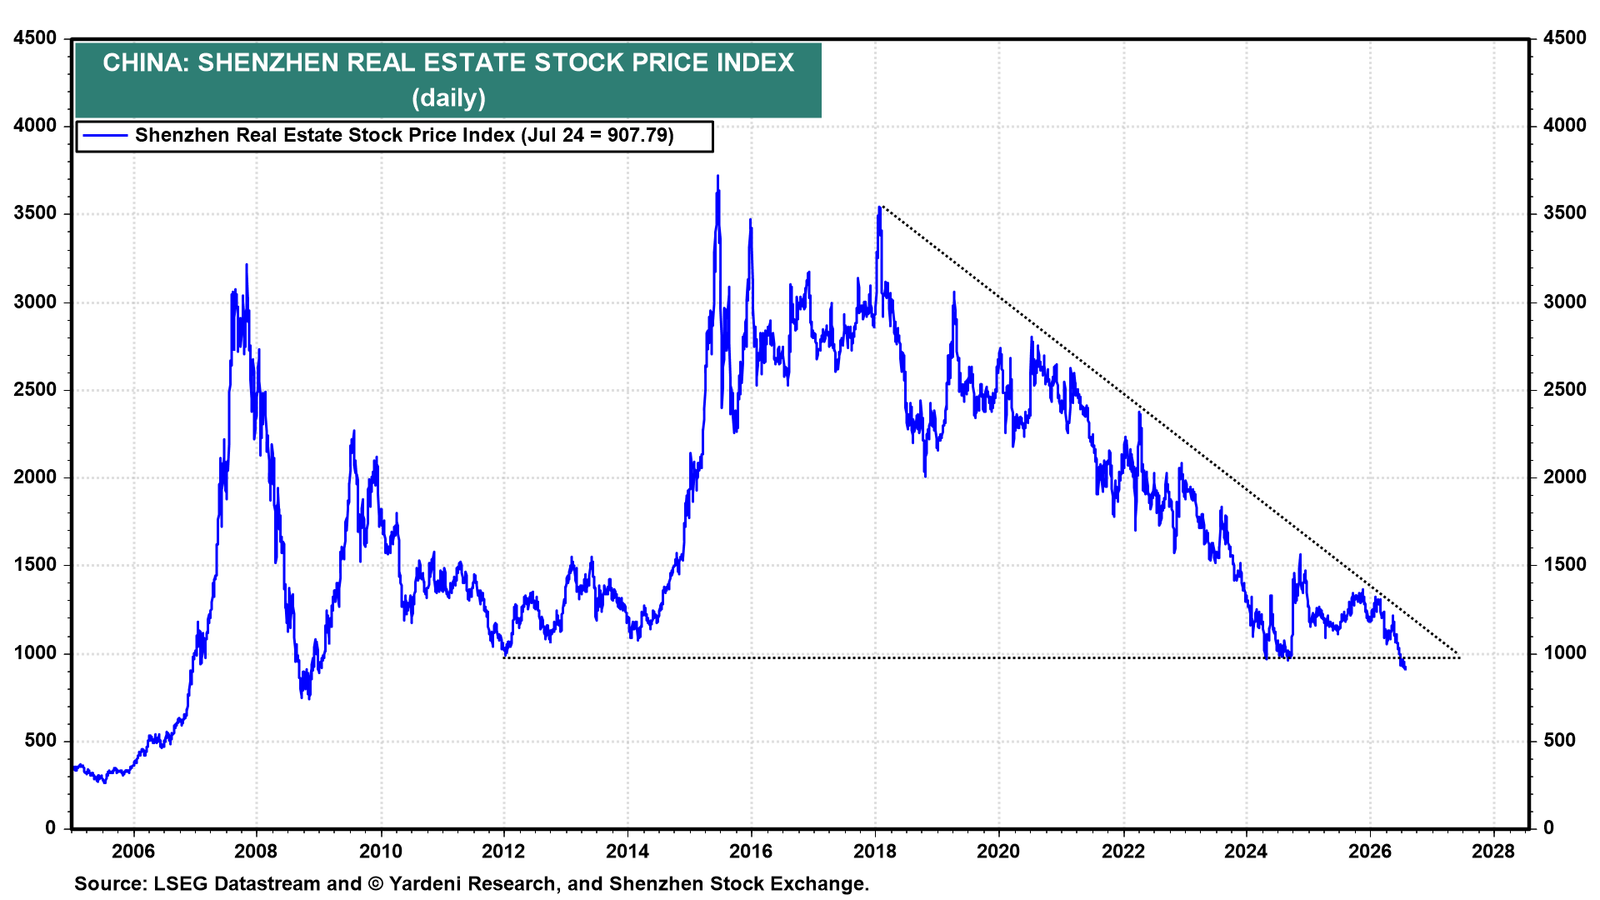
China's Shenzhen Real Estate stock price index is signaling that the country's property depression is getting worse (chart).
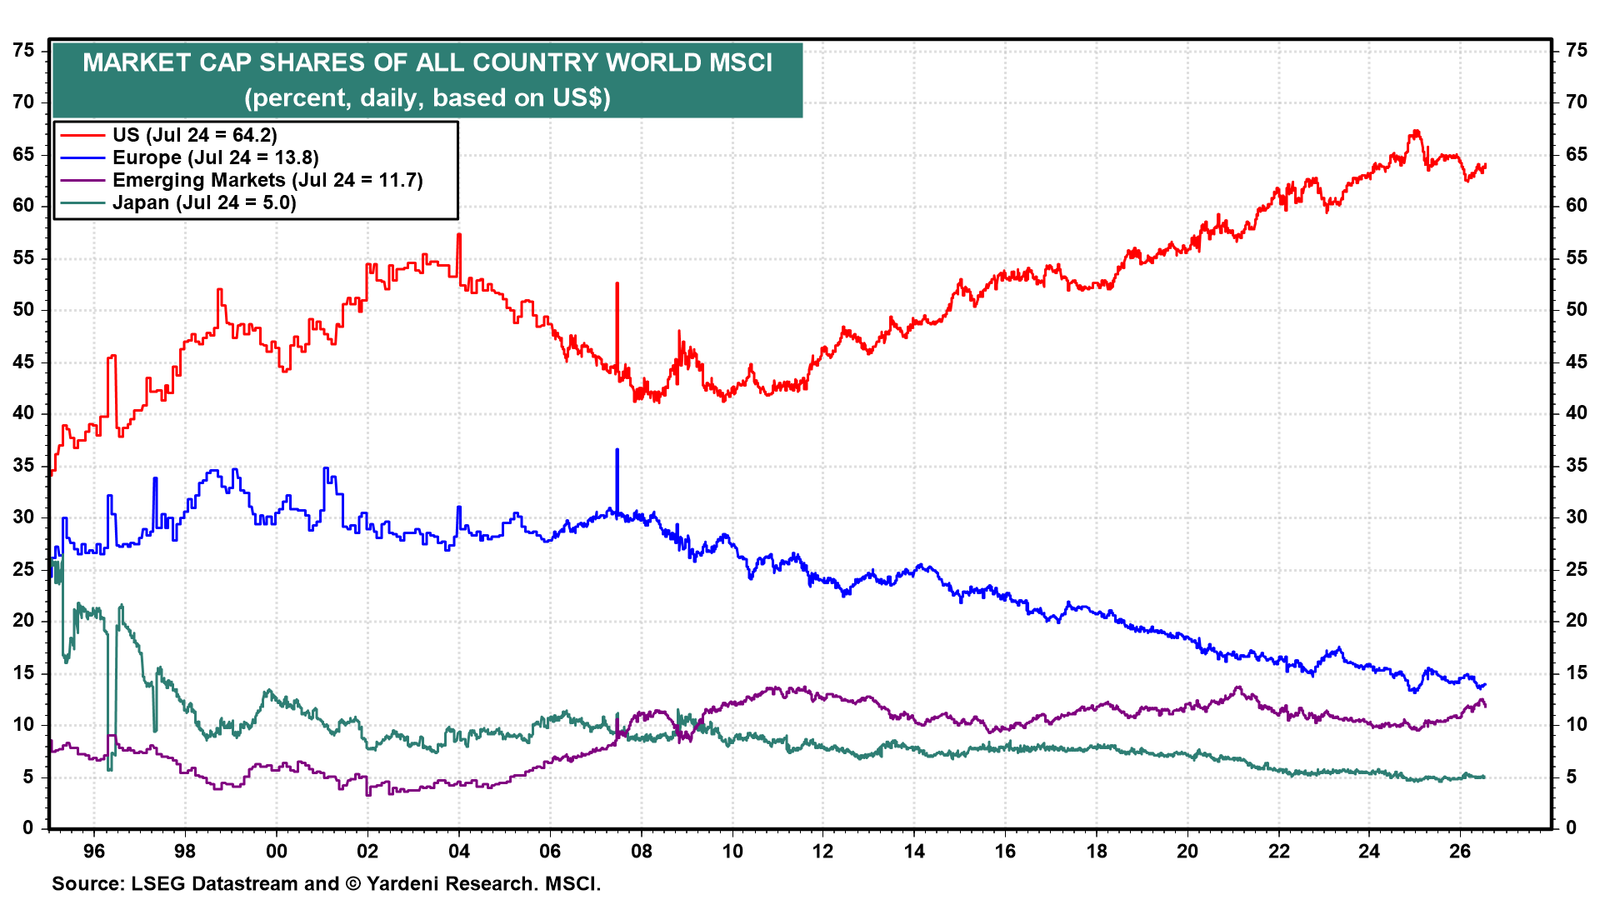
China's economy is highly leveraged, with bank loans outstanding at a record $41.5 trillion, three times more than in the United States (chart).