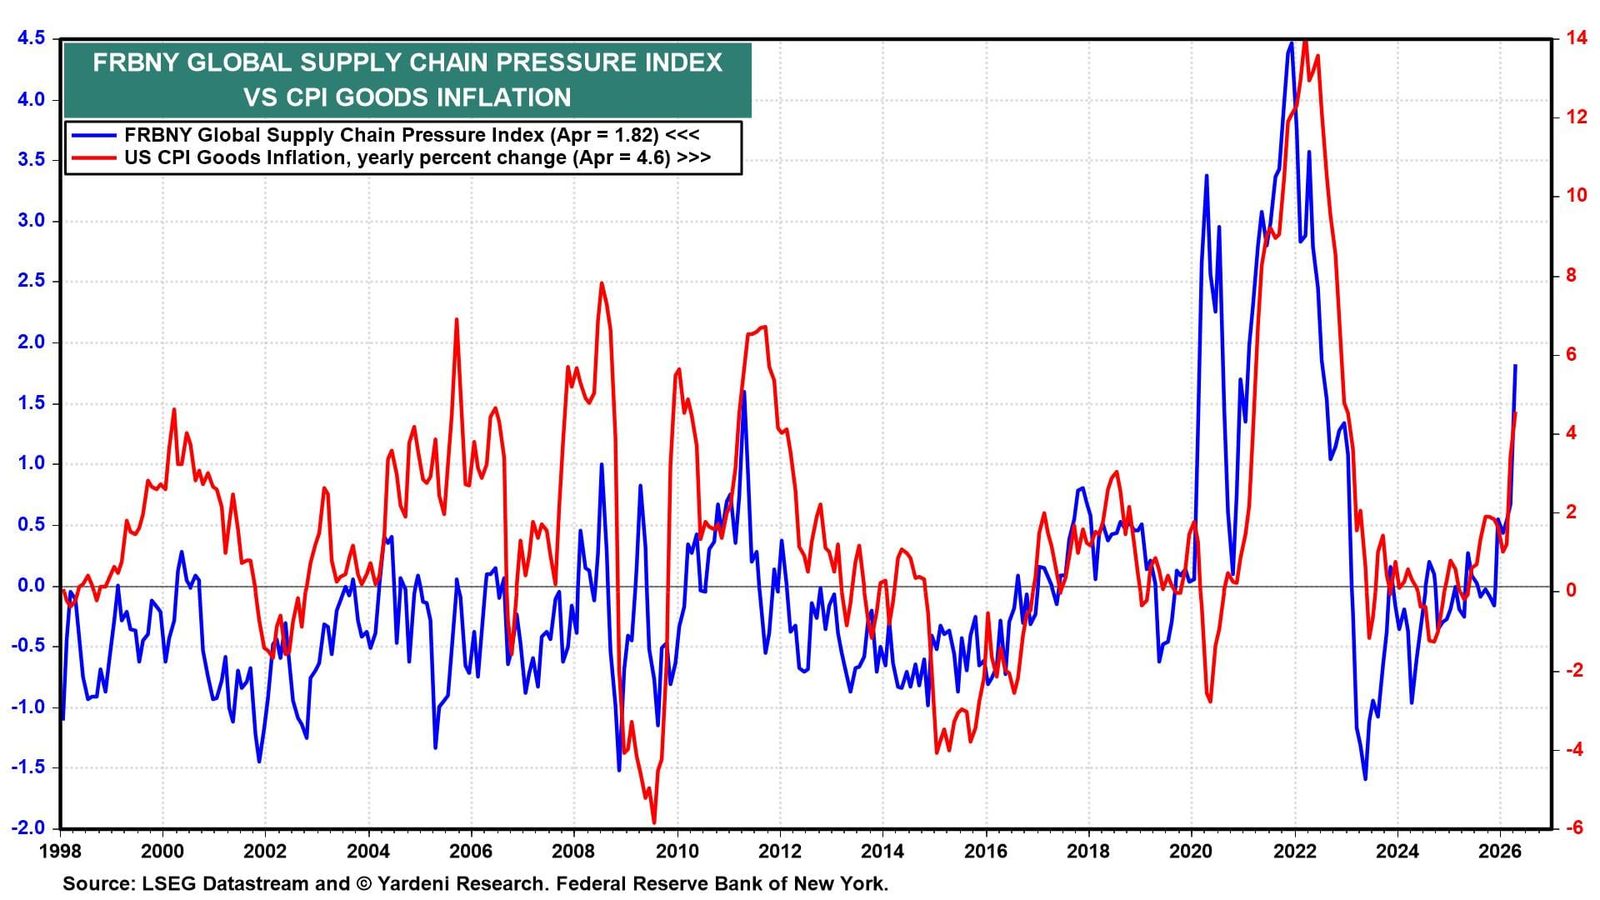
Our call to Go Global rather than Stay Home has paid off so far this year, despite the latest war in the Middle East, which boosted Stay Home, especially in March. However, Go Global was mostly driven by the AI trade in South Korea and Taiwan.
The Emerging Markets MSCI ETF (EEM) is up 25.4% ytd against 10.9% for the S&P 500. Moreover, we recommended staying out of China. The EM ex-China ETF (EMXC) is up 39.0% ytd. Europe, Japan, and many EMs that are net petroleum importers should outperform when the Strait of Hormuz reopens, at least on a short-term basis.
Here's more:
(1) Go Global vs Stay Home. The ratio of the US MSCI to the All Country World (ACW) ex-US MSCI stock price index had been on a solid upward trend since 2010, peaking at a record high in early 2025 (chart). It fell below this trend in late 2025. It rebounded during the war because the US is a net petroleum exporter. The ratio remains below the trendline.
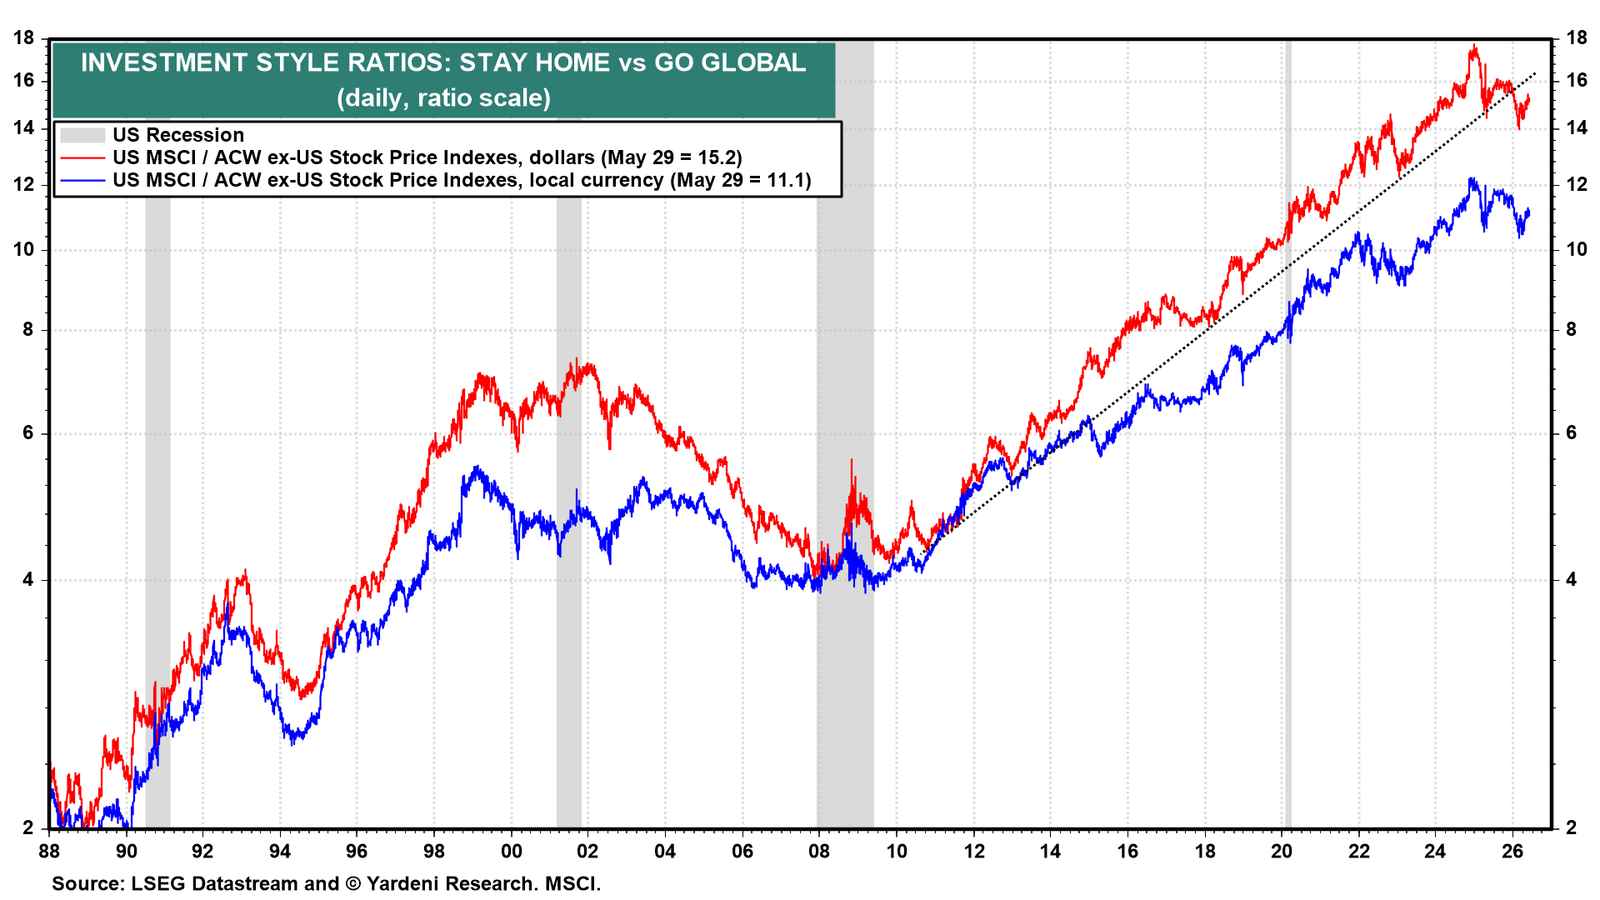
The forward earnings per share of the ACW ex-US MSCI has been rising rapidly, along with the comparable series for the US (chart). The strength is broad-based across regions, with India a notable upside surprise. This is a bit surprising, though the AI-led boom in South Korea and Taiwan certainly explains much of the strength in the overseas measure of forward earnings.
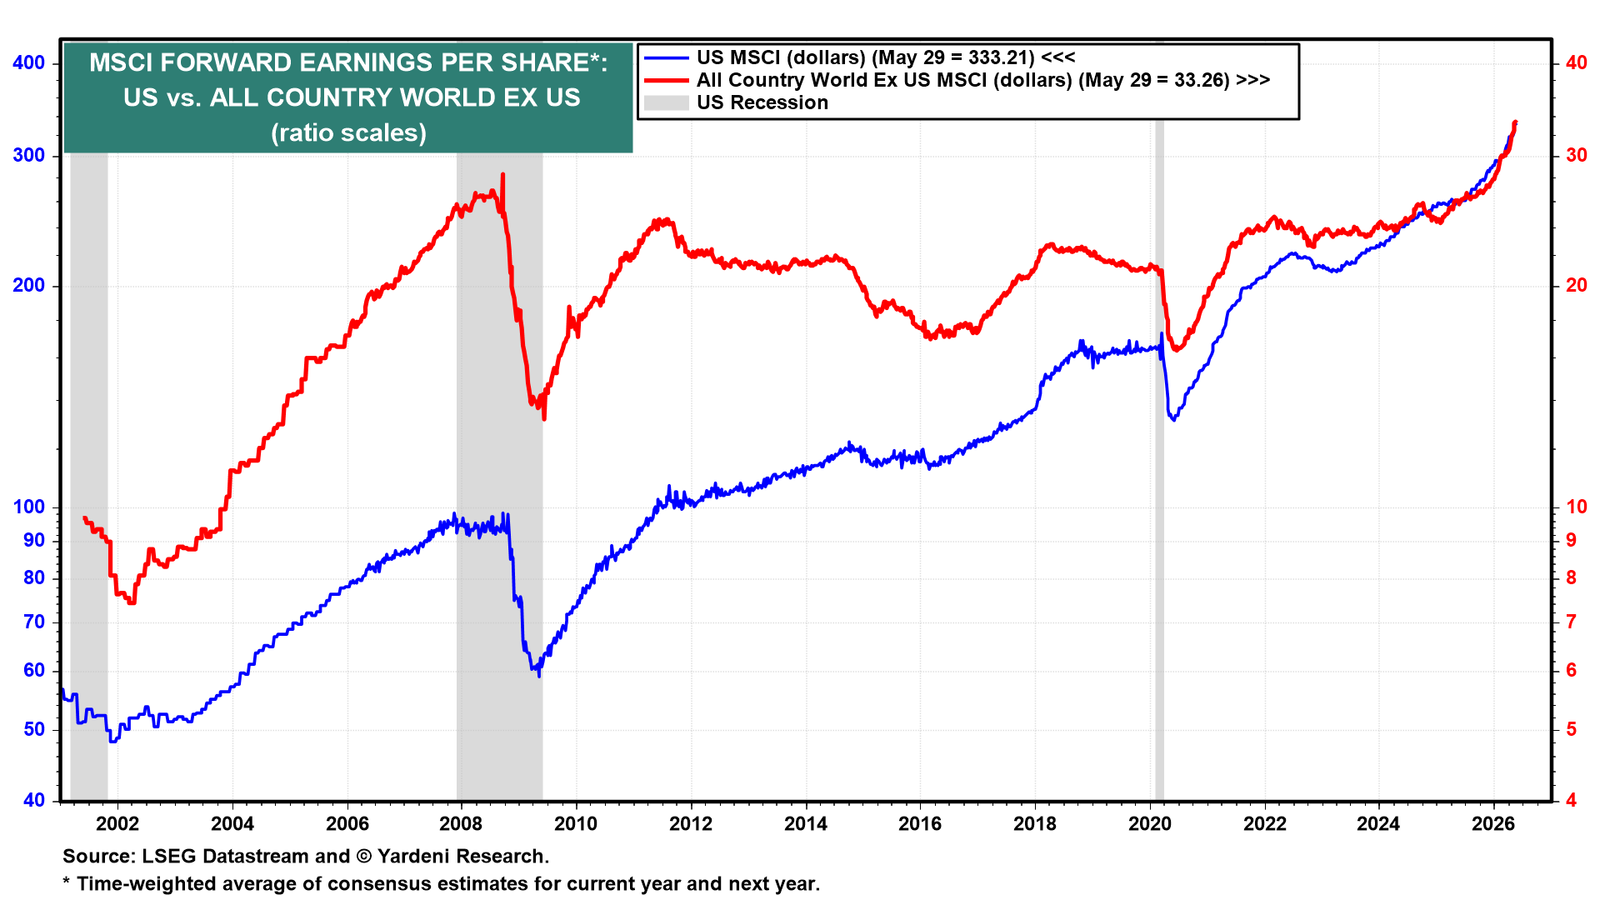
The US MSCI’s forward P/E is currently 21.5 versus 14.2 for the ACW ex-US MSCI, and the gap has widened recently (chart). There's clearly room for multiple expansion overseas, though that's been true for a long time.
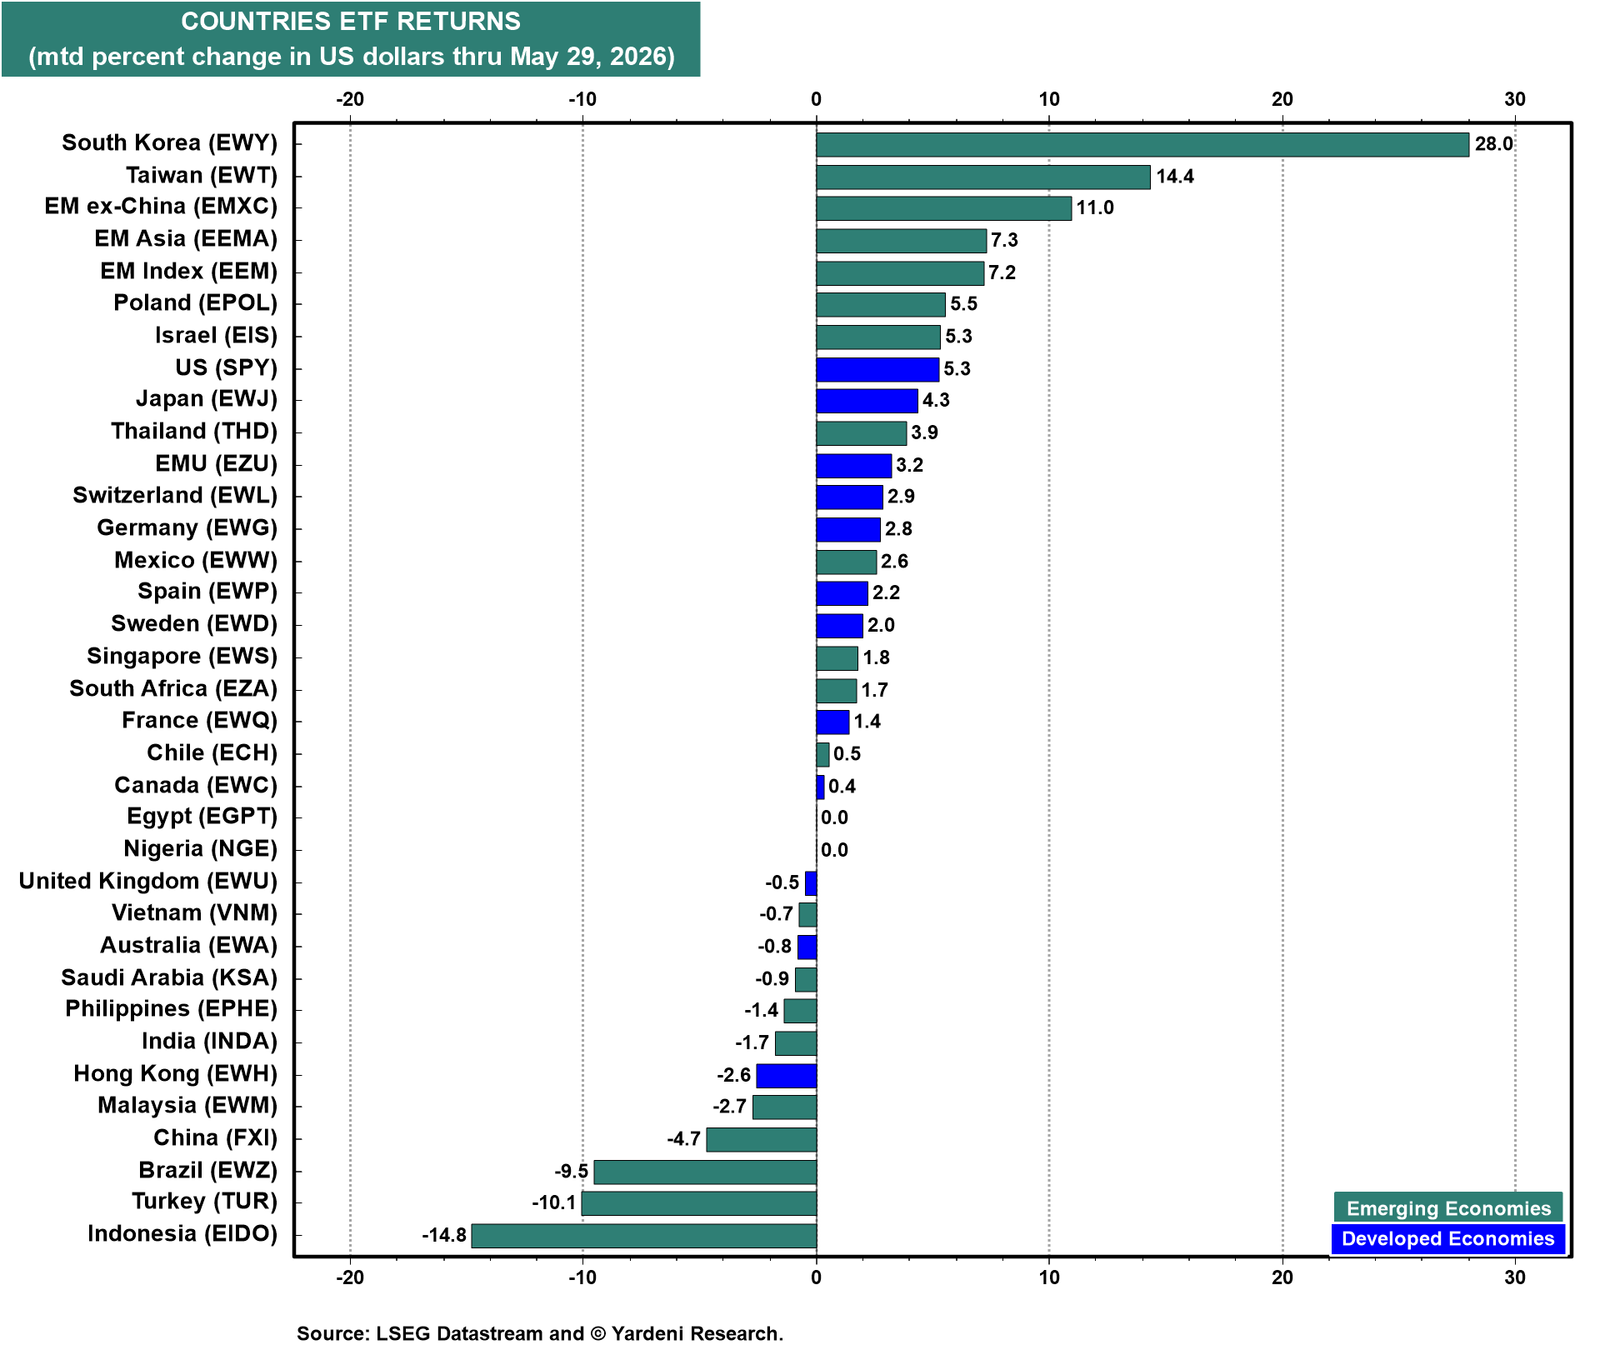
At the country level, the AI-driven cohort continues to dominate. On a ytd basis, South Korea and Taiwan closed up 28.0% and 14.4% in May, respectively, with EM ex-China up 11.0%, while the US gained 5.3% during the month (chart). The Korea Institute for Industrial Economics and Trade just lifted its 2026 export forecast to $924.4 billion, up 30.3% y/y, led by semiconductor exports. Looking further down the pecking order, several laggards are oil importers positioned to benefit from a reopening of the Strait.
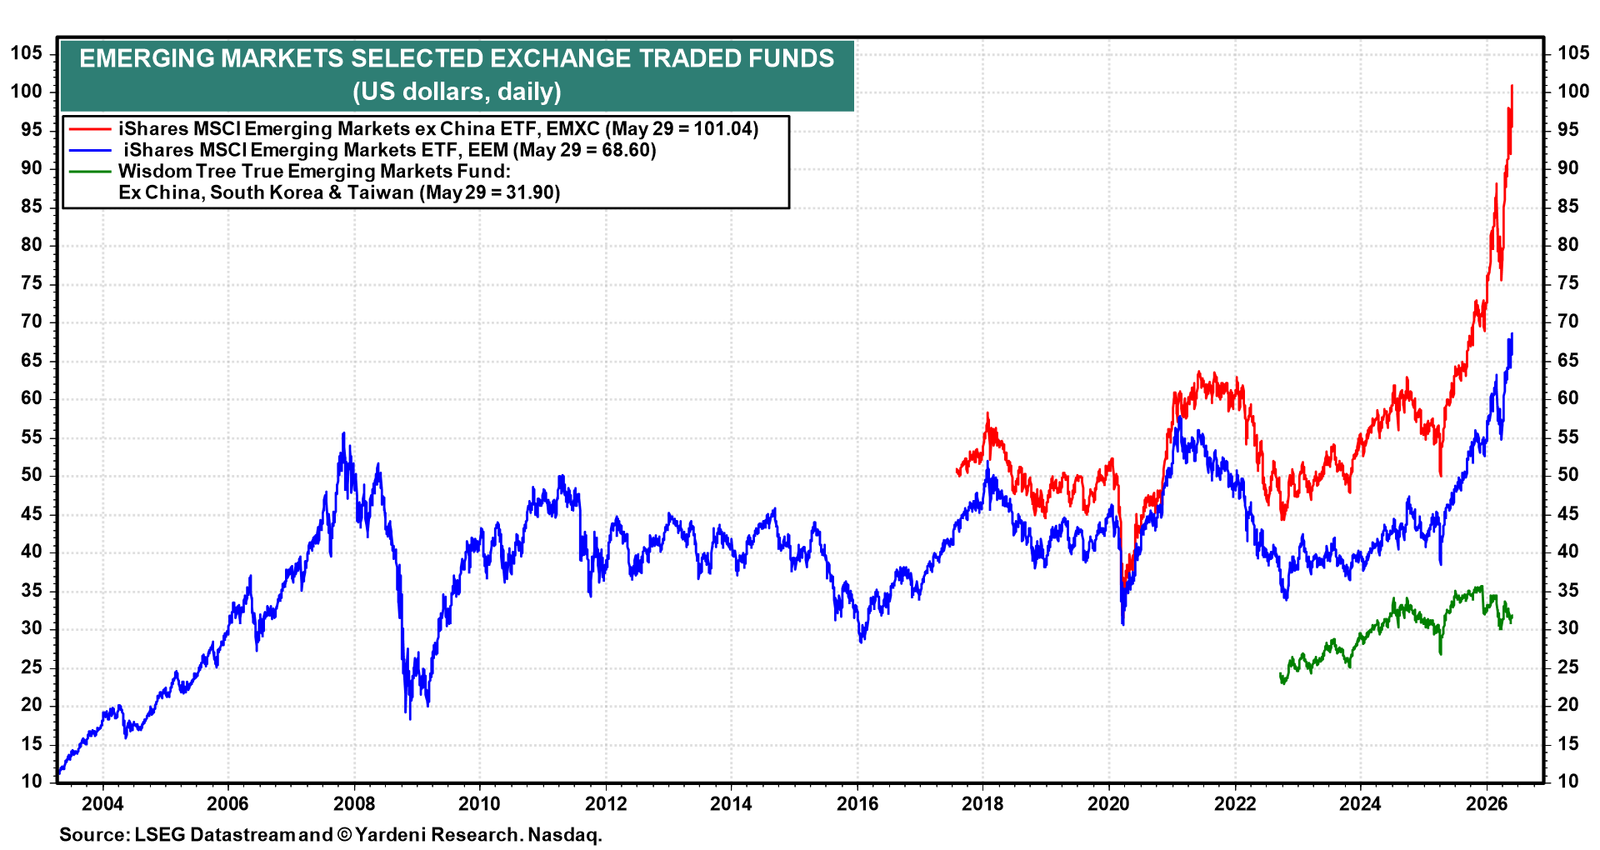
(2) Emerging markets. The EM rally's extraordinary concentration is the catch. EMXC is up 39.0% ytd, EEM is up 25.4% ytd, and WisdomTree True EM is down 2.5% ytd (chart). The gap between EMXC and EEM reflects the China drag. The gaps between both and True EM reflect the South Korea and Taiwan tailwind.
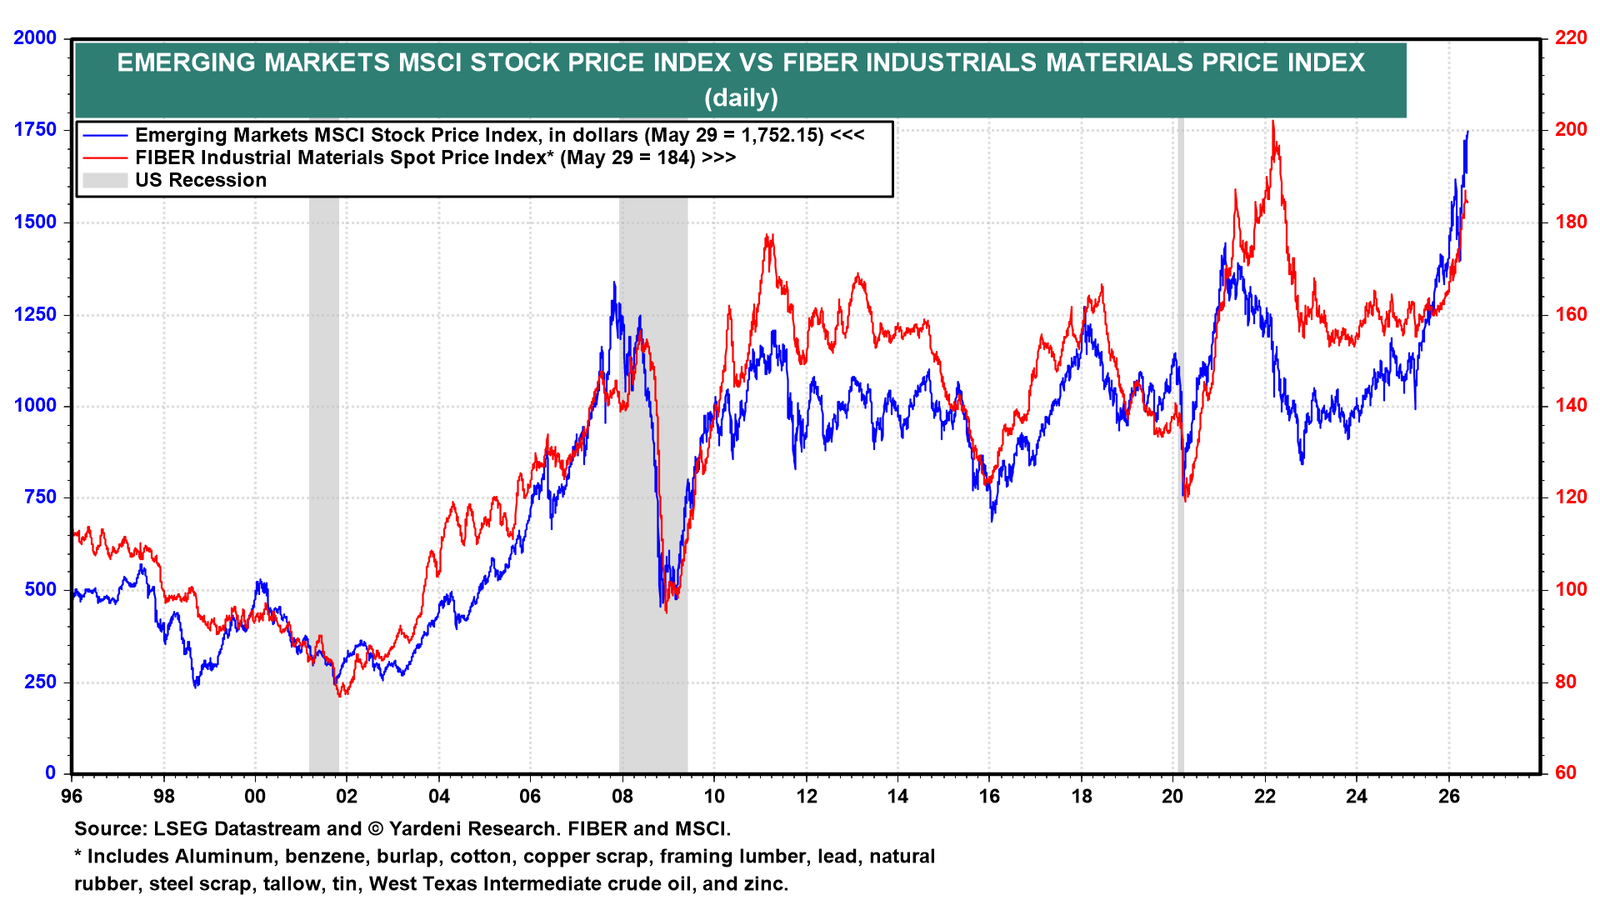
The Emerging Markets MSCI tracks the FIBER industrial materials price index closely (chart). FIBER captures aluminum, copper, oil, and other listed commodities. Both continue to rise, suggesting that this time the AI trade is the source of global reflation.
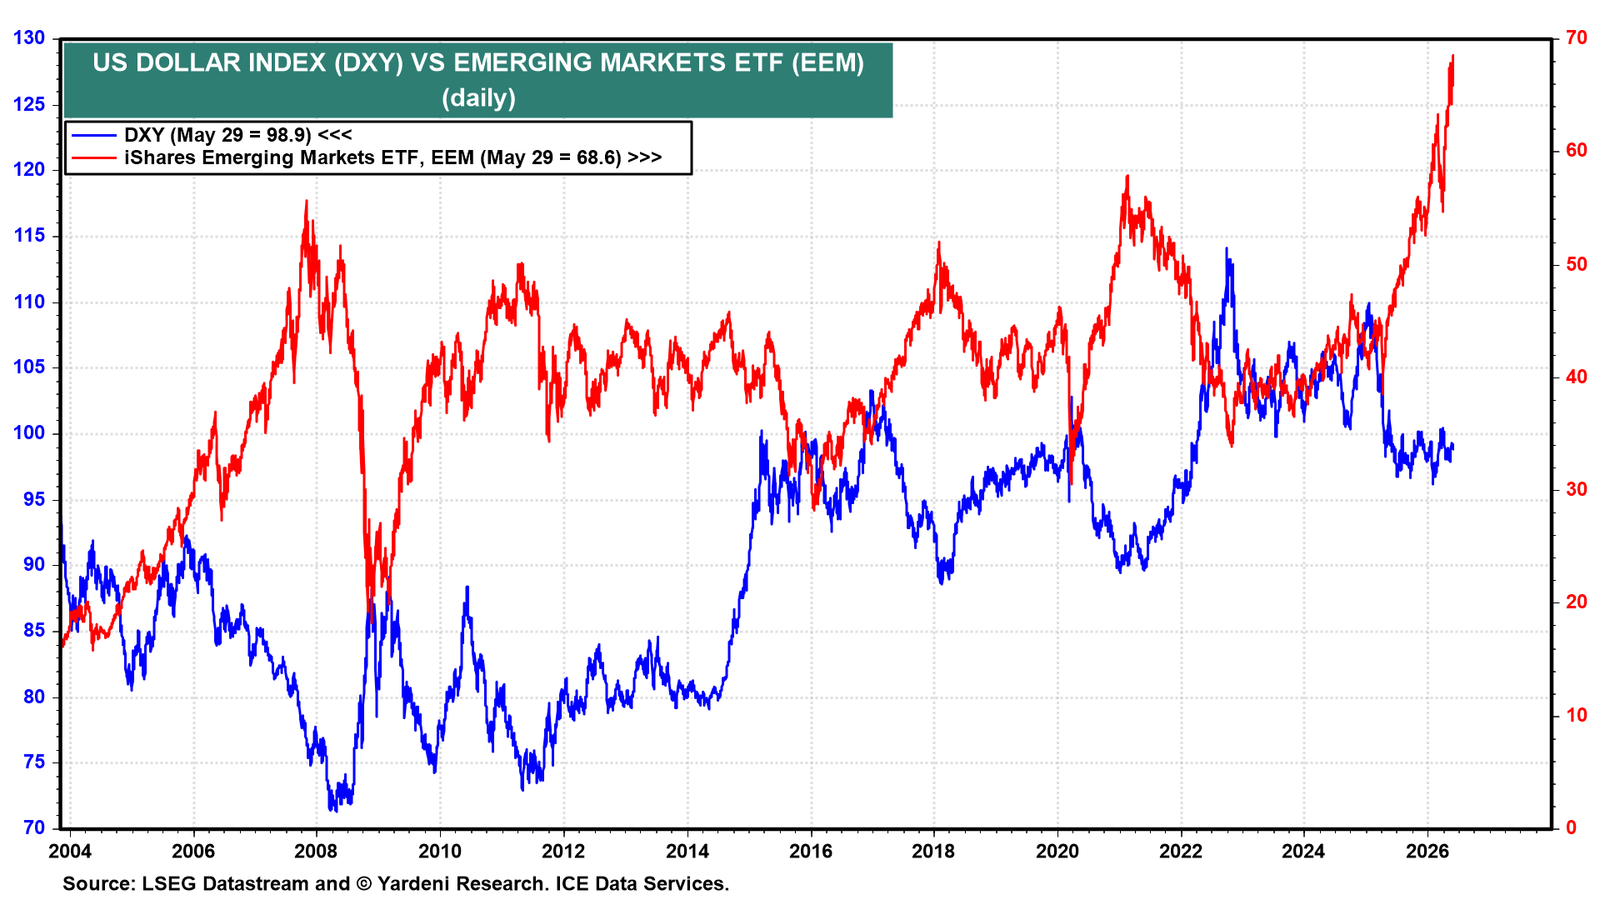
The classic inverse correlation between EM equities and the DXY dollar index isn't evident this time, as the former soars while the latter remains firm (chart). The AI trade, not currency tailwinds, is doing the work for EM right now.
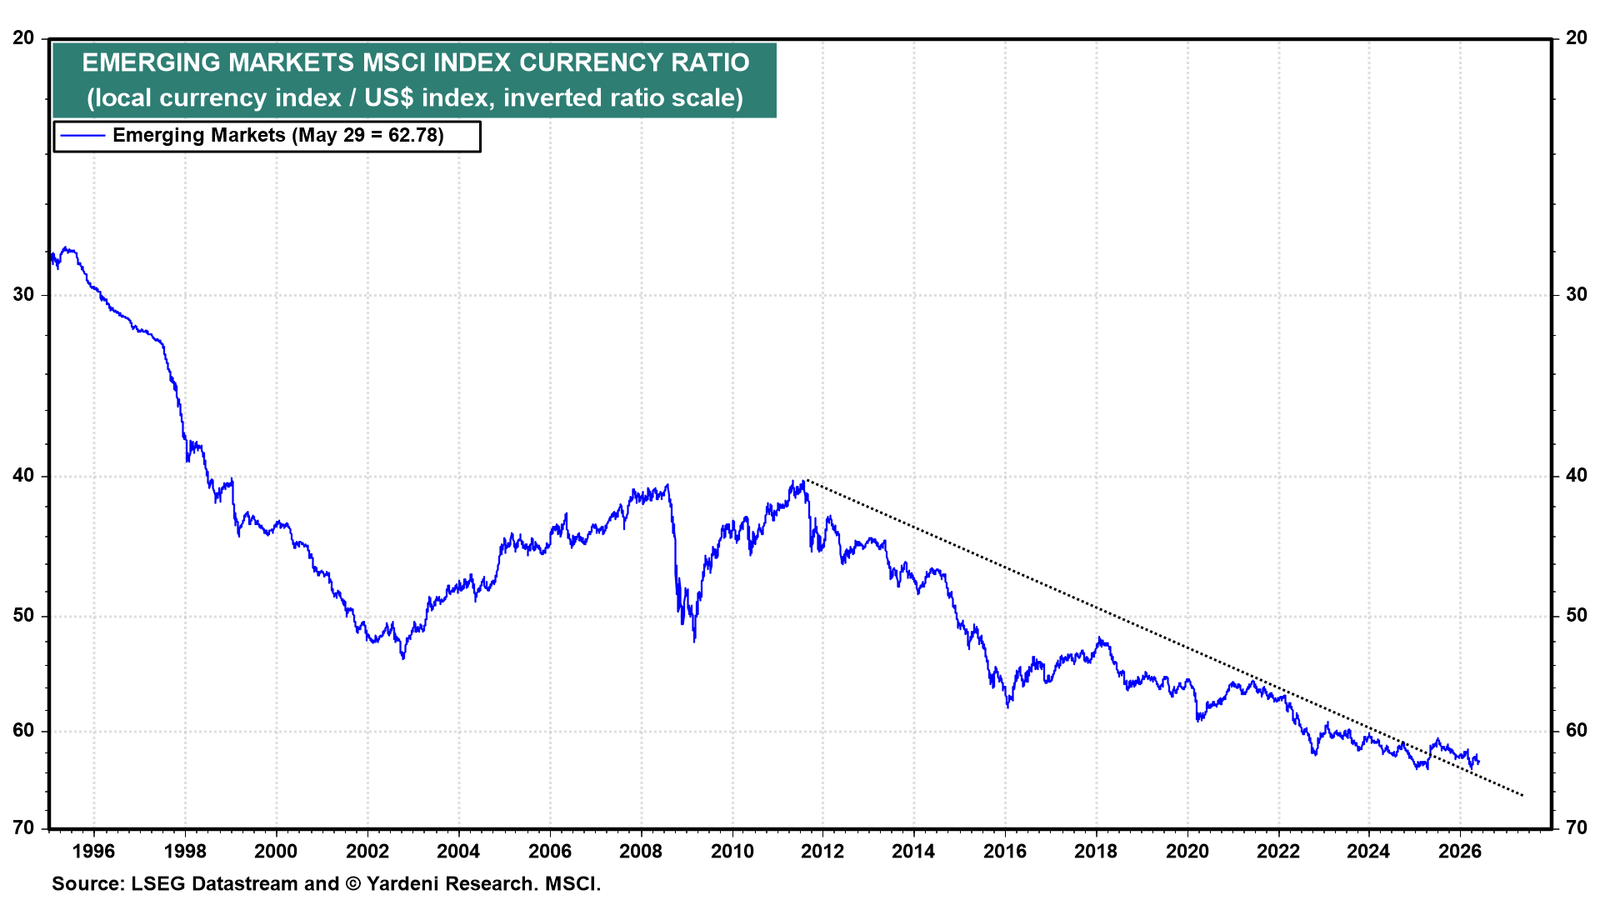
The EM MSCI Currency Ratio has been declining since 2011 (chart). It looked set to break out of its downtrend in early 2025. Last year's tariffs and this year's war pushed the ratio back down. We watch this ratio as an EM stress indicator, recalling the EM currency crises during the 1990s.
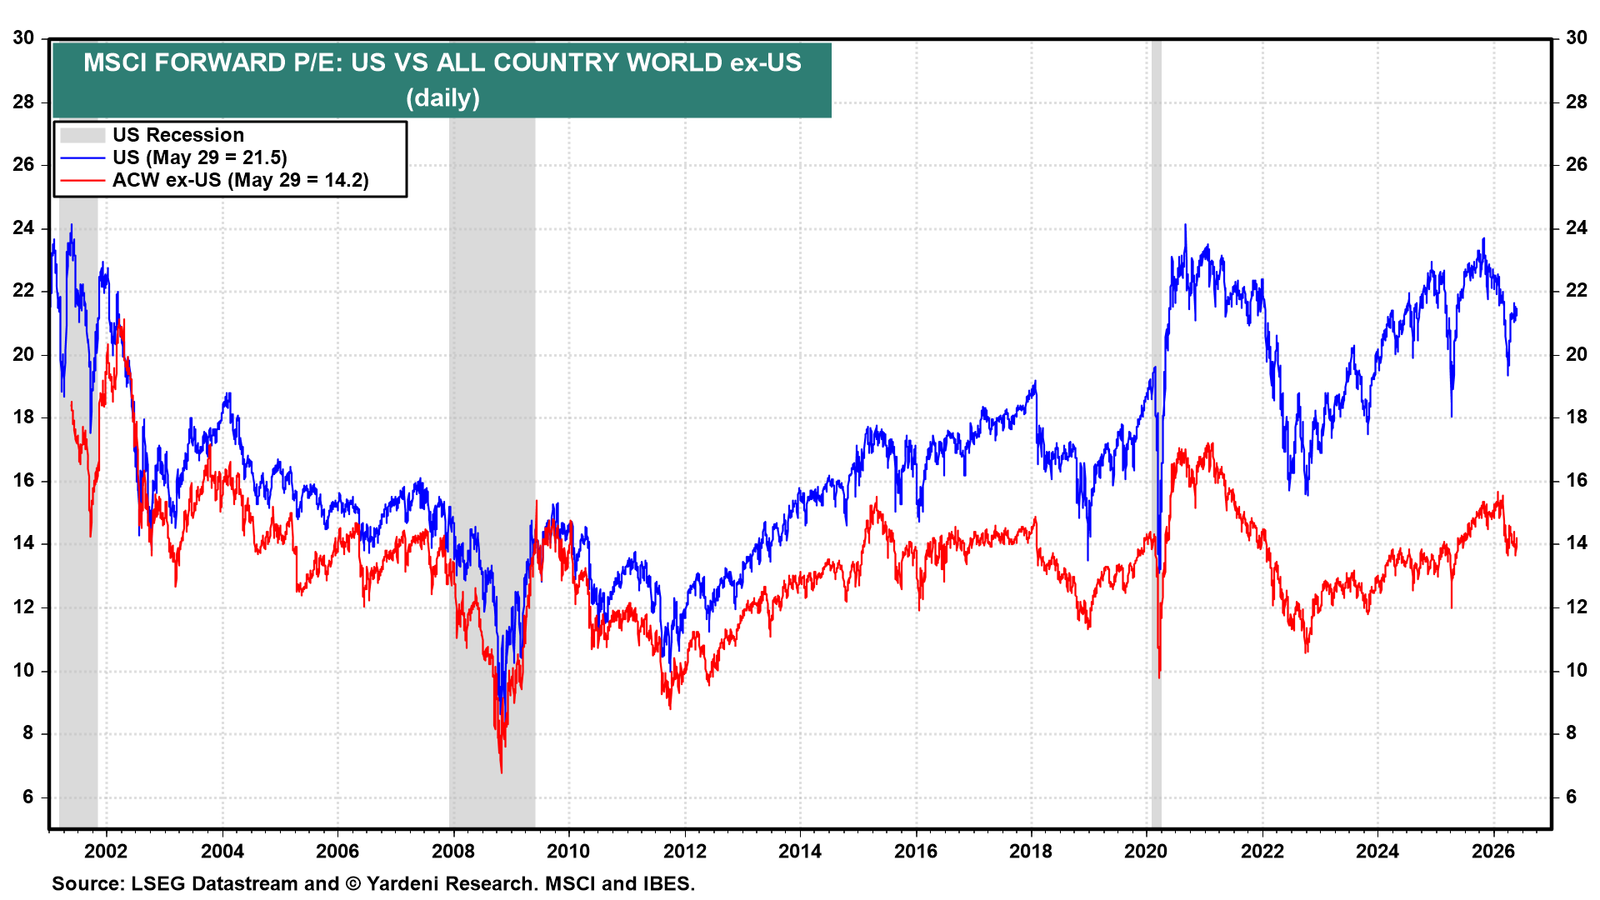
(3) Global inflation. US CPI goods inflation rate has been tracking the FRBNY Global Supply Chain Pressure Index closely, especially in recent months (chart). Goods inflation is a global supply-chain story, not just a US one. The chart suggests inflation may prove to be a more troublesome global issue than the markets are currently discounting.