The "Dollar Debasement Trade" was a big theme in global financial markets last year. The thesis was that President Donald Trump's aggressive tariff hikes would revive inflation in the US and undermine foreigners' confidence in the US's reliability, especially among America's allies. In addition, the president's attacks on Fed Chair Jerome Powell threatened the Fed's independence and heightened concerns that a compliant Fed would keep rates artificially low to finance widening federal budget deficits. In this scenario, foreign investors would respond by selling the US dollar and US securities in favor of foreign currencies and securities, gold, Bitcoin, commodities, and other non-US assets. The result would be a bad combination of rising US Treasury bond yields, falling US equity prices, and a weaker dollar. Following Trump's Liberation Day tariffs on April 2, 2025, and his attacks on the Fed, that scenario briefly materialized, with the dollar falling, equities declining, and yields rising.
We were rightly skeptical about this so-called "Sell America Trade." As tariff concerns eased and recession fears abated, the debasement narrative lost momentum. Its credibility might have ended last Wednesday, when Fed Chair Kevin Warsh made price stability his top priority at his first FOMC monetary policy meeting. Traders rapidly priced in two rate hikes by early 2027, bolstering the dollar.
Consider the following developments suggesting that the debasement trade is kaput.
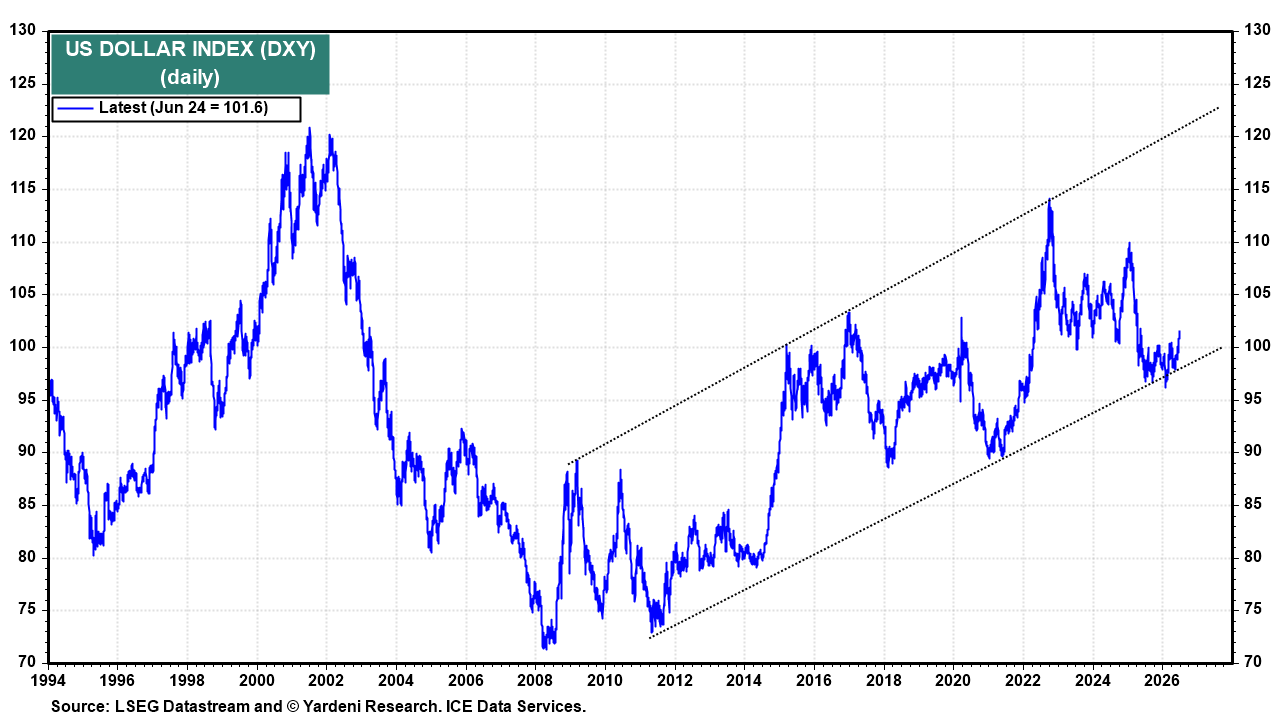
(1) Currencies. The dollar index (DXY) found support at the lower end of its rising channel since last year (chart). It has strengthened since last week's FOMC meeting. DXY is a fixed-weighted basket of the US dollar against six major foreign currencies, with the euro and yen having the largest weights at 57.6% and 13.6%, respectively.
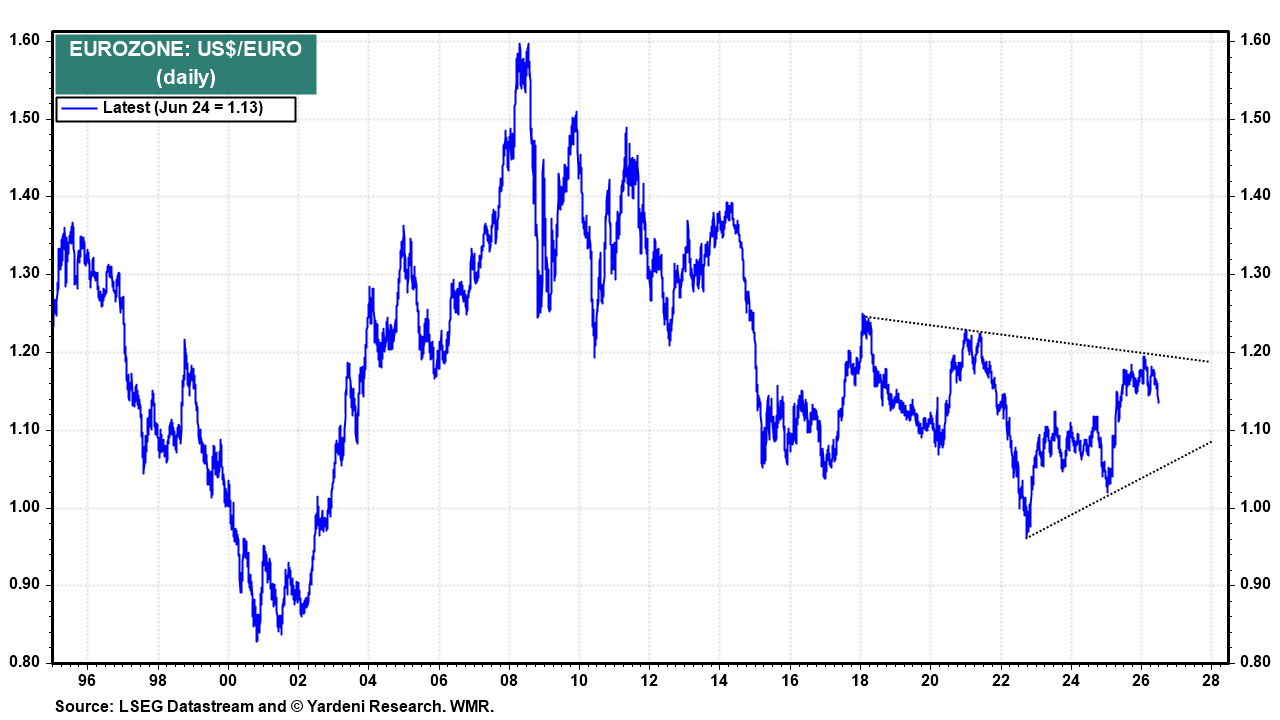
The euro has been weak in recent days, even though the ECB raised its official rate by 25bps on June 11 (chart). The recent decline in energy costs should benefit Europe more than the US, yet the euro has still fallen since last week.
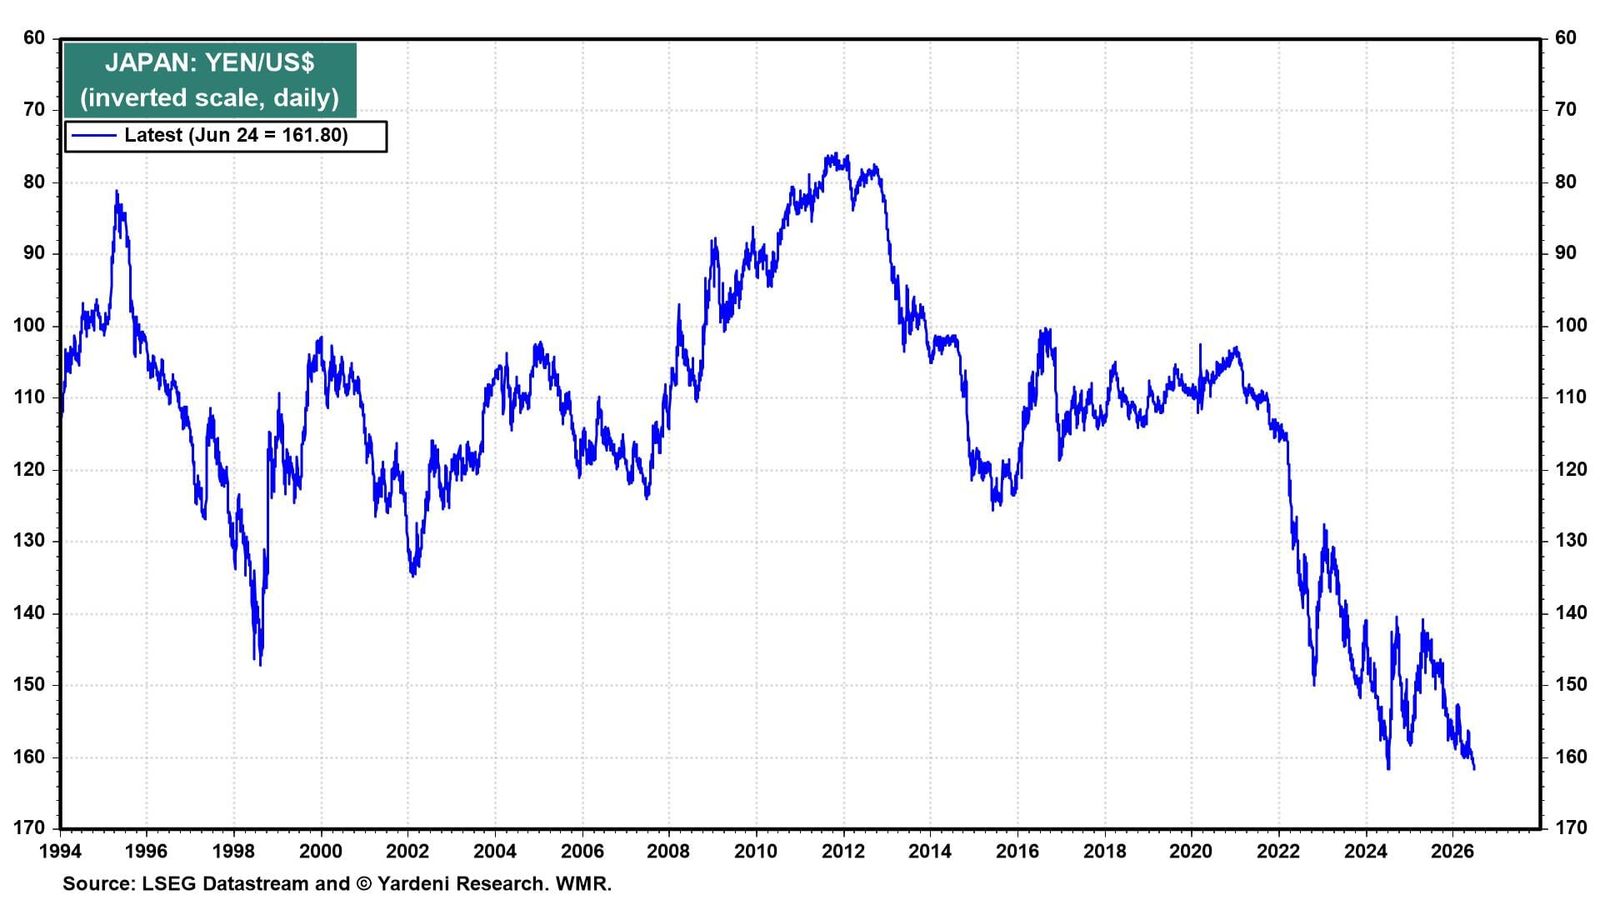
The BOJ also raised its official rate by 25bps on June 16, yet the yen just dropped back to levels not seen since December 1986 (chart)
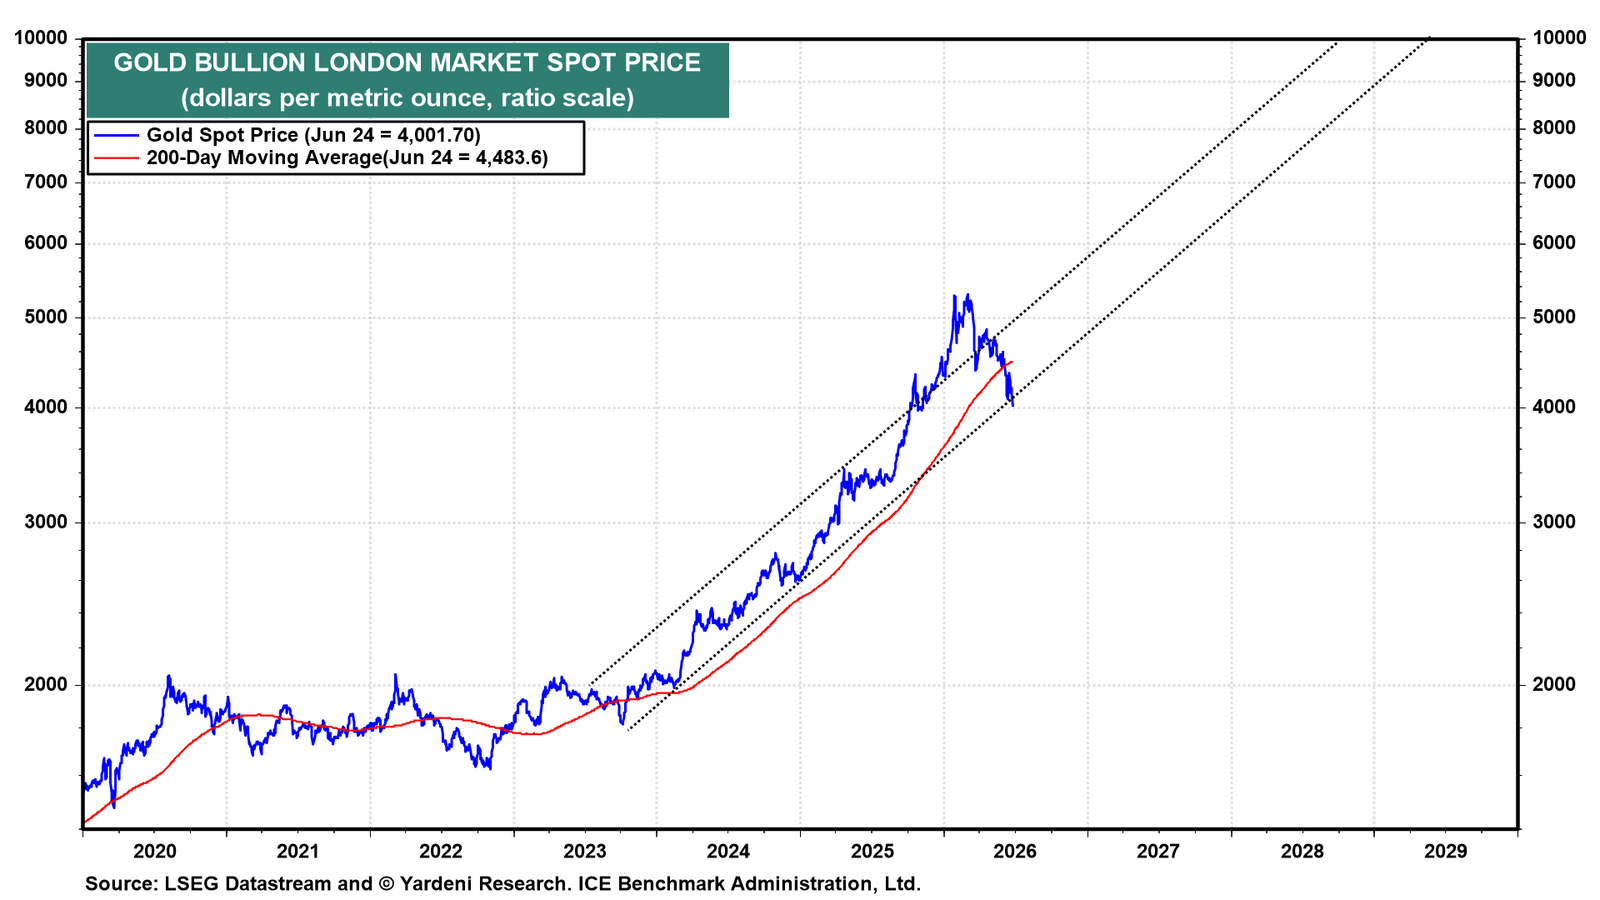
(2) Gold & Bitcoin. The Fed's new tightening bias and the recently rising dollar have weighed heavily on the gold price. After a record-breaking run to a new high of $5,589 per ounce on January 28, the price of gold began to fall when the latest Middle East war began at the end of February (chart). Some central banks reportedly were forced to sell their gold reserves to defend their weakening currencies. The subsequent hawkish Fed recalibration under Warsh increased the cost of holding gold. We think it has found support at $4,000. If that doesn't hold, the next level of support is around $3,500. We are reducing our year-end forecast from $ 5,500 to $ 5,000.
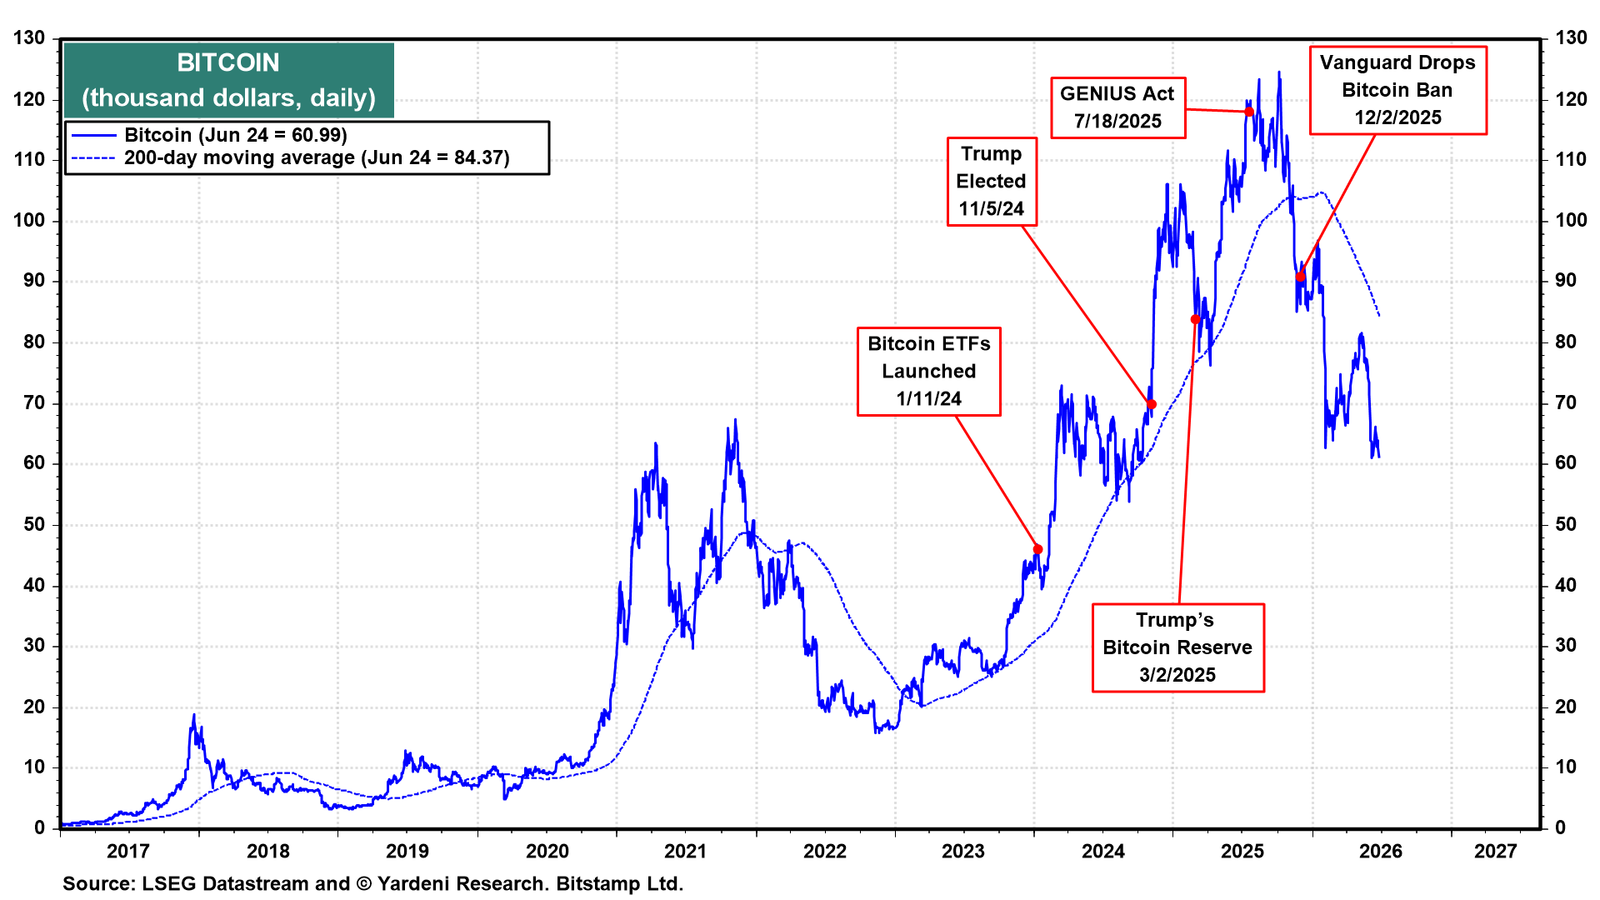
After peaking above $120,000 on a series of crypto-friendly catalysts late last year, Bitcoin has been cut in half to $60,990 (chart). It certainly doesn't pose a serious threat to the US dollar.
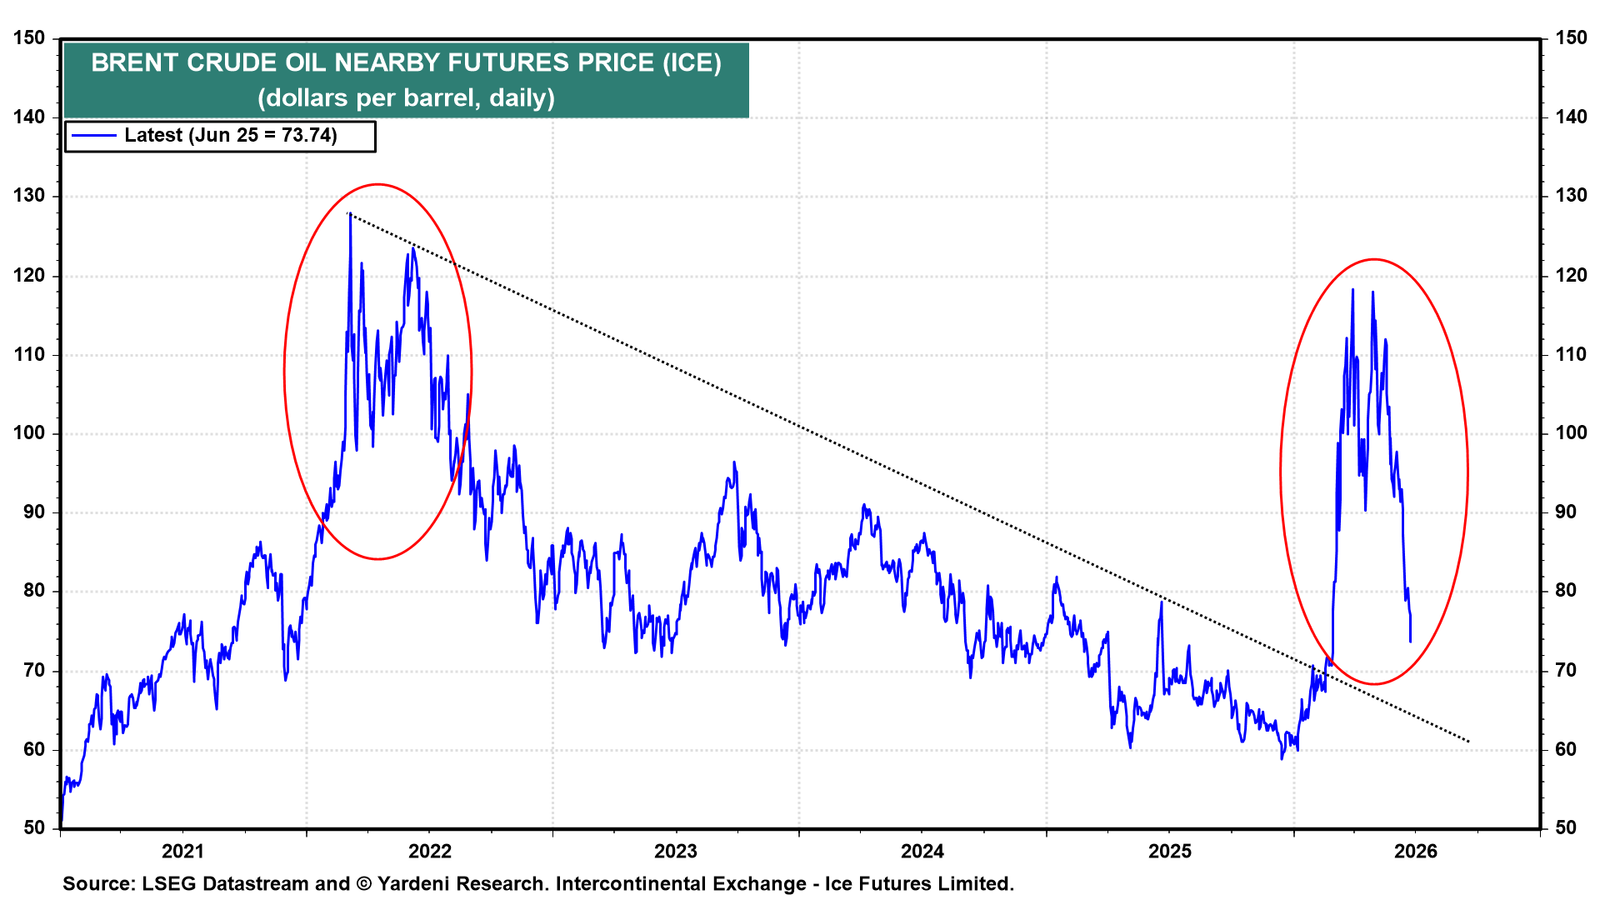
(3) Commodities. Brent crude plunged following the reopening of the Strait of Hormuz, which returned supply to the market and unwound much of the geopolitical risk premium (chart). Previously, we observed a bear market in oil from mid-2022 until the war began at the end of February 2026. We attributed it to weakening demand out of China. In the past, DXY and Brent crude oil prices tended to be inversely correlated.
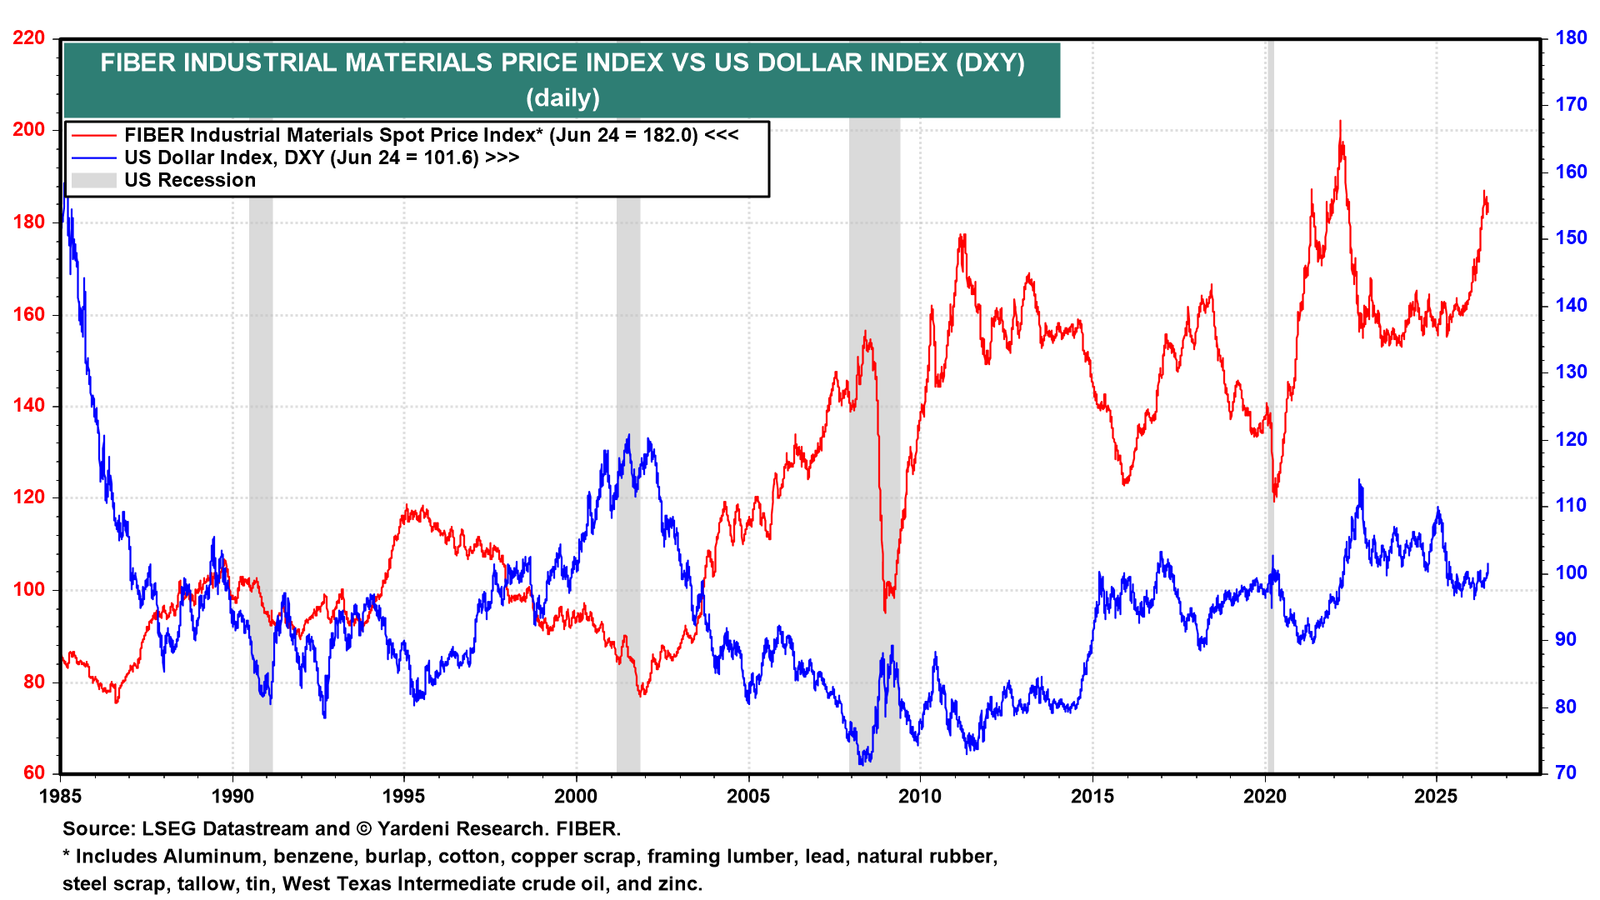
The FIBER Industrial Materials Spot Price Index seems to be peaking. In the past, the DXY has also been inversely correlated with commodity prices. (chart).
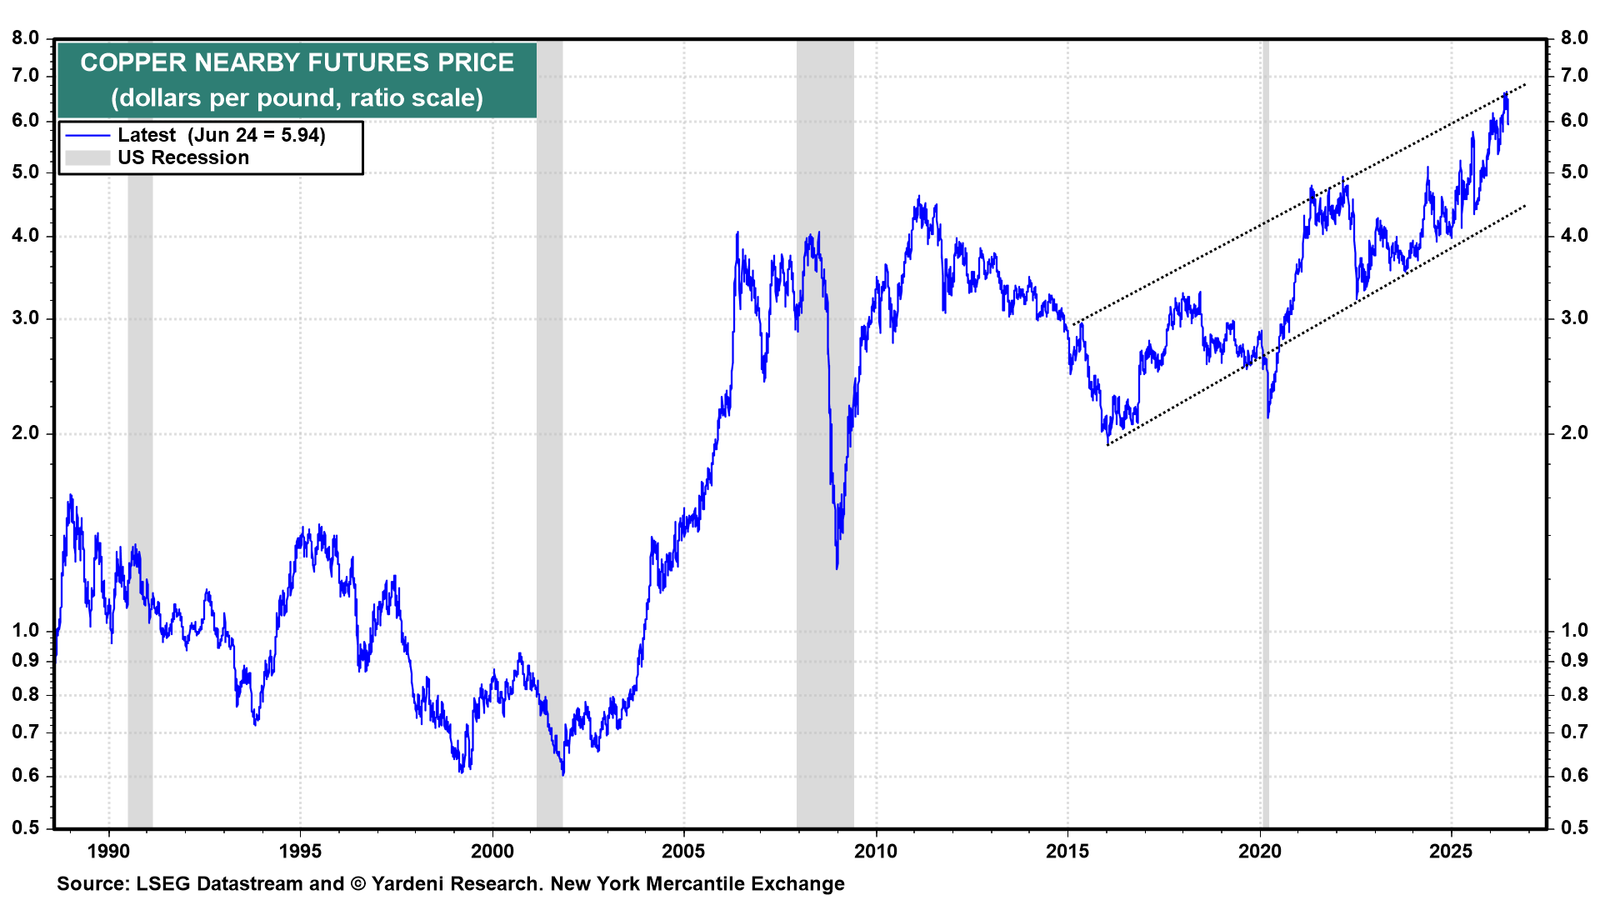
Meanwhile, copper's strength since last year is best explained by demand for AI infrastructure and is not indicative of a Sell America Trade (chart).
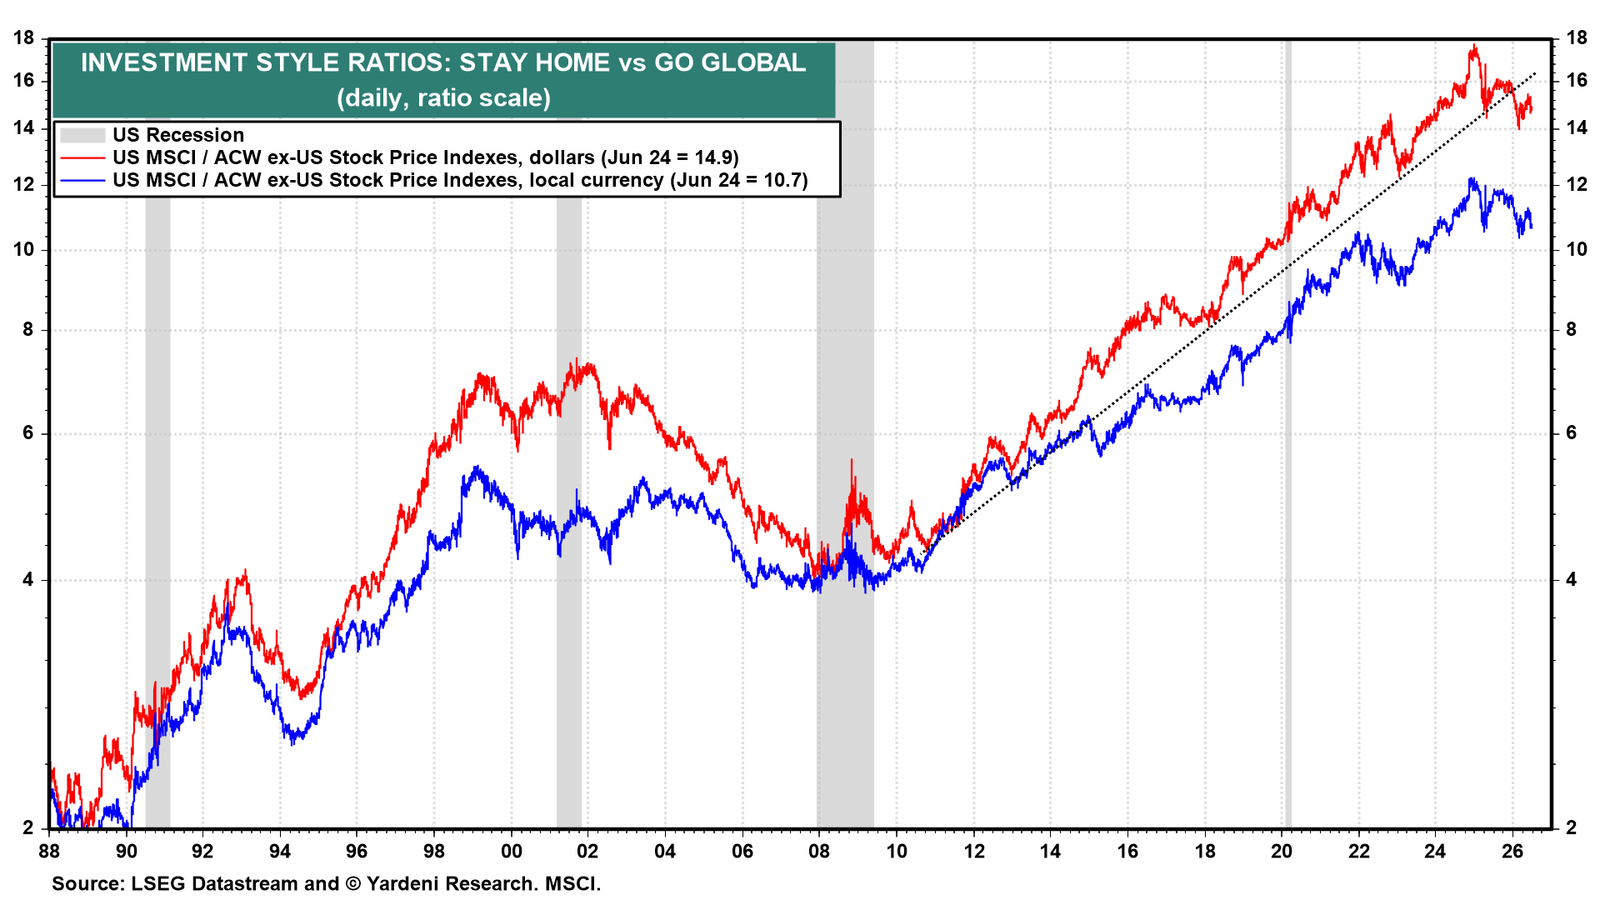
(4) Stocks. The downtrends in the Stay Home versus Go Global ratios since early last year appear to confirm the Sell America story (chart). We think it has more to do with global portfolio rebalancing, as the US now accounts for over 60% of the All Country World MSCI's market capitalization.
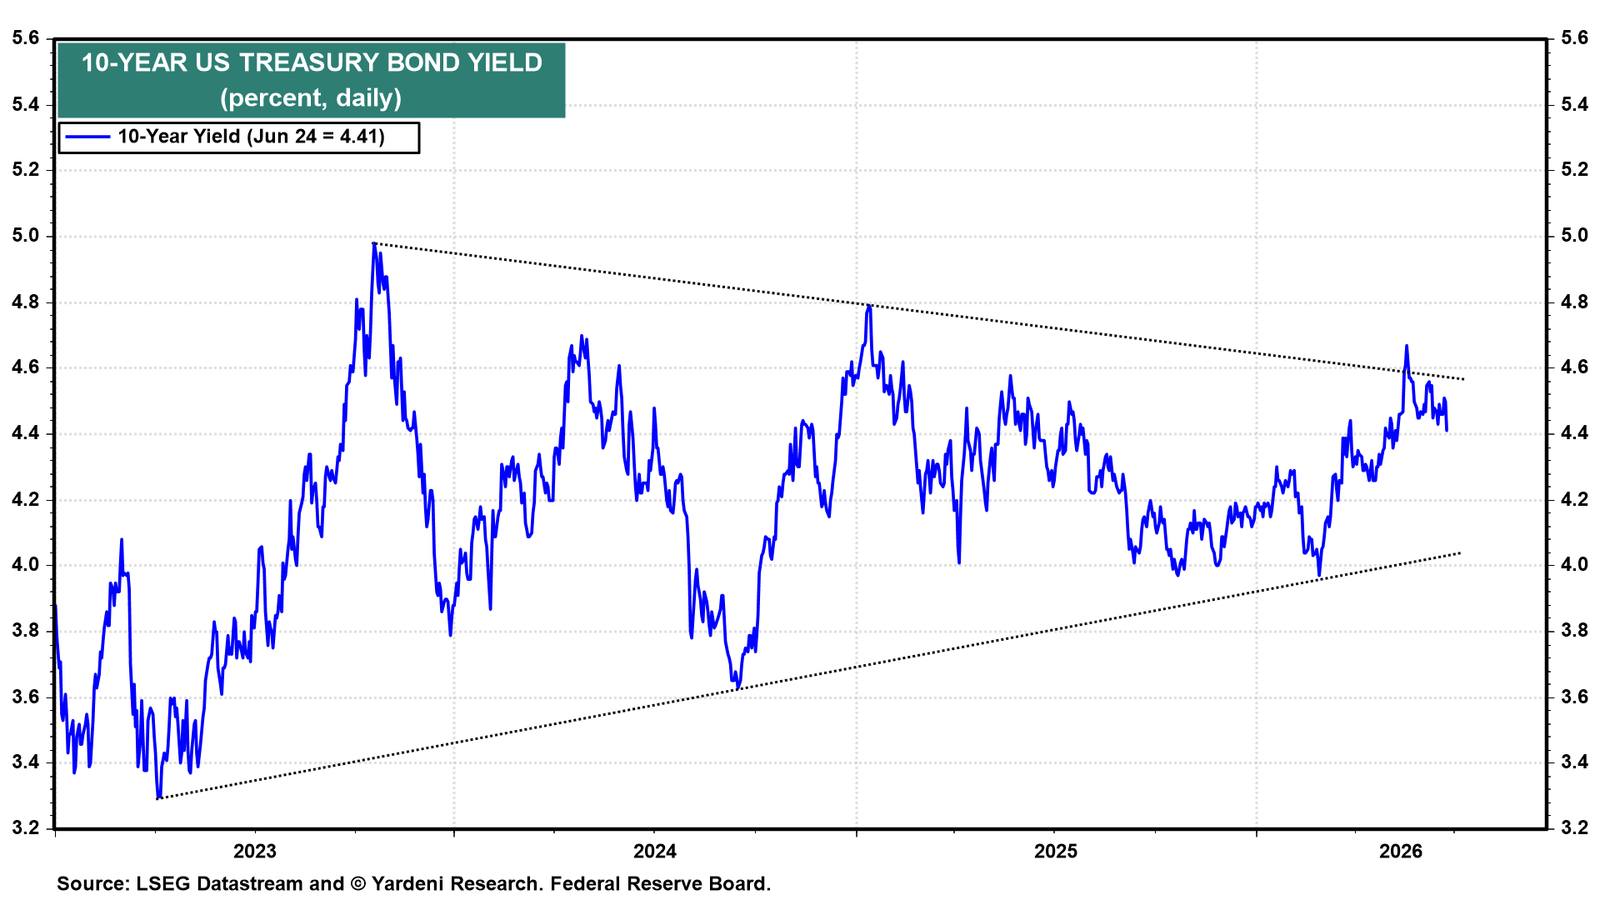
(5) Bonds. The US 10-year Treasury bond yield has remained range-bound, contrary to the bearish implications of the Sell America narrative (chart).
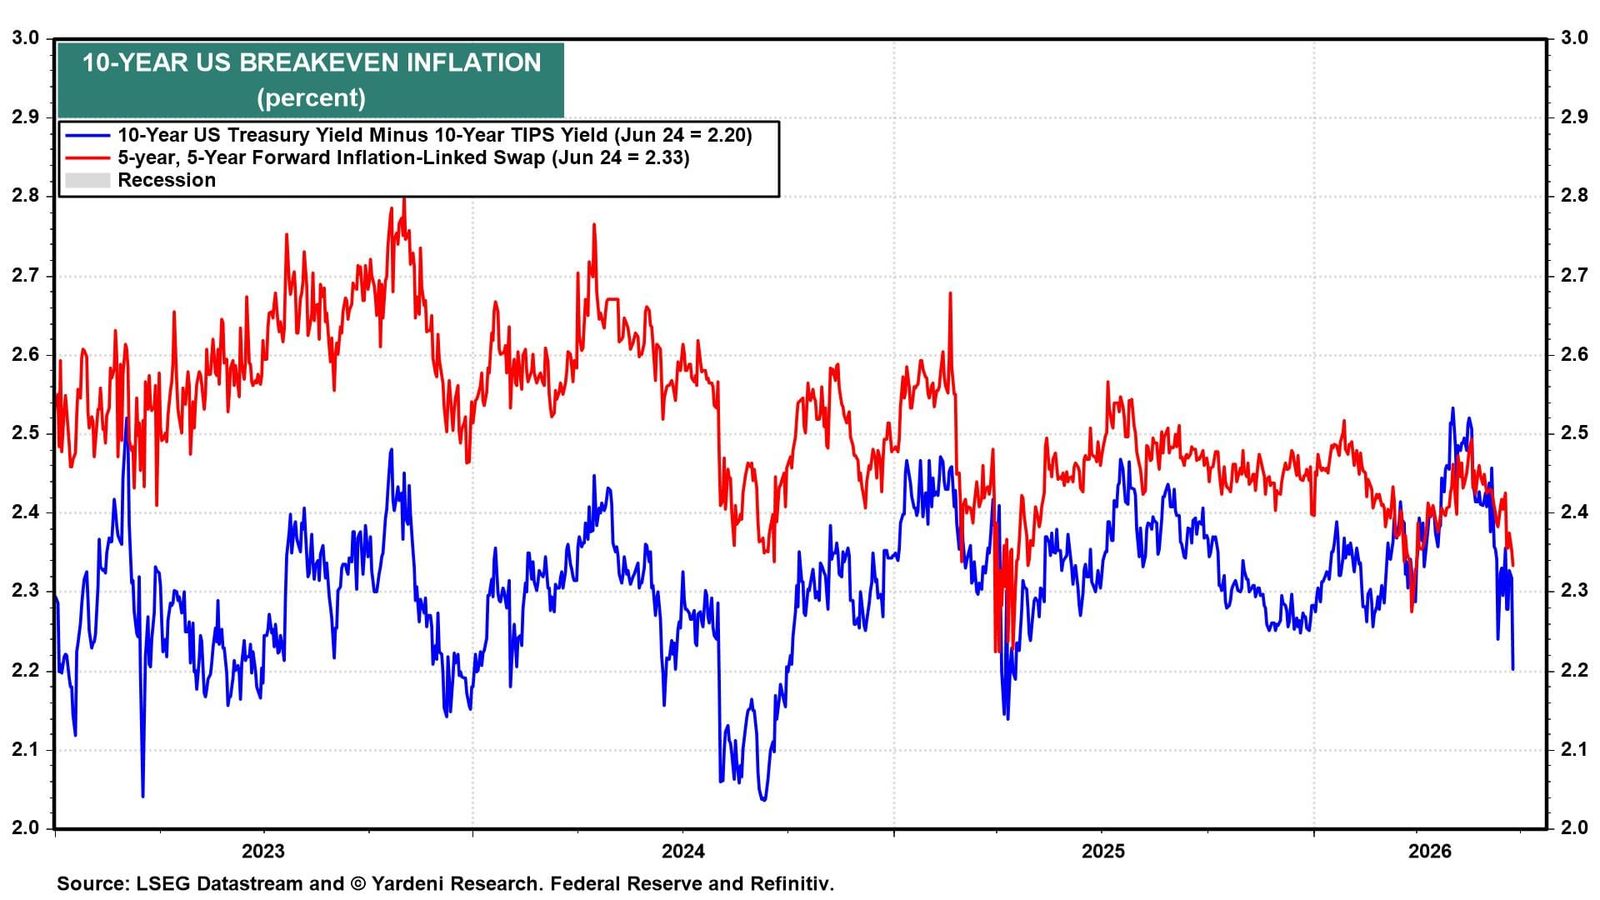
Warsh's commitment to price stability, combined with the plunge in oil prices, is restoring confidence that inflation will moderate in the coming months, as shown by a decline in breakeven inflation rates (chart).
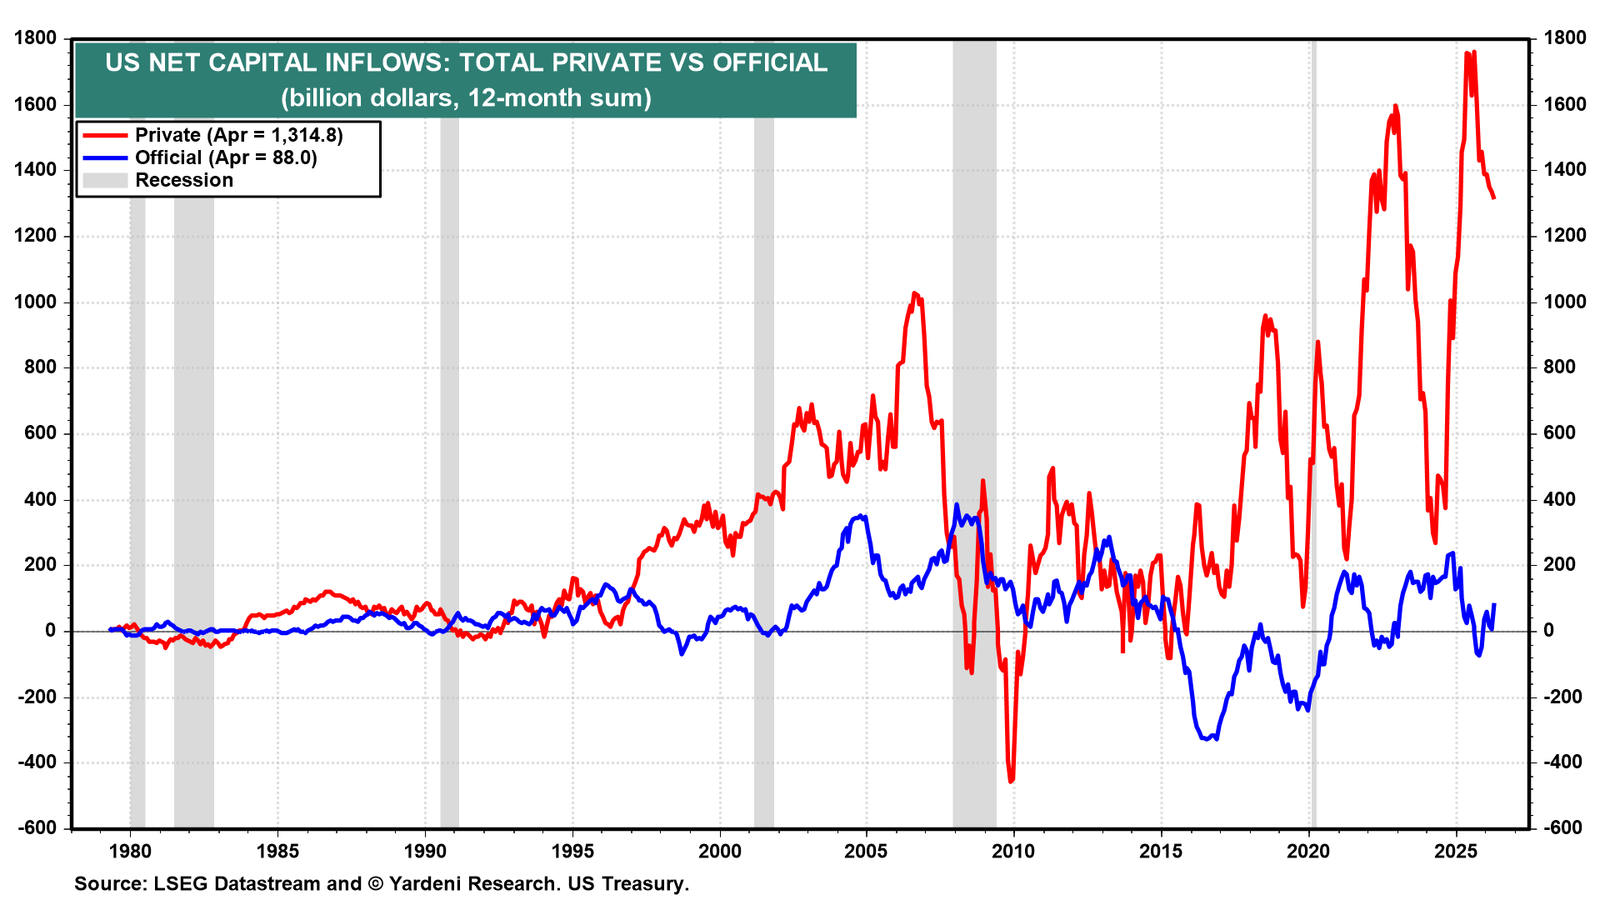
(6) Capital flows. The Dollar Debasement Trade predicted that foreigners would be selling US securities. The US Treasury International Capital (TIC) data show the opposite. Private net capital inflows into the US remained robust at $1.3 trillion on a 12-month basis through April (chart). Official accounts showed net capital inflows at only $88.0 billion over the same period. They certainly haven't been net sellers.