I. Blue skies ahead for earnings?
We are now seven years into our Roaring 2020s thesis, which remains our base case for the rest of the decade, and it has played out very well so far. When we first introduced the idea in August 2020, the prospect of another Roaring '20s sounded a bit delusional. We argued that, as in the 1920s, rapidly proliferating technologies would drive a productivity boom that would support stronger economic growth while containing inflation, boosting real wages, widening profit margins, and lifting corporate earnings.
Since the beginning of the current decade, the economy's resilience has repeatedly defied the naysayers, as productivity growth has increased and corporate earnings have continued to climb. With only three full years left in the decade, one of the clearest manifestations of our Roaring 2020s thesis has been what we call FEMO, or Fabulous Earnings Momentum.
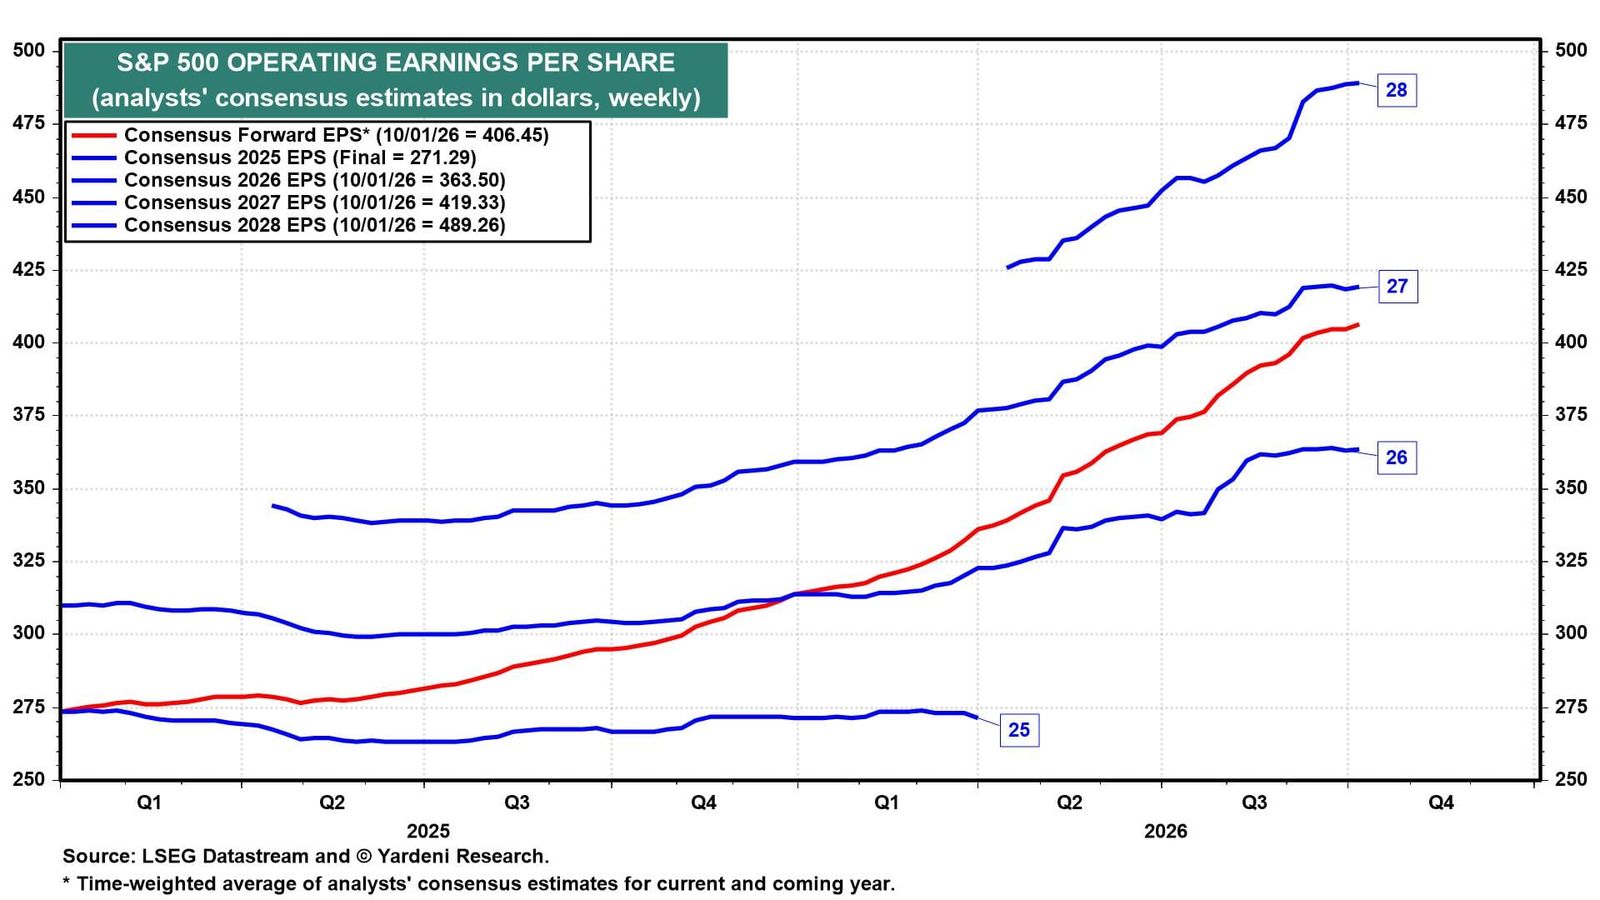
FEMO is clearly visible in industry analysts' earnings expectations. They currently expect S&P 500 operating earnings per share to rise to about $364 per share in 2026 and $419 in 2027, implying growth of roughly 15% in both years (chart). Toward the end of Q3 each year, we add another year to our Earnings Squiggles framework. This year’s addition is 2028, with earnings projected to rise another 17% that year to about $489 per share.
For now, the analysts are more bullish than we are about earnings prospects over the remainder of the decade. We are projecting $450 per share in 2028, $475 in 2029, and $500 in 2030. If they are right, our S&P 500 target of 10,000 will be achieved well before the end of 2029!
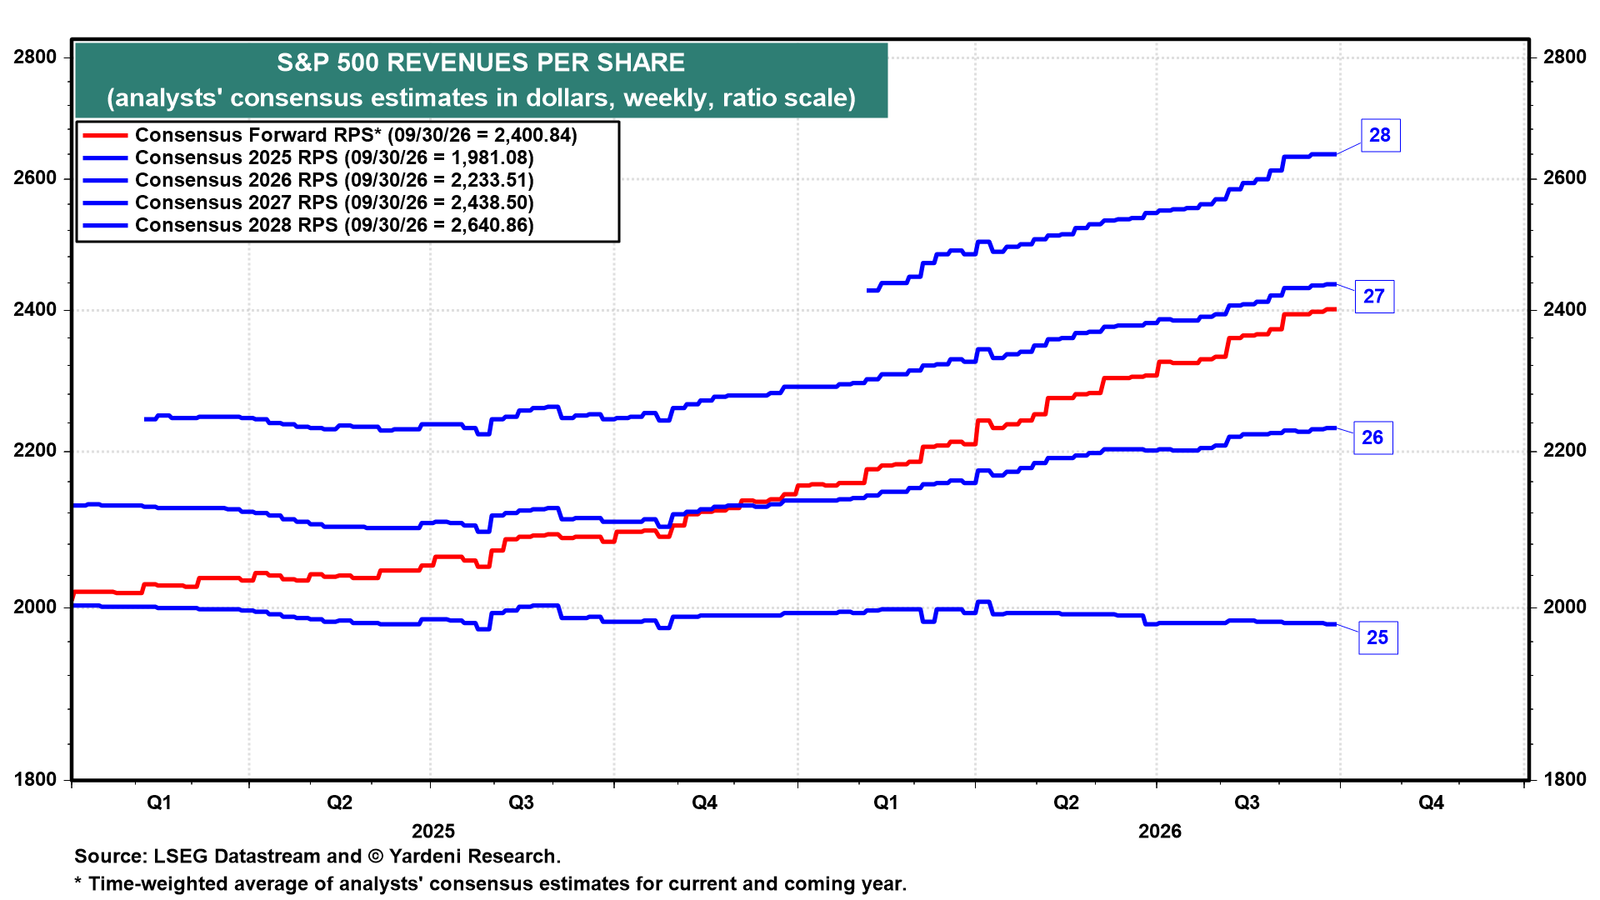
The extended earnings boom is driven by strong revenue growth expectations. Industry analysts expect S&P 500 revenues per share to rise 12.7% in 2026, 9.2% in 2027, and another 8.3% in 2028 (chart). Those expectations seem too exuberant to us.
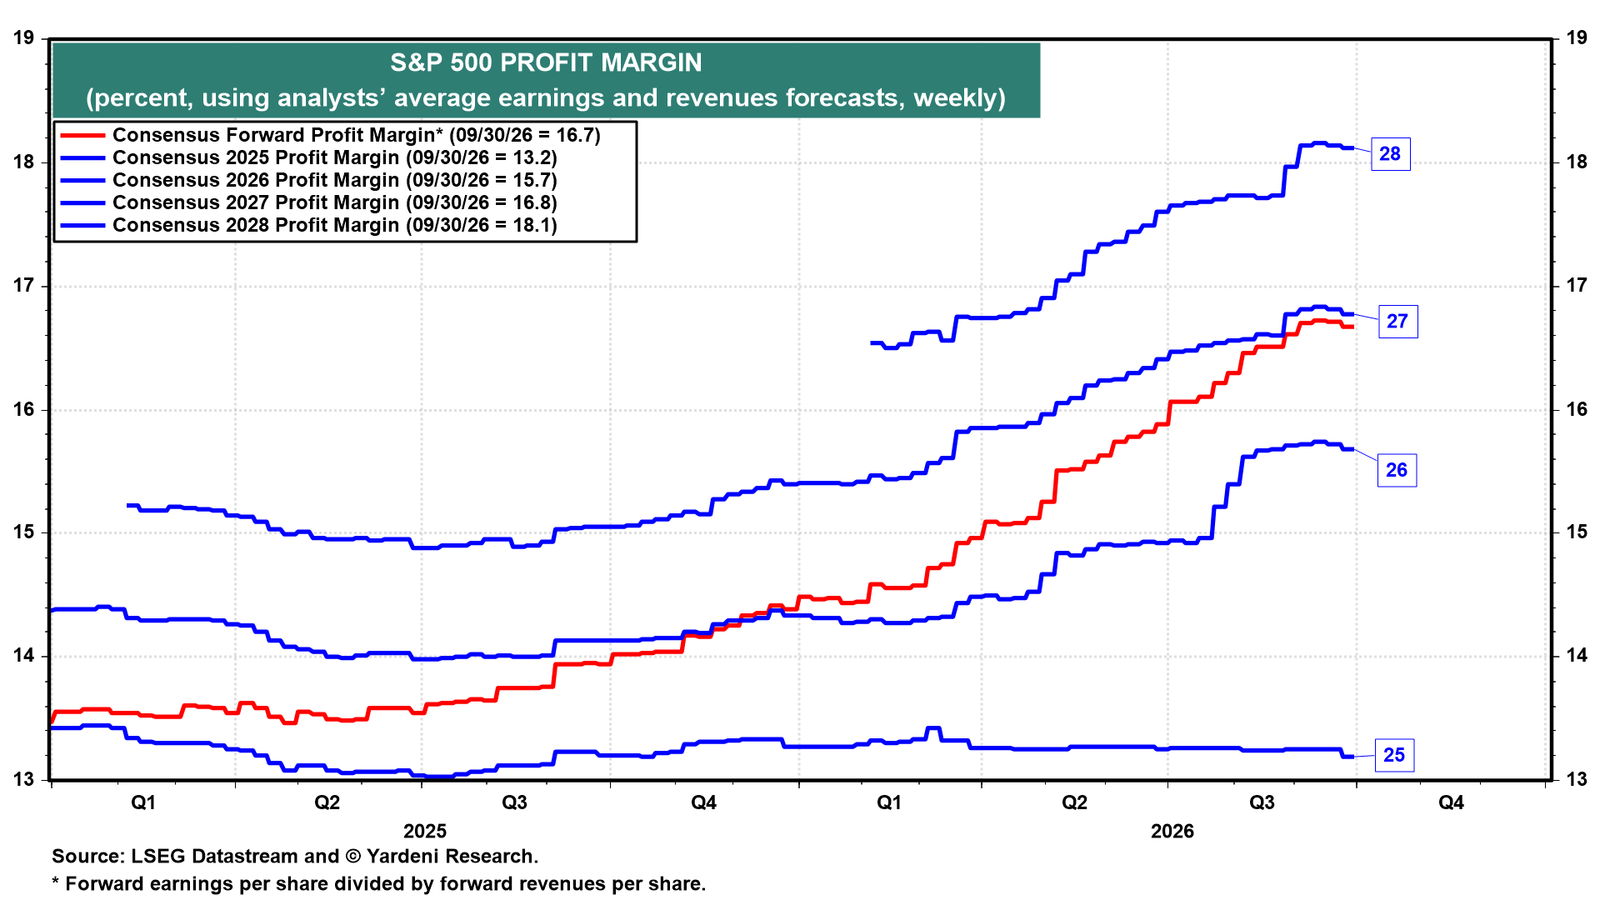
Profit margins provide the other driver of the earnings story. Analysts expect the S&P 500 profit margin to rise from 13.2% in 2025 to 15.7% this year, 16.8% in 2027, and a record 18.1% in 2028 (chart). That is what we would expect in our Roaring 2020s scenario, with stronger productivity growth widening profit margins.
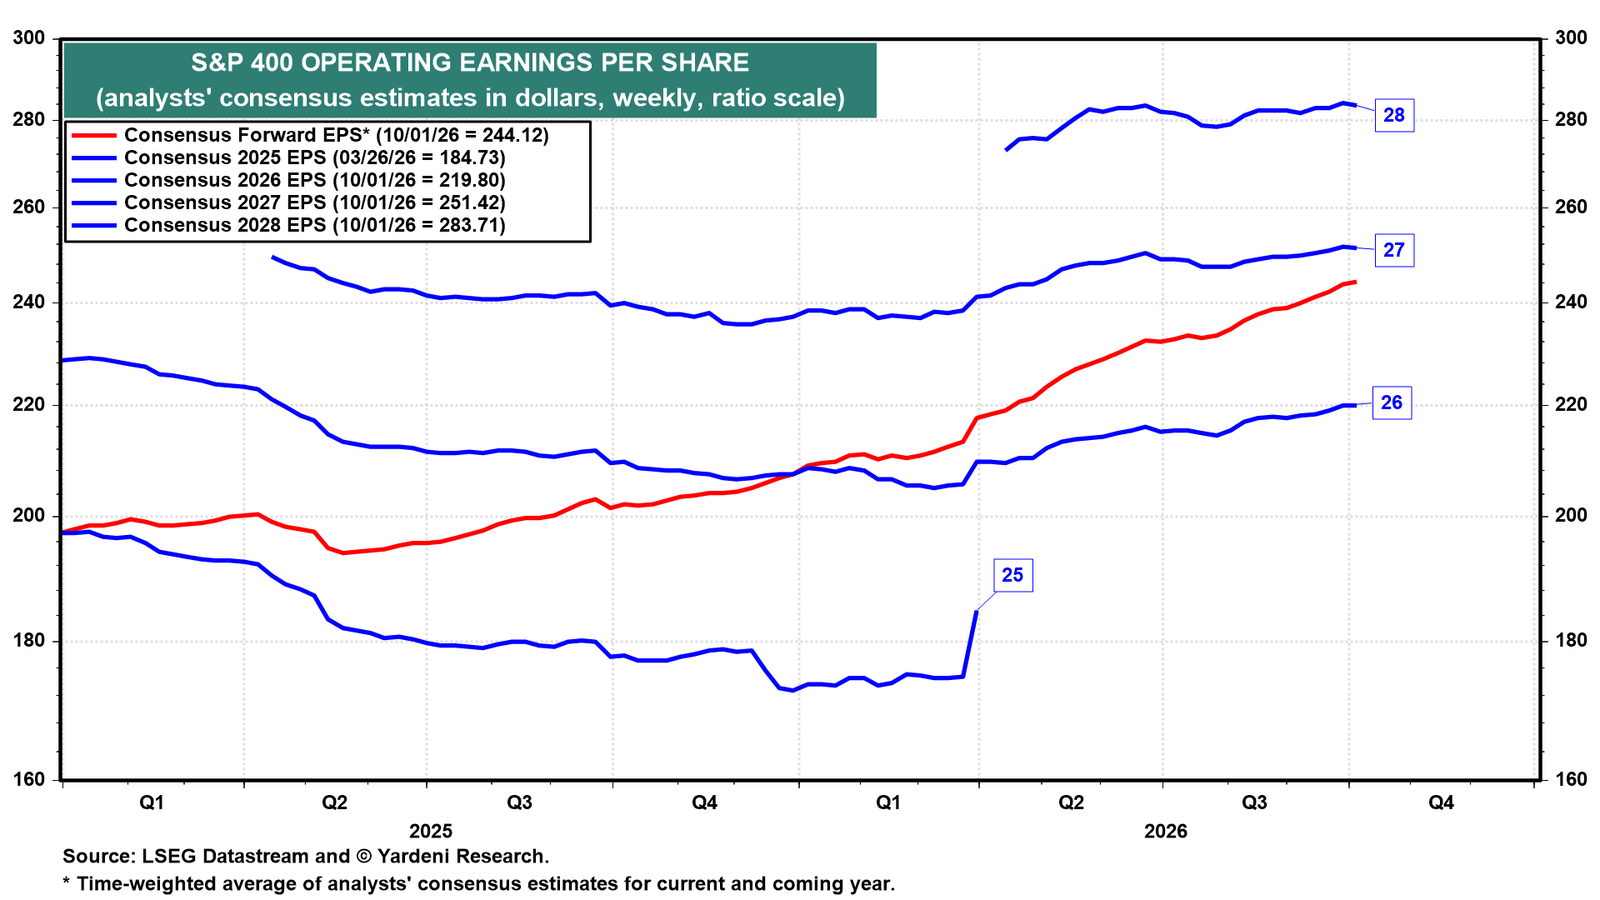
The earnings outlook is strong beyond the S&P 500 as well. Industry analysts expect S&P 400 MidCap operating earnings per share to rise roughly 19% in 2026, 14% in 2027, and 13% in 2028 (chart).
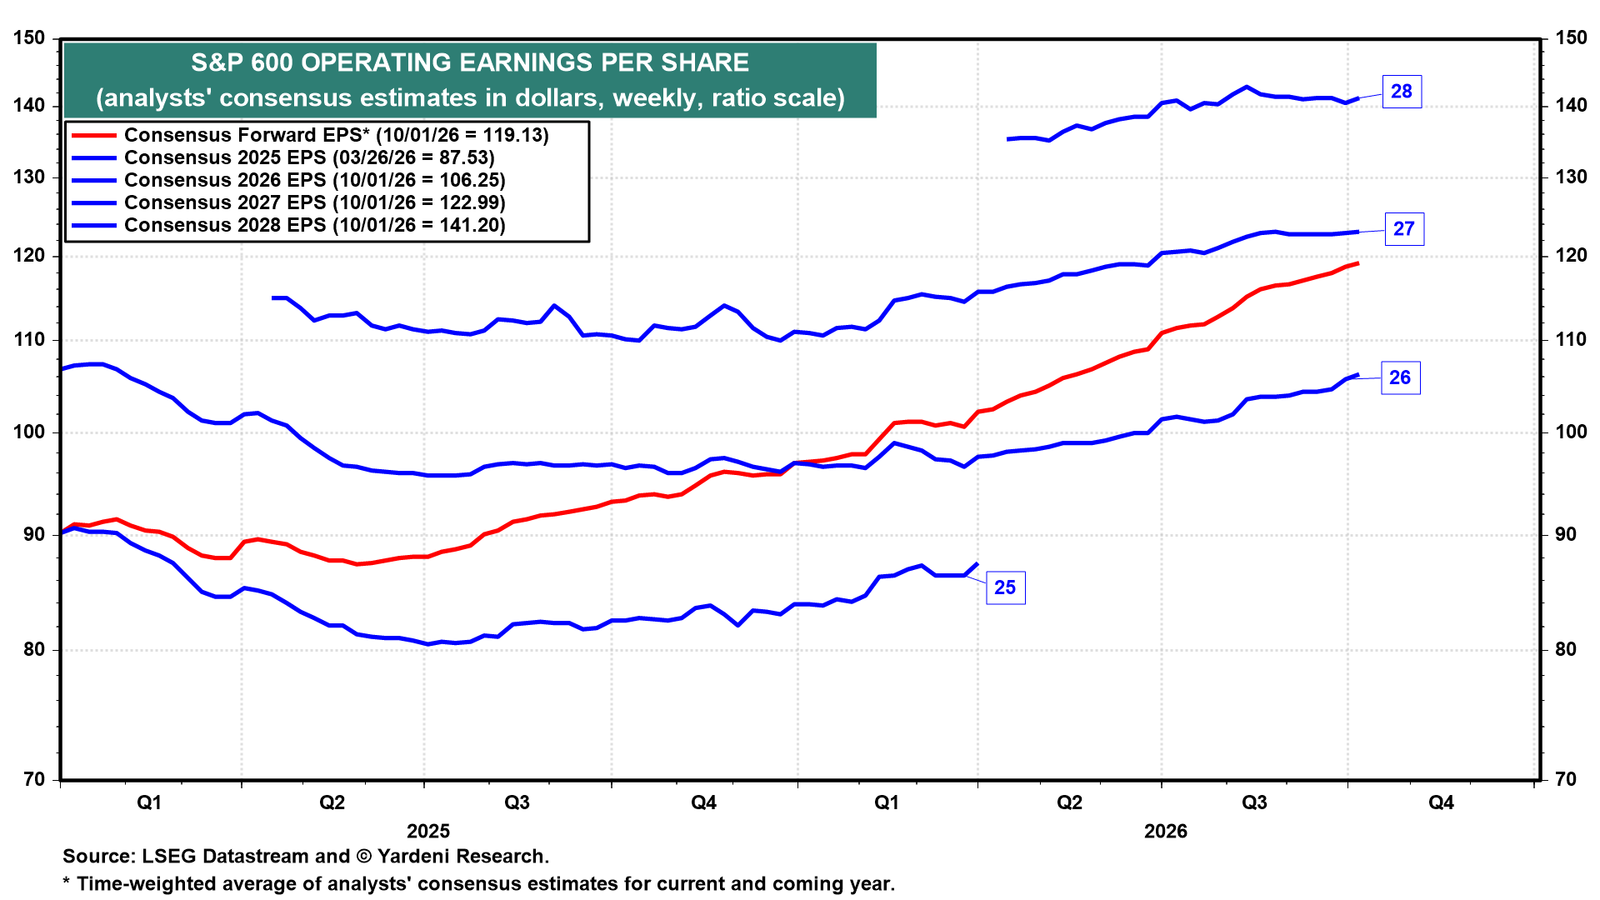
S&P 600 SmallCap earnings are expected to increase about 21% this year, 16% in 2027, and 15% in 2028 (chart). That suggests FEMO is broad-based.
II. Blue skies ahead for the economy?
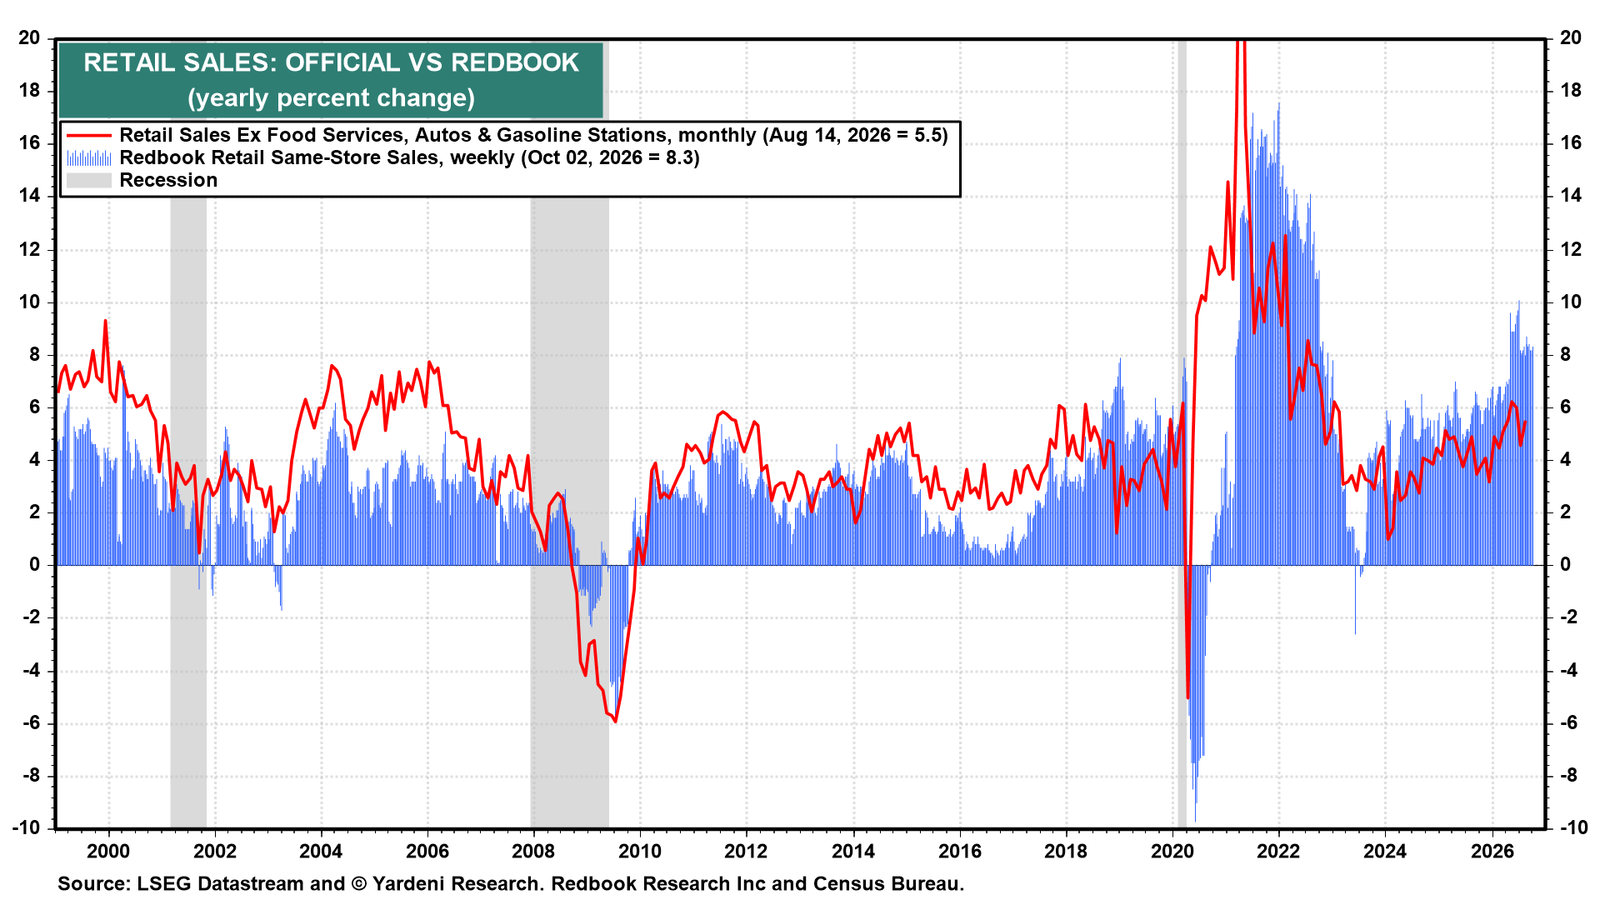
(1) Consumer spending. The latest Redbook data provide yet another sign of continued strength in consumer spending. Redbook same-store sales rose 8.3% y/y during the week of October 2, well above the 5.8% average for 2025 and underscoring the consumer’s continued resilience (chart).
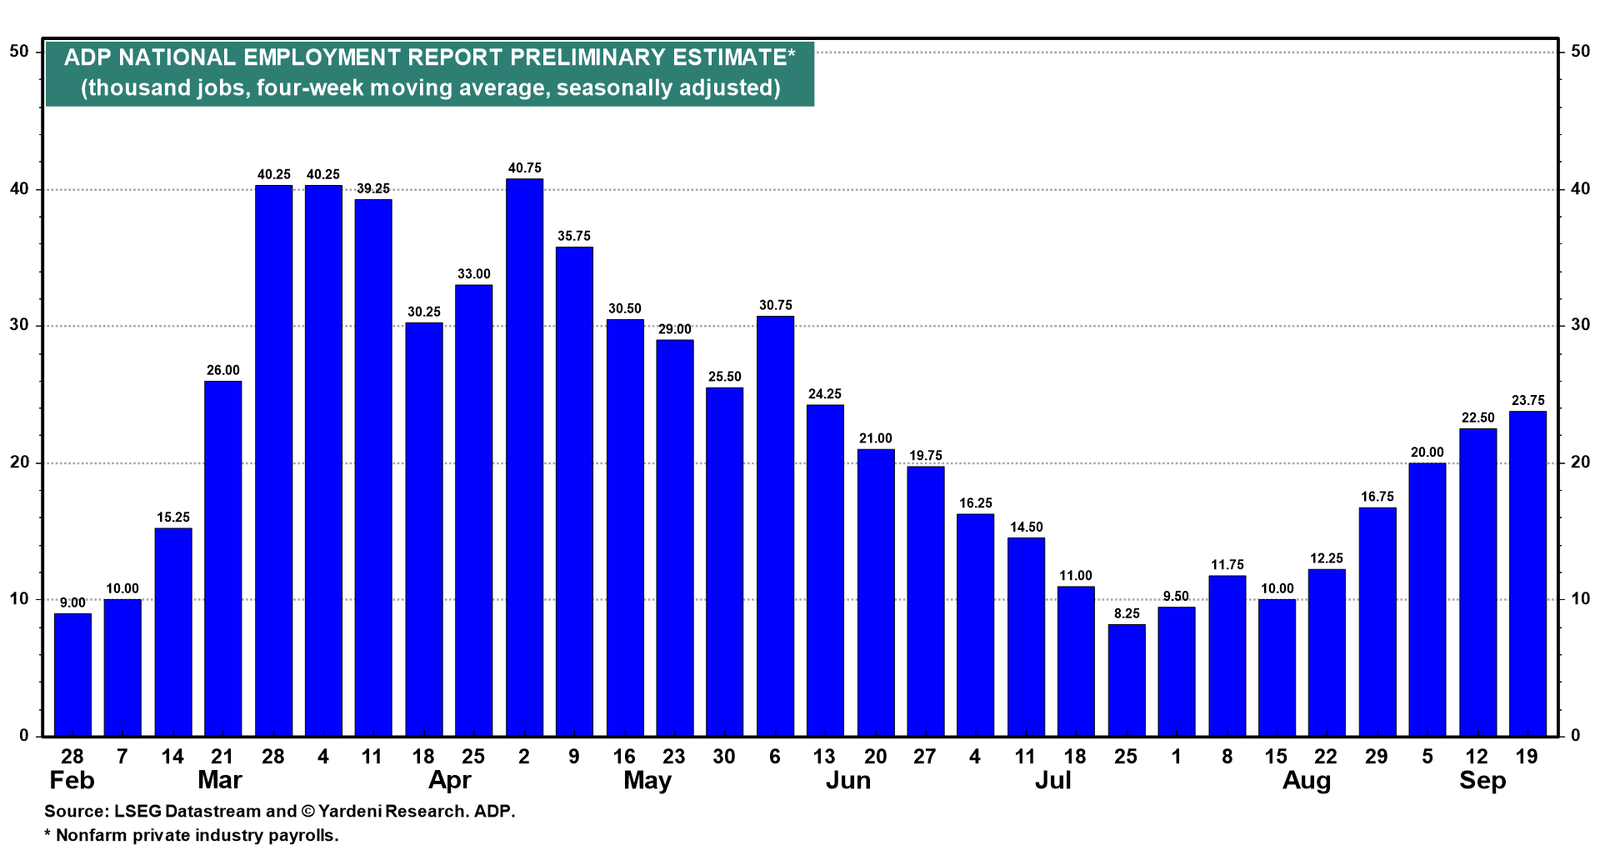
(2) Labor market. ADP estimates that private-sector payrolls rose 23,750 in the week through September 19, up from an upwardly revised 22,500 the prior week and marking the fifth consecutive acceleration in weekly job gains (chart). It was also the strongest weekly increase in three months. The ADP numbers for private industry payrolls make more sense to us than the Bureau of Labor Statistics’ payroll employment data.
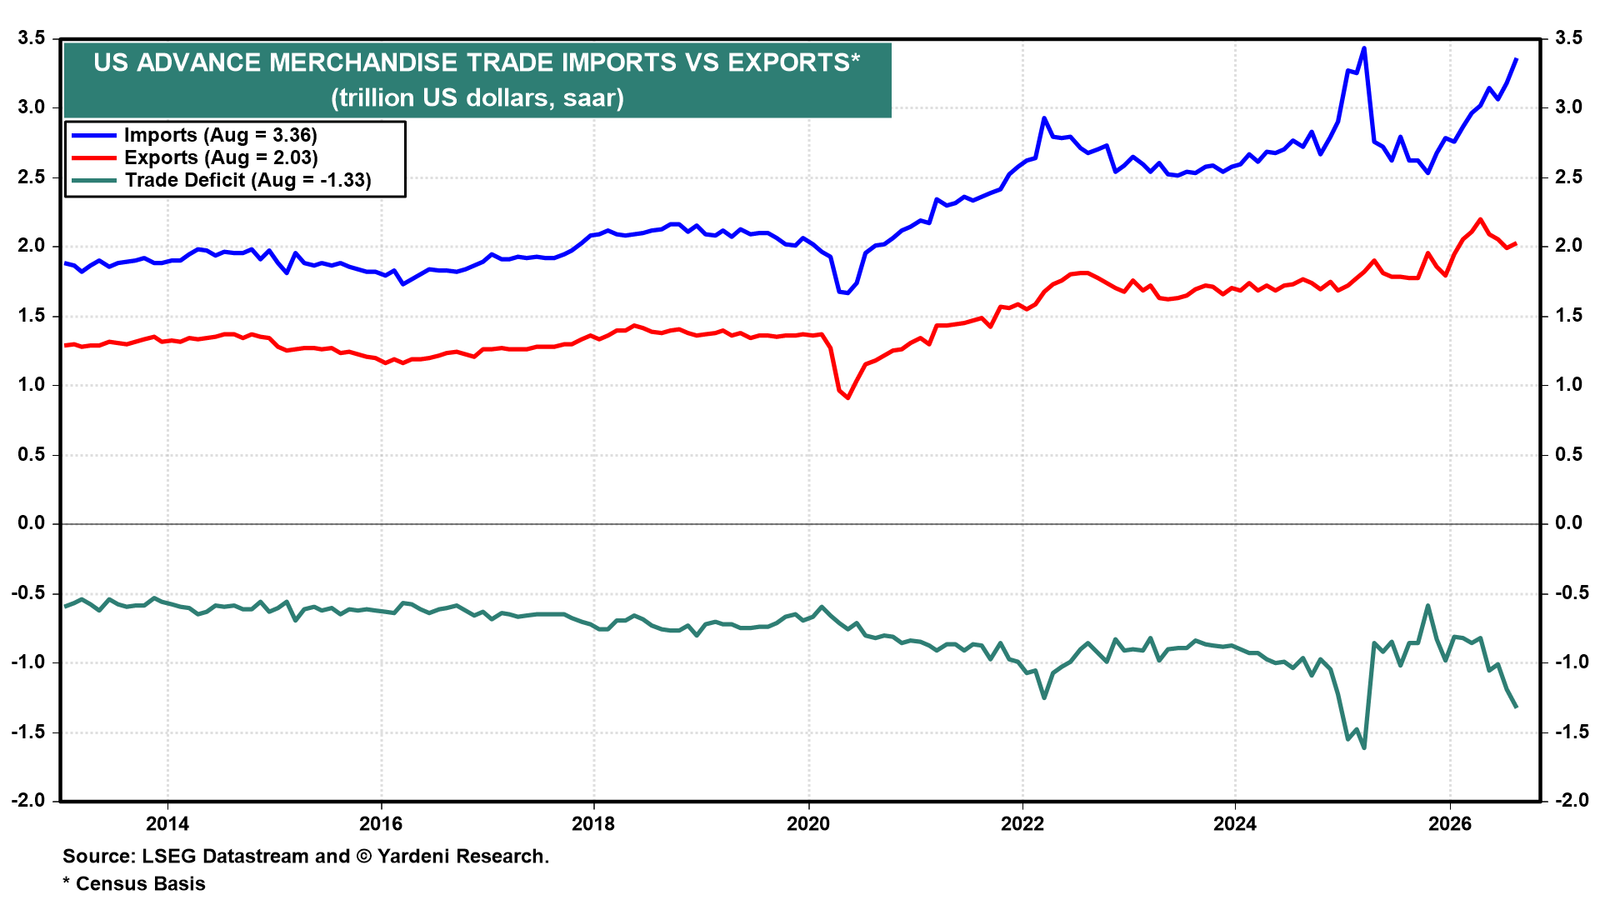
(3) Trade balance. The latest US trade data point to still strong US and global economic growth. US imports rose 4.3% m/m and 23.6% y/y in August, accelerating from July, while US exports increased 1.4% m/m and 12.3% y/y. Imports reached a $3.36 trillion annualized rate, versus $2.03 trillion for exports, leaving a merchandise trade deficit of $1.33 trillion annualized (chart). The gap reflects exceptionally strong US demand for imported goods.
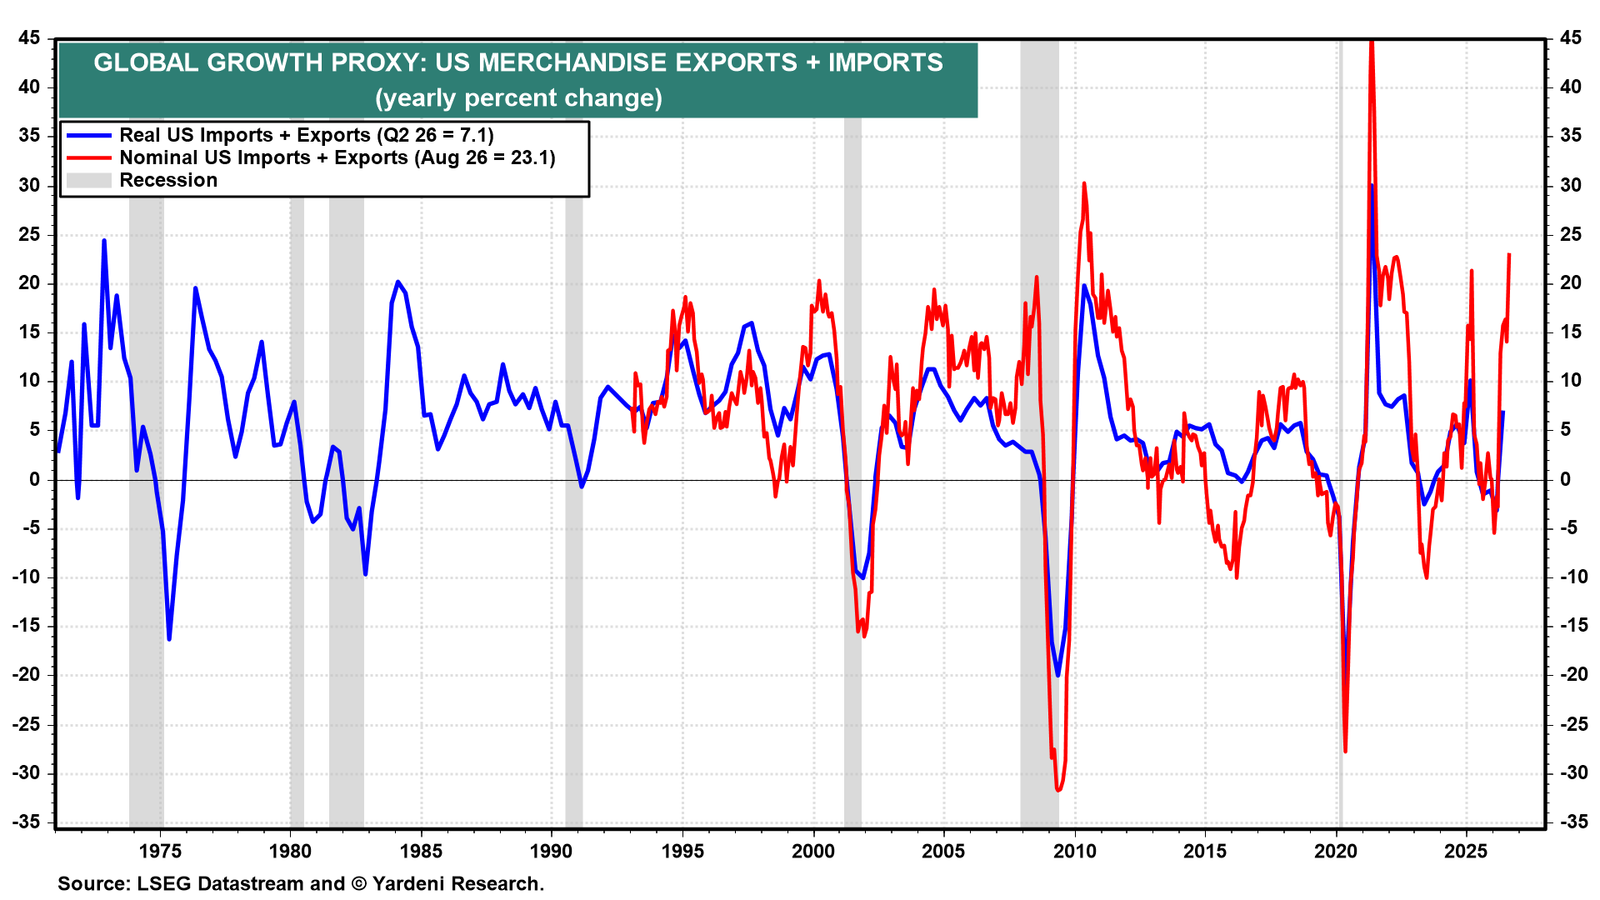
Nominal and real US merchandise exports plus imports rose 23.1% y/y and 7.1%, respectively, in August (chart). That suggests global trade remains firmly in expansion territory and is consistent with strong global economic growth.
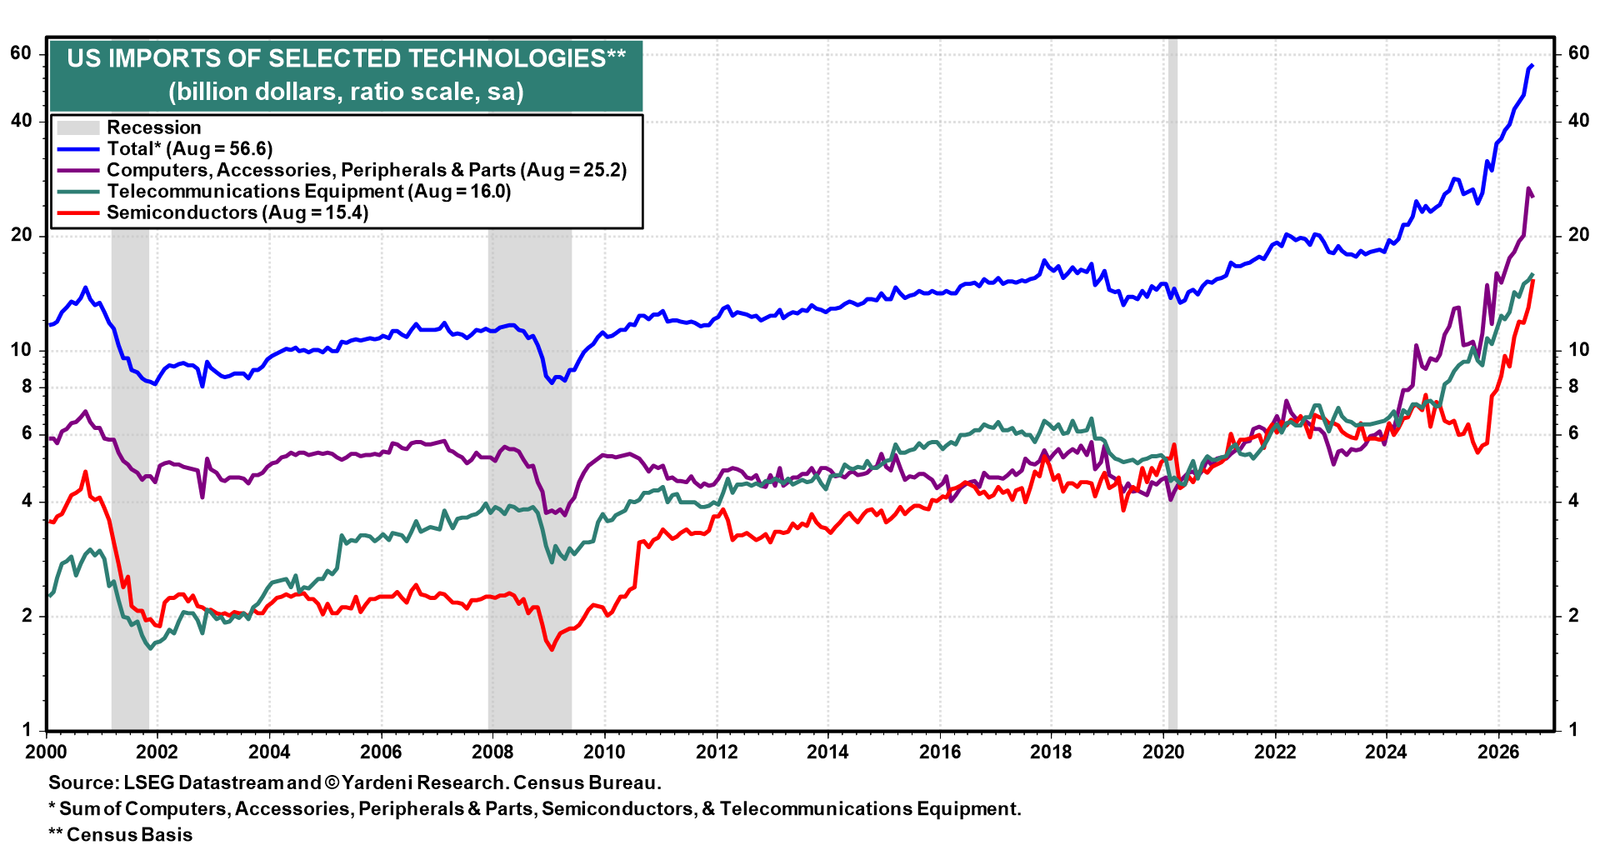
Selected technology imports reached a record $56.6 billion in August (chart). The AI buildout is highly import-intensive and requires large volumes of semiconductors, servers, networking equipment, and other hardware produced overseas.