The message from the stock market is clear: The US economy is passing another stress test. Both domestic and foreign investors have shifted their attention from the risks of military escalation in the Middle East back to the remarkably consistent resilience of the US economy. The results are all-time highs in equities and a fresh wave of buying by both domestic and foreign investors. Even Michael Burry is reportedly buying the dip in software stocks after the AI-fueled sell-off (chart).
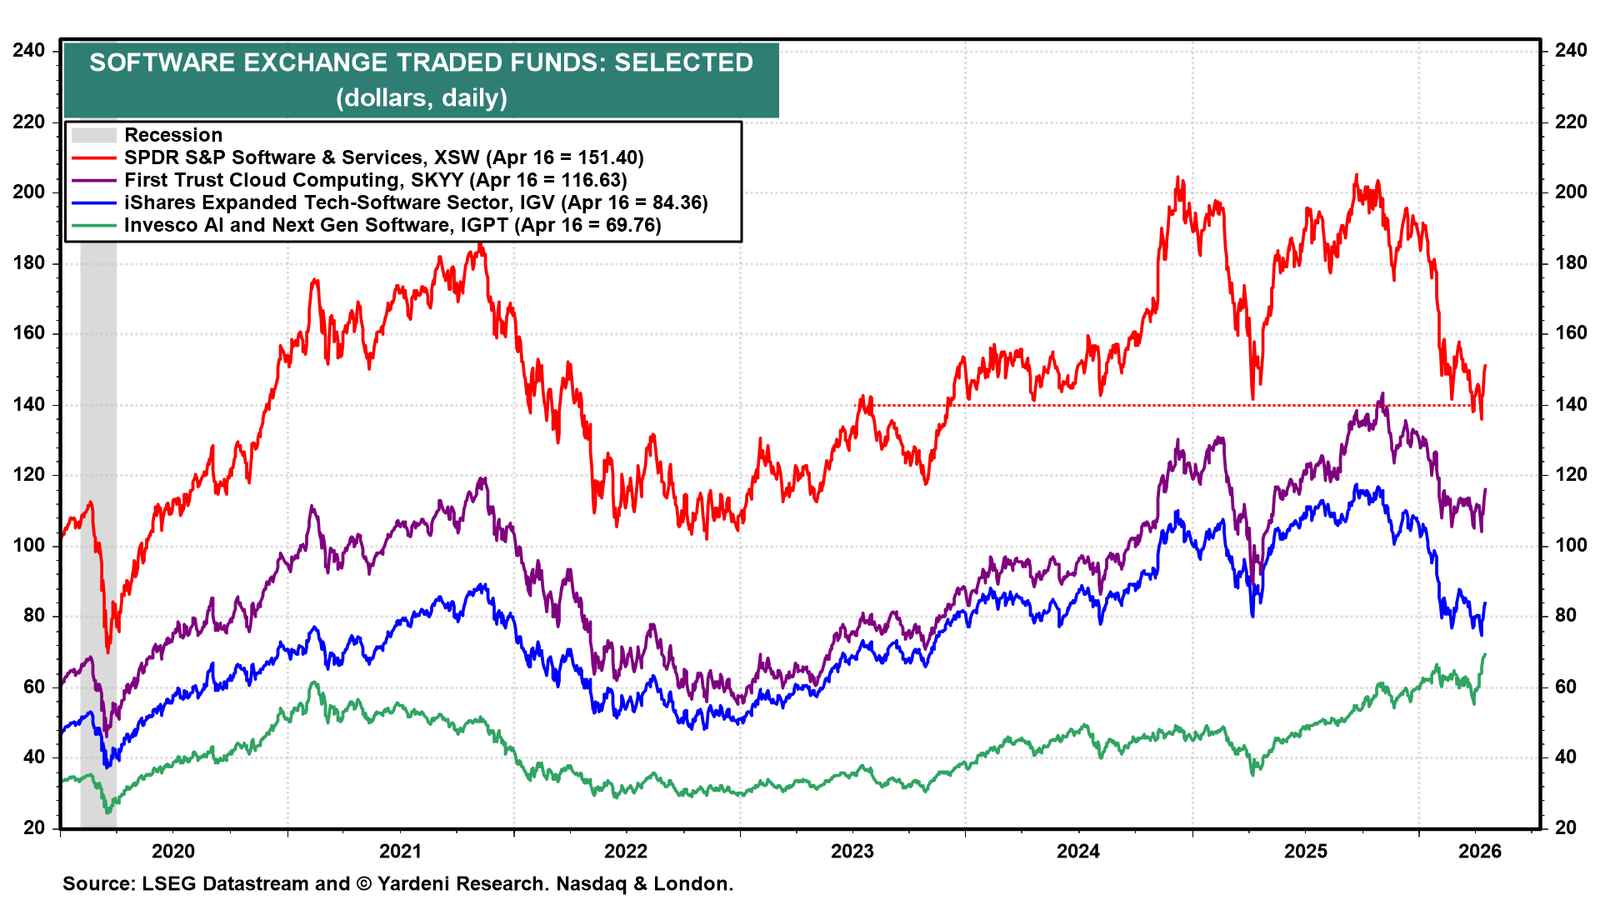
Contrary to the popular view, foreign investors continue to be net buyers of US stocks and bonds. The monthly Treasury International Capital System (TICS) data show net capital inflows from abroad remain robust. Private and official accounts combined purchased $1.35 trillion in US securities during the 12 months ended with February (chart).
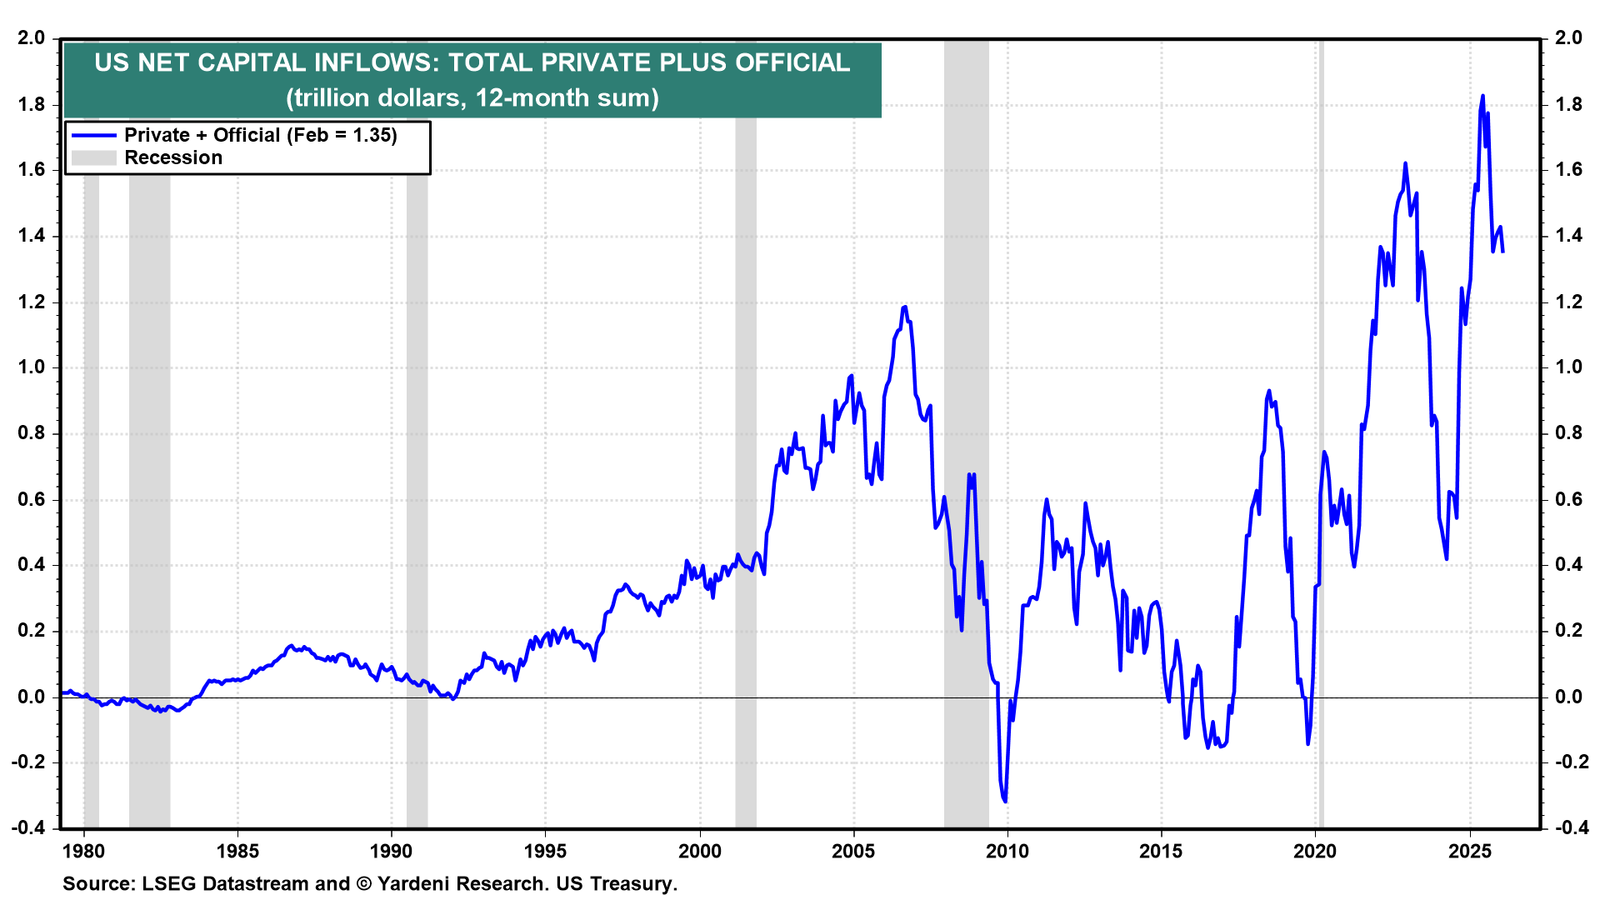
Over this same period, net purchases of US bonds and equities by private foreign investors totaled $828.9 billion and a near-record $716.7 billion, respectively (chart).
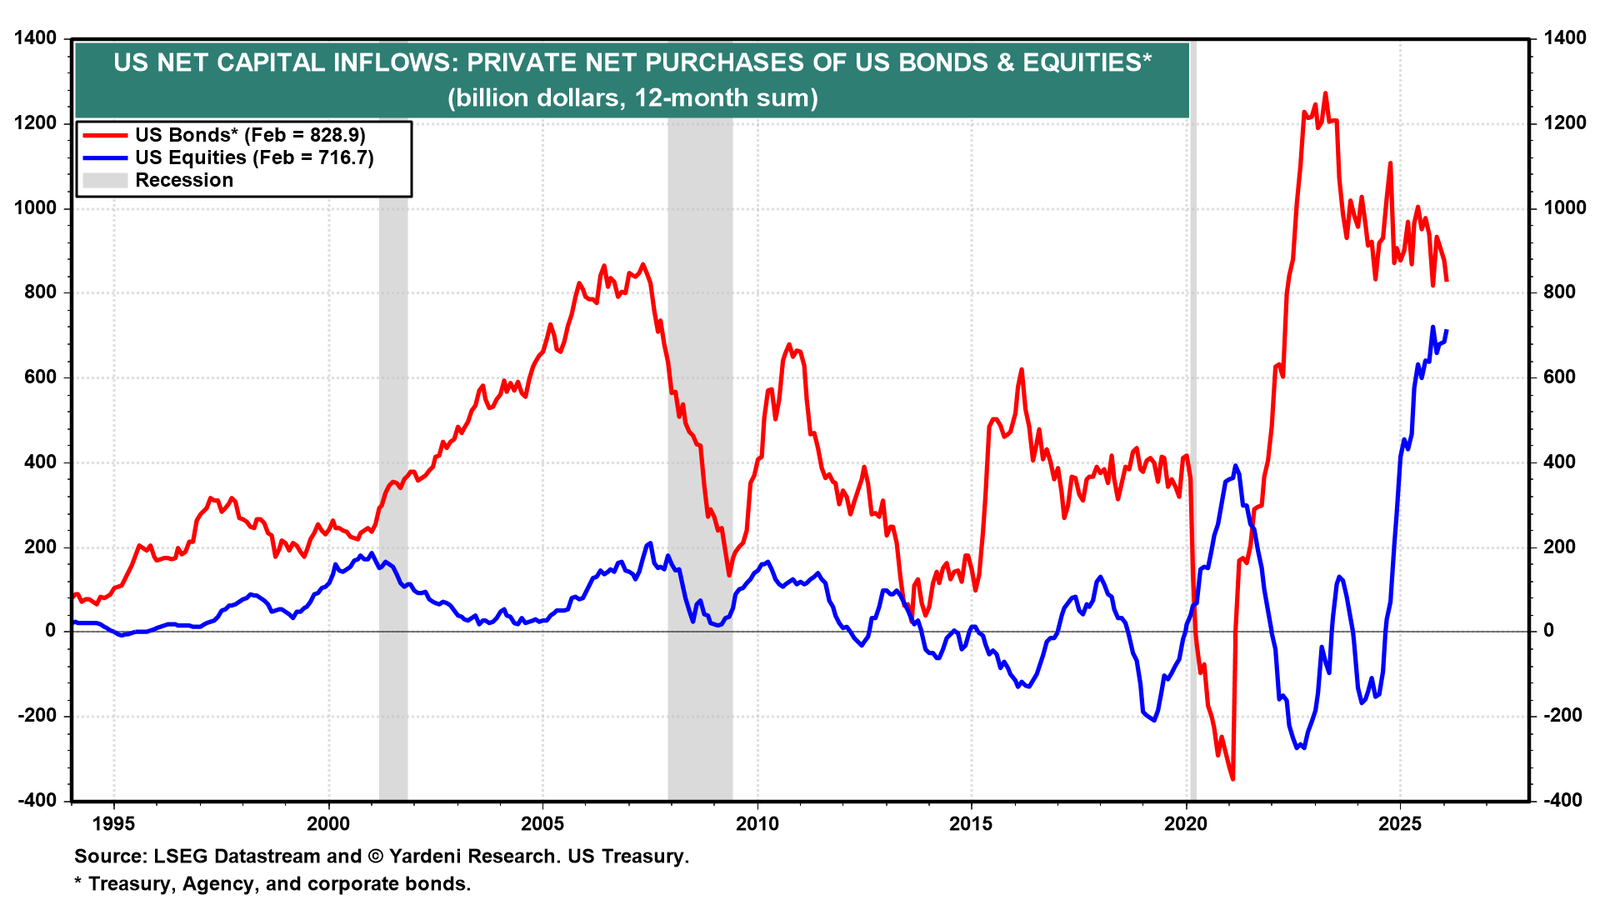
Foreigners now hold a record $9.5 trillion in US Treasuries (chart). Foreign official holdings have remained flat at around $4.0 trillion since 2012, while private foreign holdings have surged to a record $5.5 trillion. This is a continued vote of confidence in US assets.
Earnings reports and economic data released today give investors little reason to change their minds. Consider the following:
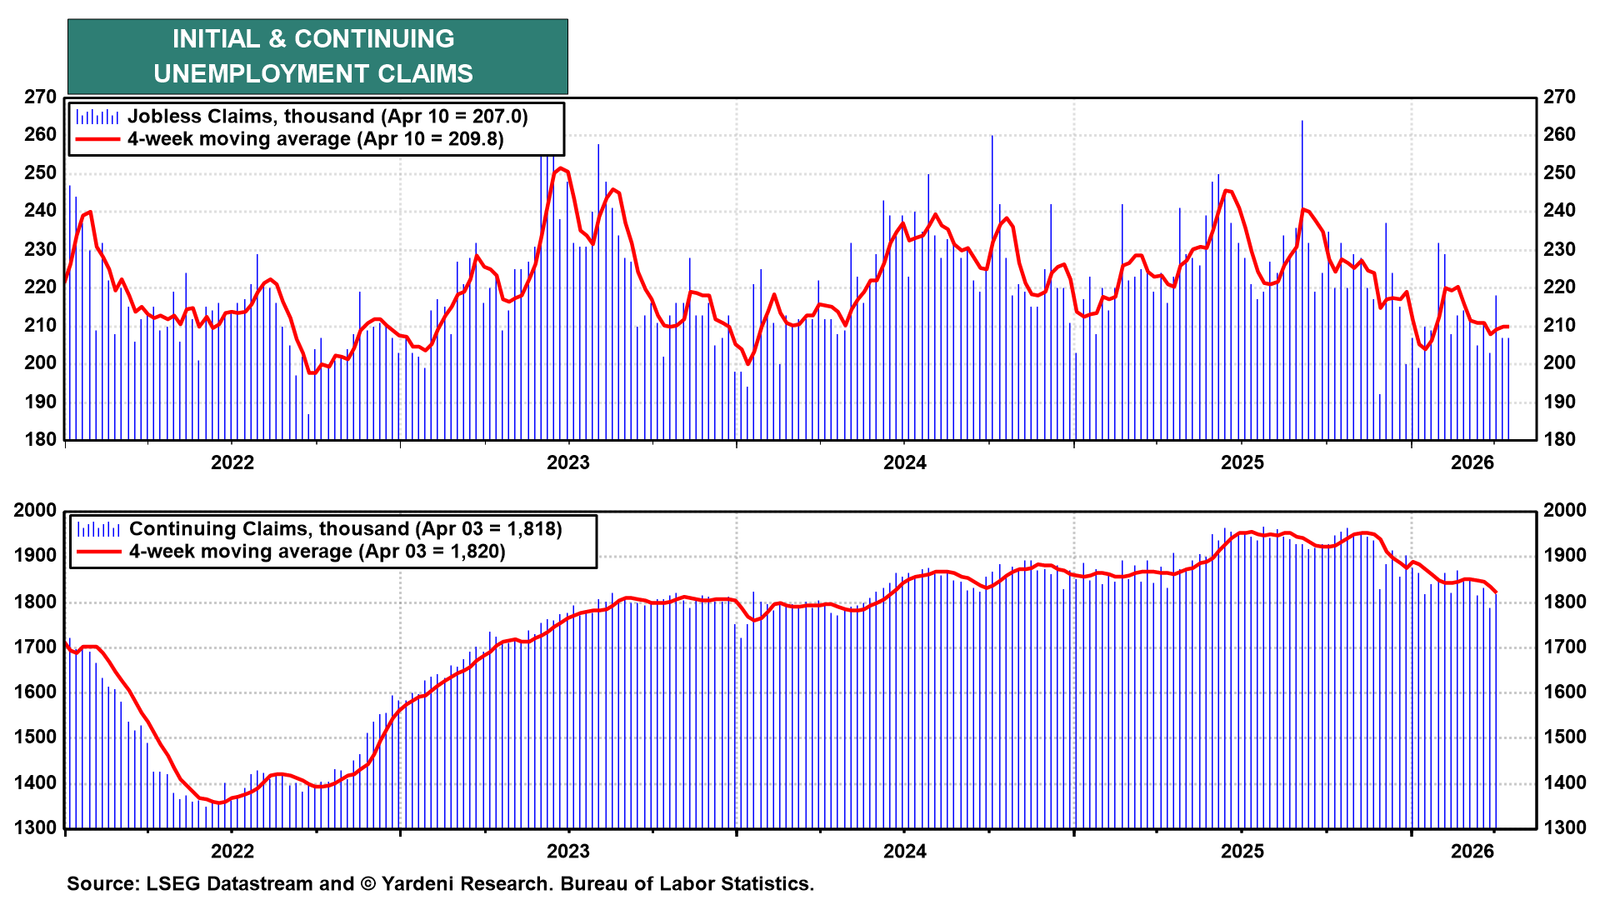
(1) Initial jobless claims. Weekly initial unemployment insurance claims continue to confirm that layoffs remain historically low. For the week ended April 11, they fell 11,000 to 207,000. Continuing claims edged up slightly to 1,818,000, but the four-week moving average declined to its lowest reading since June 2024, suggesting that hiring activity may actually be improving (chart). That would not surprise us because corporate profits is at a record high. Profitable companies tend to increase their payrolls.
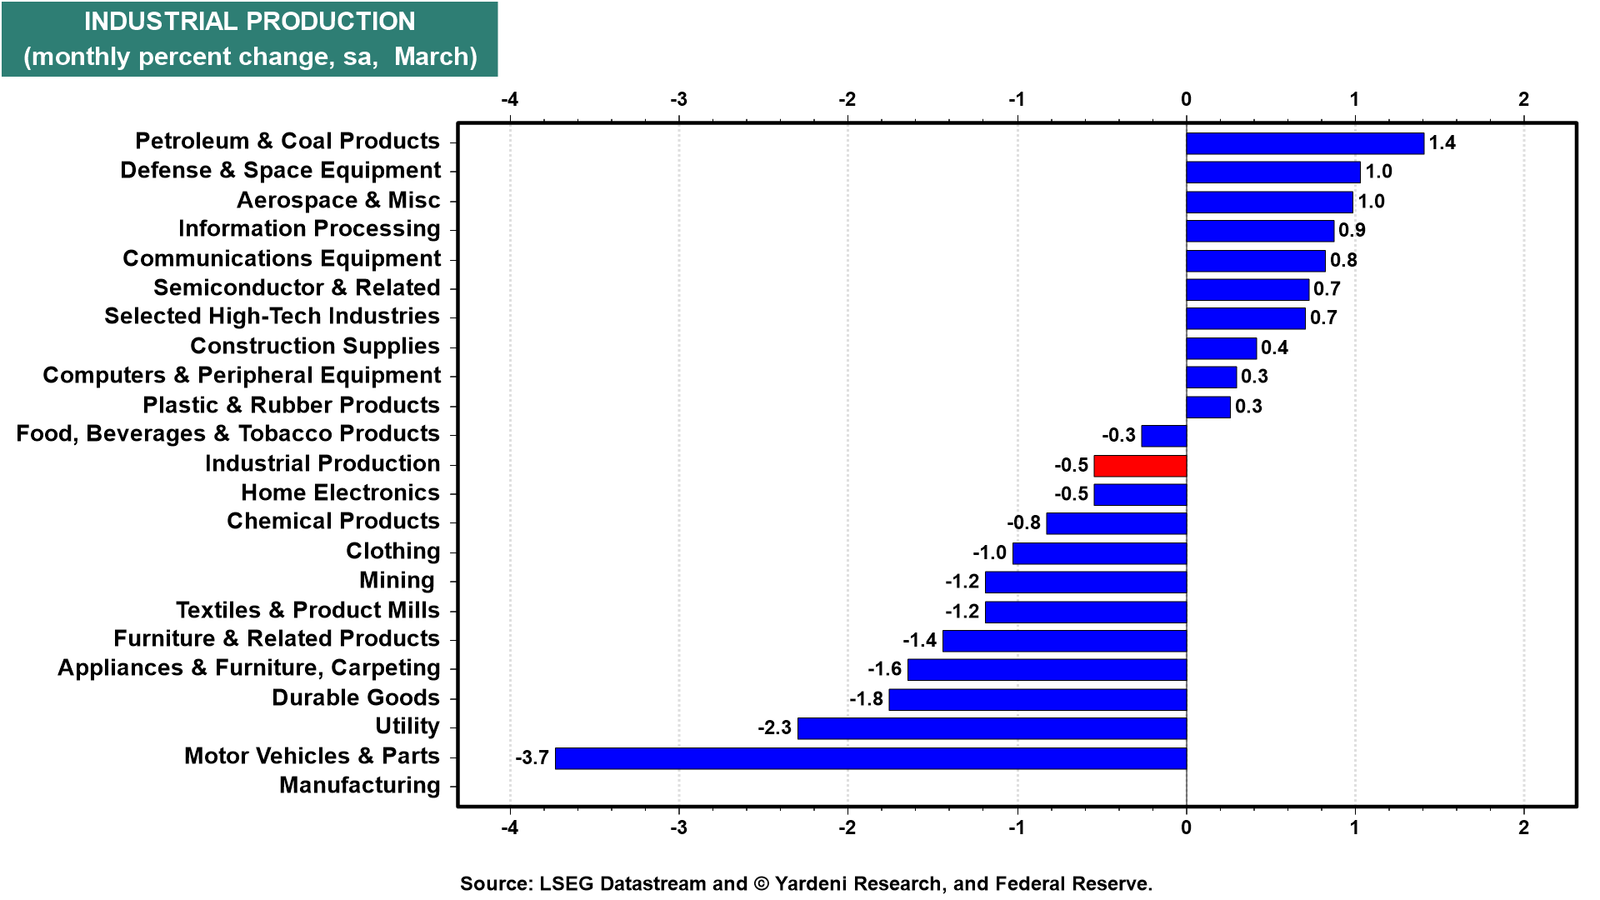
(2) Industrial production. US industrial production fell 0.5% m/m in March, defying market expectations of a 0.1% increase. However, the decline is not as bad as the headline number suggests.
First, we blame part of the weakness on the bad weather in February and the good weather in March. The result was a 2.3% m/m decline in utility output last month (chart). Second, auto production fell 3.7% m/m, while auto sales rose sharply in March. Third, February's industrial production was revised up from 0.2% m/m to 0.7% m/m. Last but not least, production has been in an uptrend over the past year and should continue to rise, led by energy infrastructure investment, the AI data center buildout, and ongoing reshoring and supply-chain diversification.
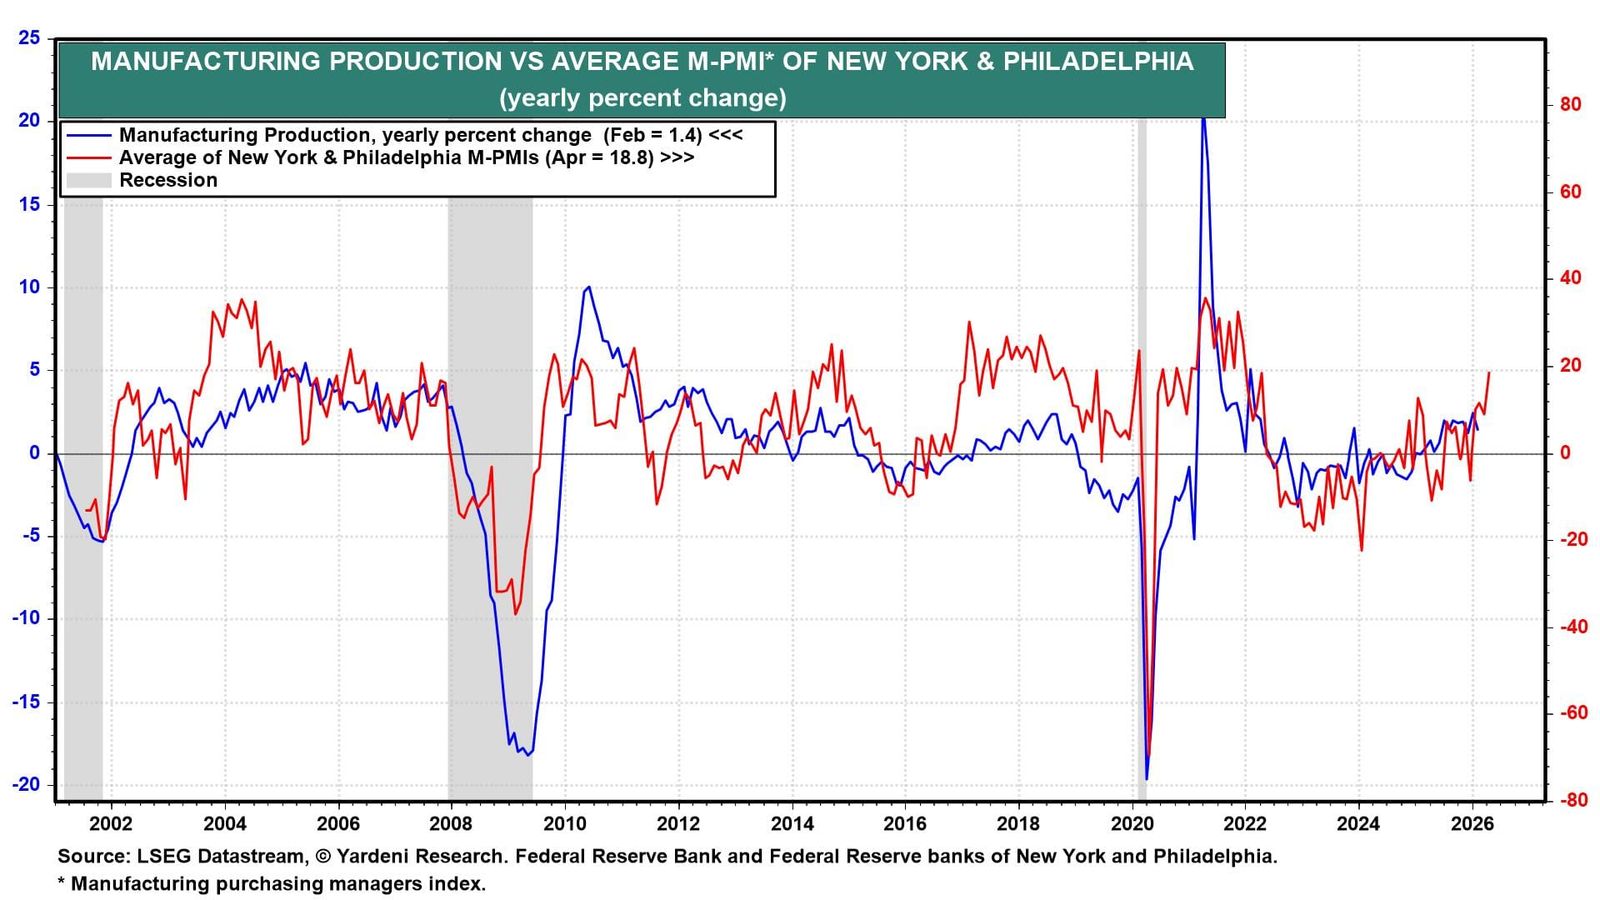
(3) Manufacturing surveys. Regional manufacturing surveys corroborate our view that March's factory output dip was transitory. The Philadelphia Fed's M-PMI jumped to its highest level since 2021, and the NY Fed index rose to 11 in April from -0.2 in March. The average of the two indexes closely tracks the y/y percent change in manufacturing output, and it rose to 18.8 in April, the highest reading since 2022 (chart).
(4) J.B. Hunt’s earnings. Logistics giant J.B. Hunt is a reliable barometer for the broader economy. Q1 EPS beat analysts’ estimates. The company reported that overall demand proved resilient across most segments, and March saw a record weekly load count. This provides yet another vote of confidence in the resilience of the US economy last quarter.