The Fed might or might not raise the federal funds rate this month. The war in the Middle East may or may not be over (and isn't even a war anymore, says VP JD Vance). A debt crisis may be imminent, or not. The Republicans will probably lose the House in the midterms, or maybe not. Putin may or may not invade NATO. Trump might embargo US trade with countries with a trade surplus with the US, or whatever.
Meanwhile, there's no doubt that corporate earnings are soaring. Fabulous Earnings Momentum (FEMO) is driving the market higher despite all the uncertainties listed above.
I. Earnings
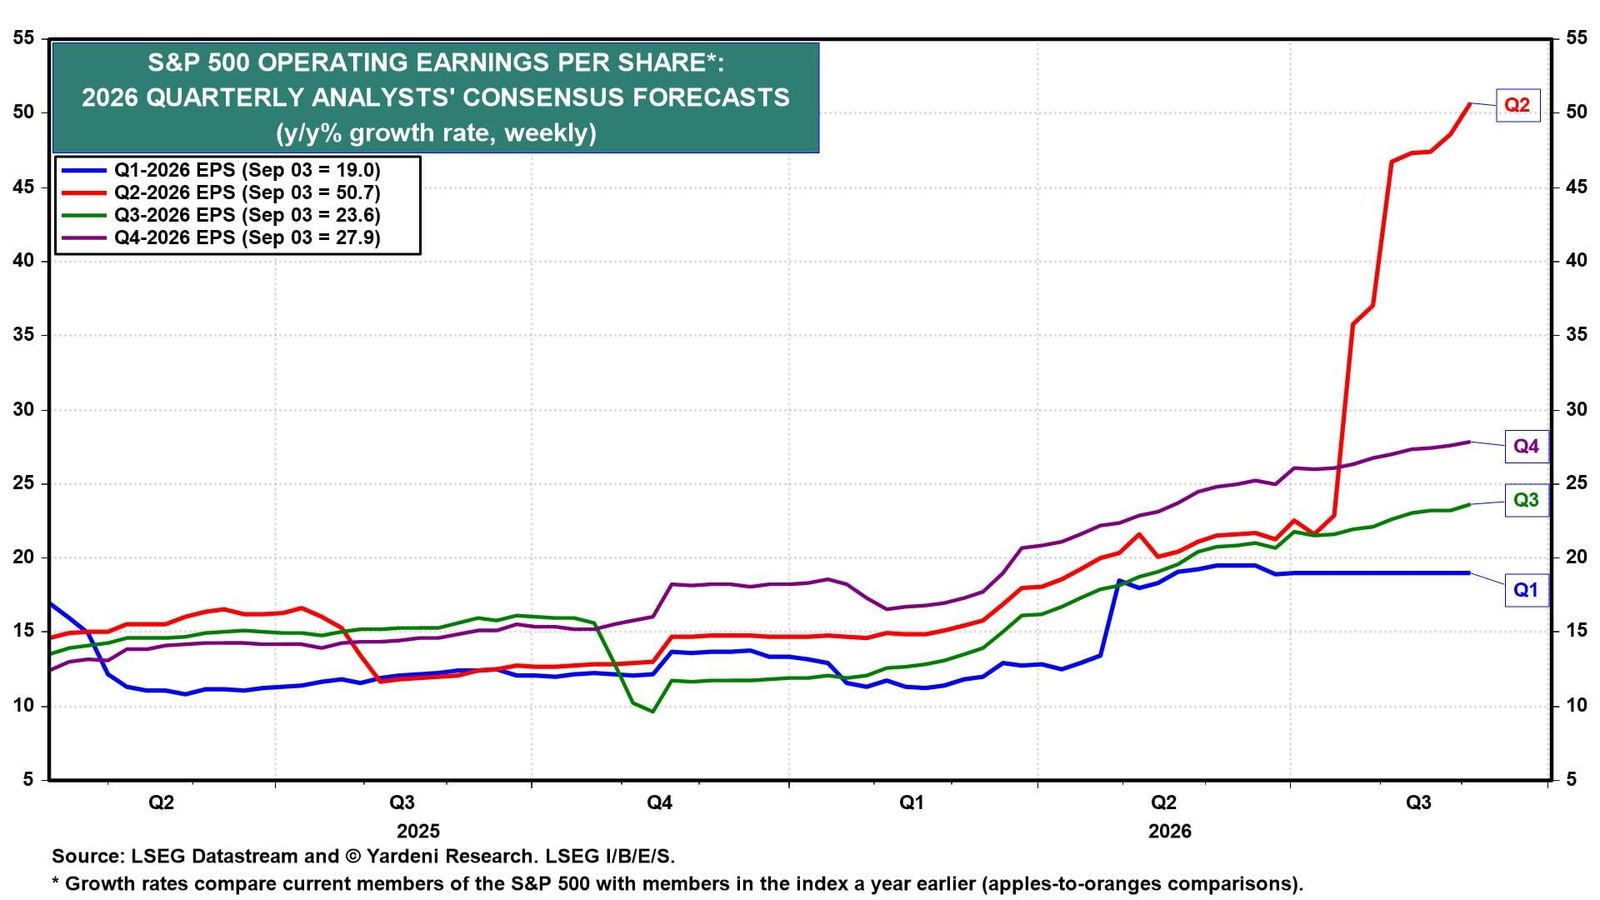
During Q2, S&P 500 earnings per share rose a whopping 50.7%, up from 19.0% during Q1 (chart). Analysts now project 23.6% for Q3 and 27.9% for Q4. Q2 includes the mark-to-market (MTM) gains we have flagged for several weeks. Without them, the Q2 gain was about 25%. The back-half earnings estimates exclude MTM gains, and the Q3 and Q4 estimates are still rising.
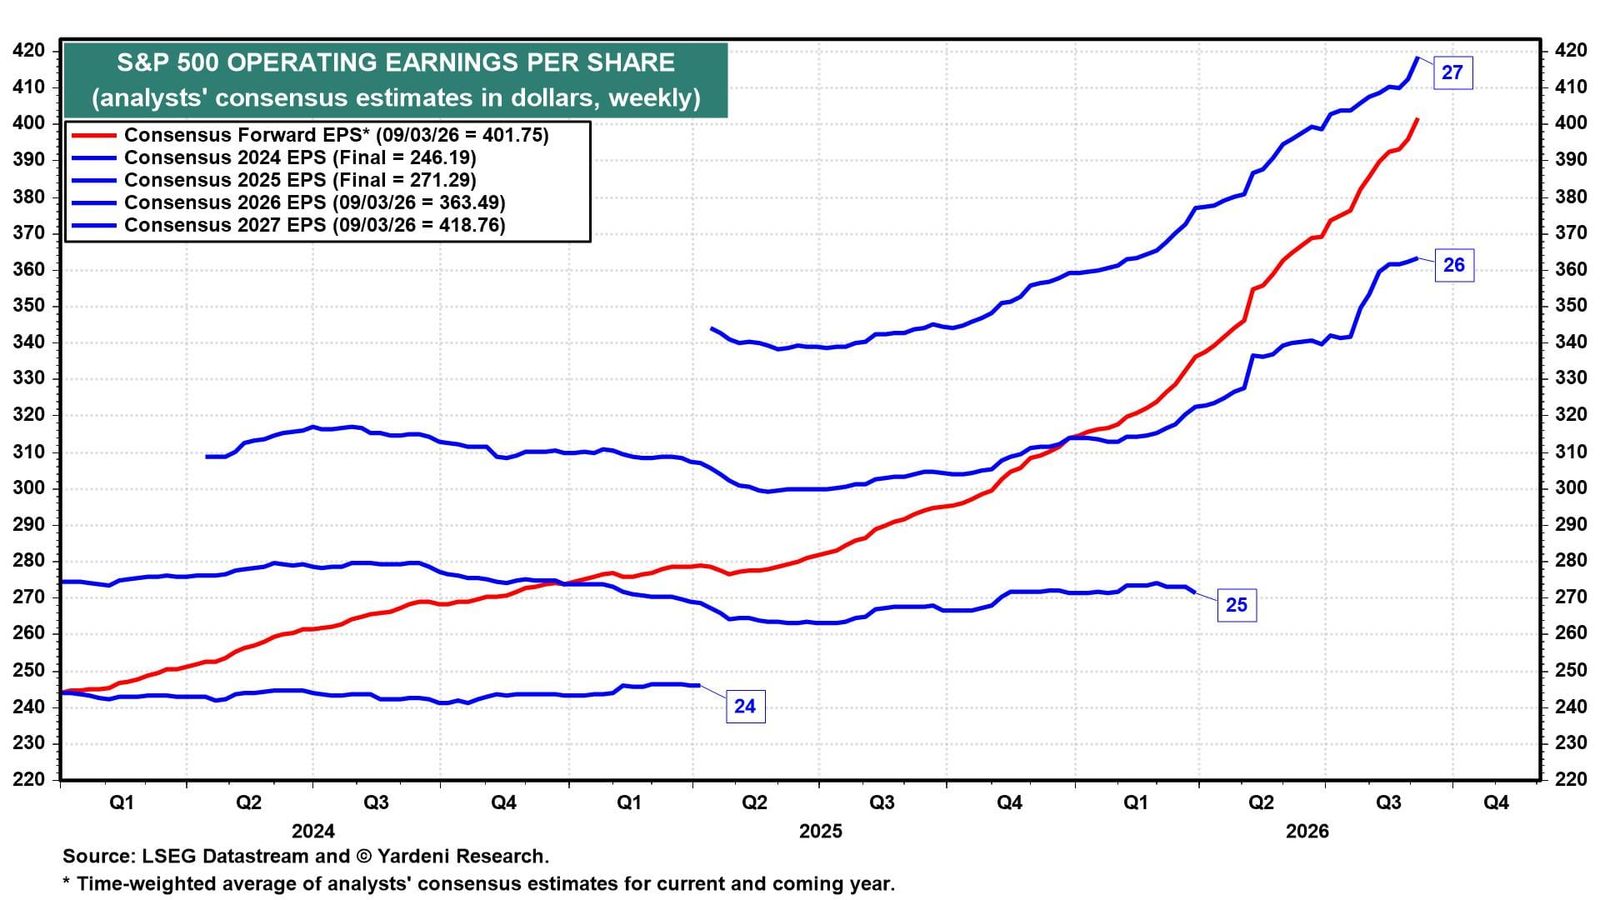
Forward earnings rose to a record $401.75 per share last week (chart). It is converging toward the year-end consensus estimate for 2027, which just jumped to $418.76, exceeding the $415.00 we set as our year-end target for both series.
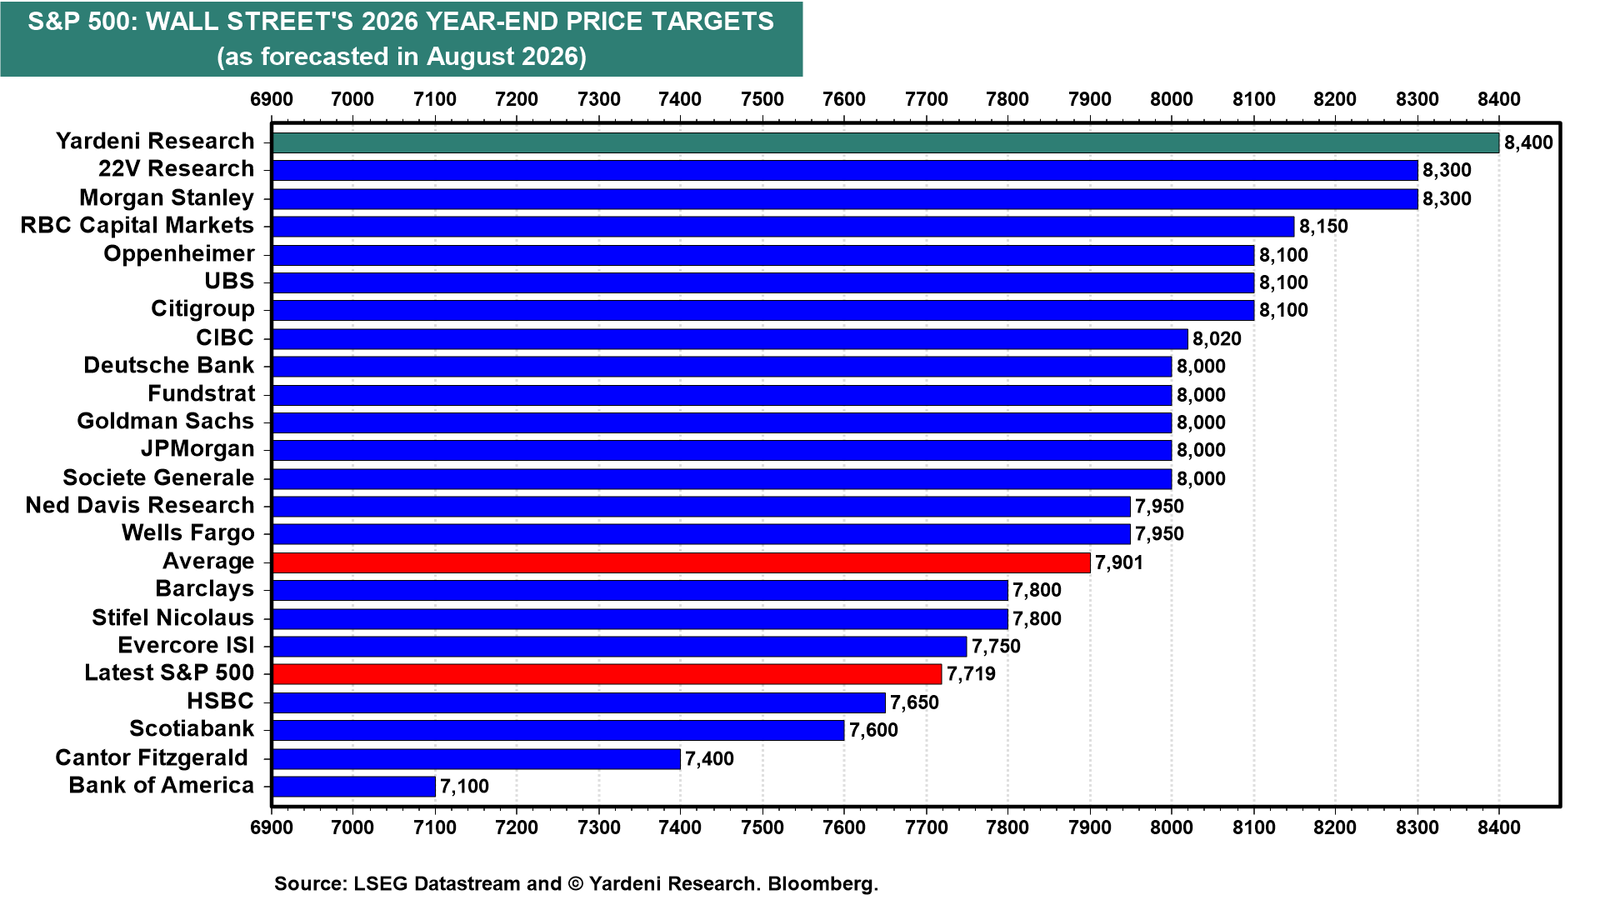
We are sticking with our 8,400 S&P 500 year-end target for now. We might have to raise our S&P 500 target, which is the highest on the Street, if the 2027 estimate continues to rise (chart)!
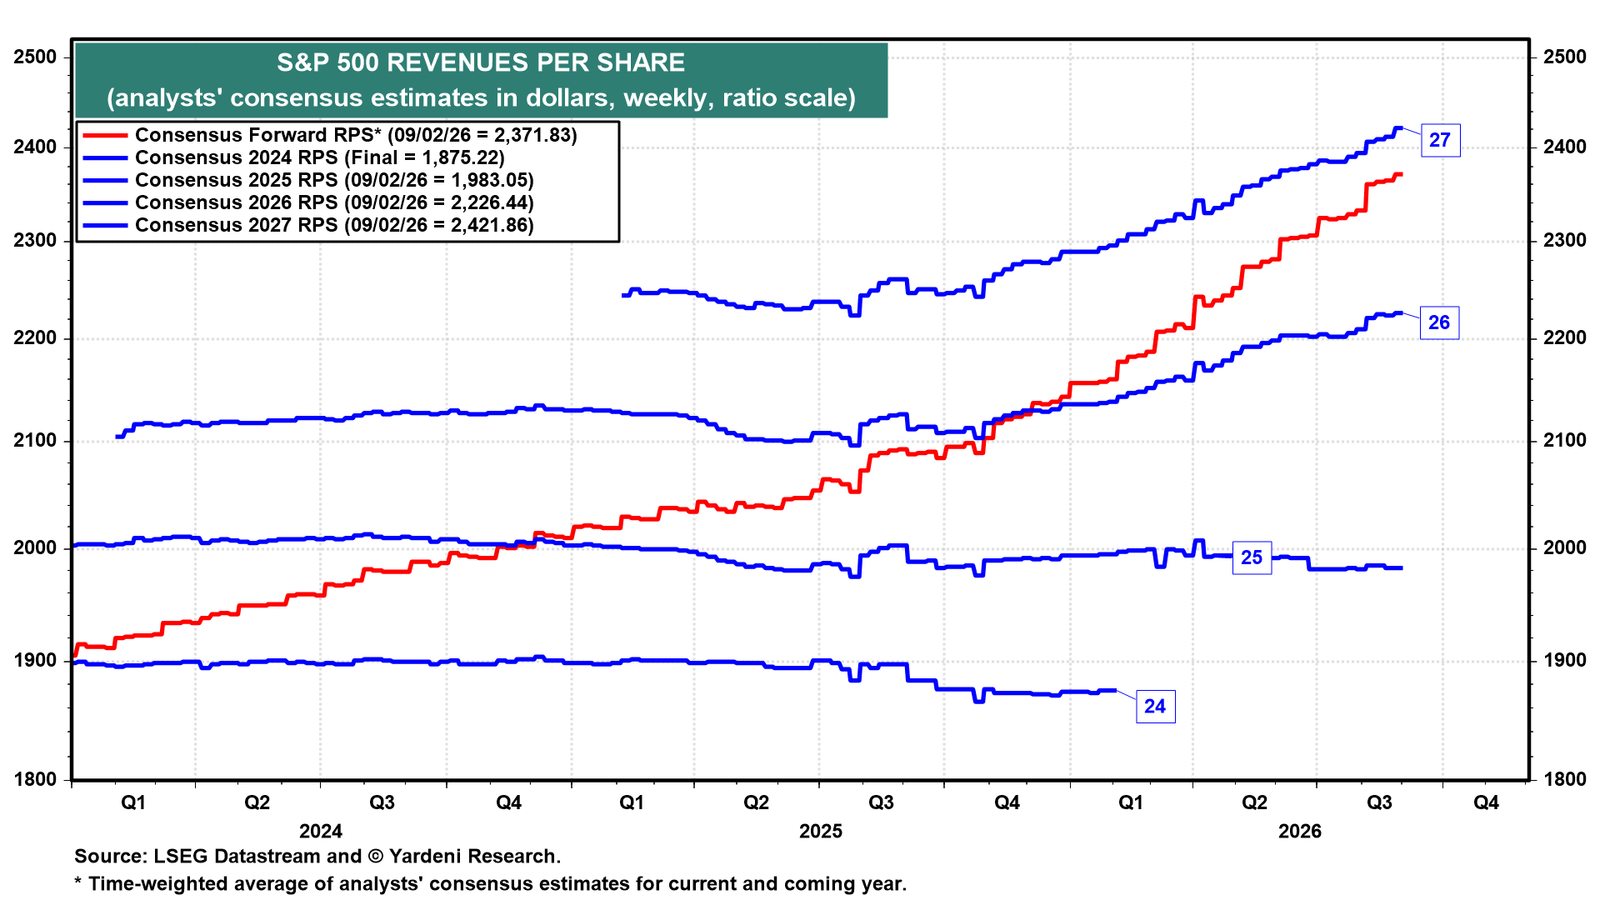
S&P 500 forward revenues per share is at a record high (chart). This suggests that the global economy is performing well since roughly 40% of S&P 500 revenues come from abroad.
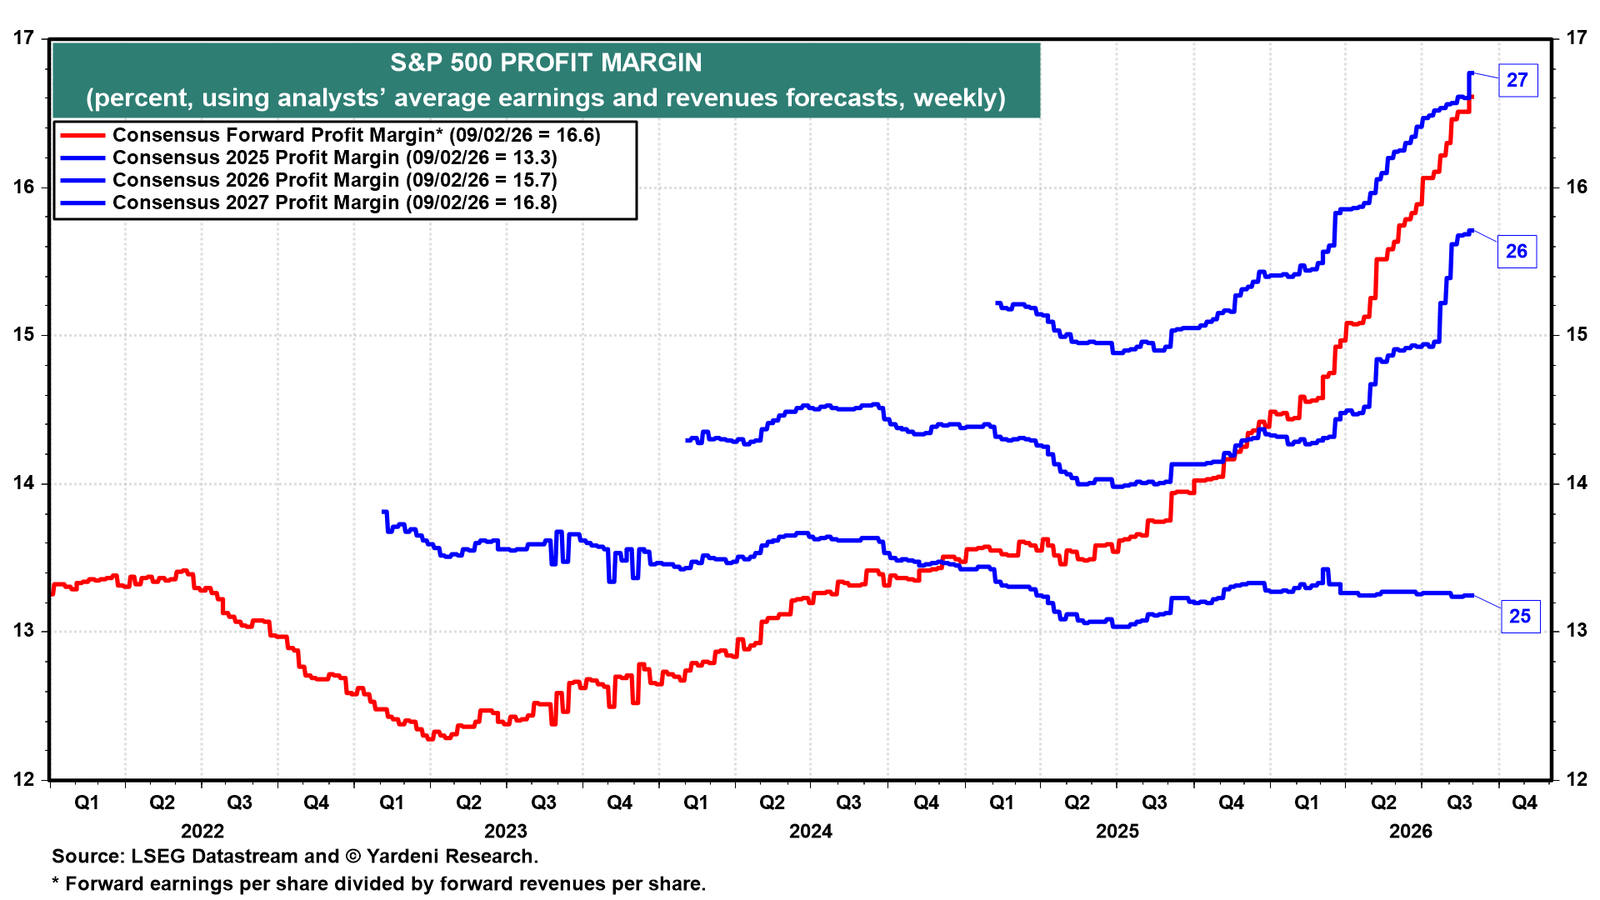
Rising revenues and even faster-rising earnings mean widening profit margins. The forward profit margin is 16.6%, and the 2027 consensus margin is 16.8% (chart). Both continue to hit record highs.
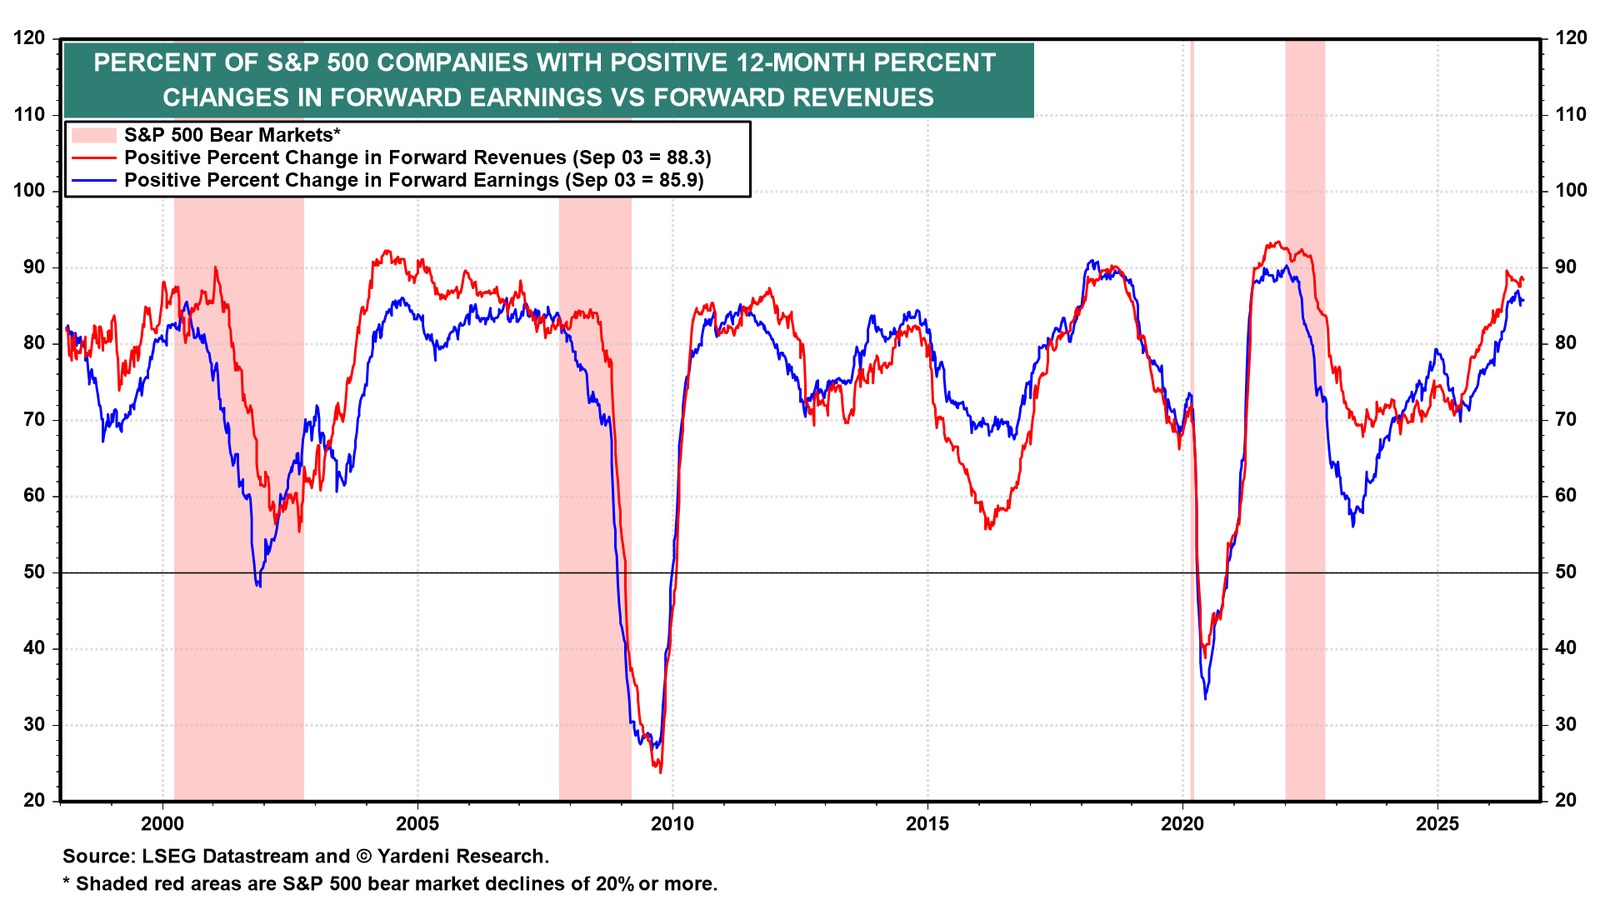
The strength in earnings is broad-based. Some 88.3% of S&P 500 companies currently have positive 12-month changes in forward revenues, and 85.9% have positive changes in forward earnings (chart).
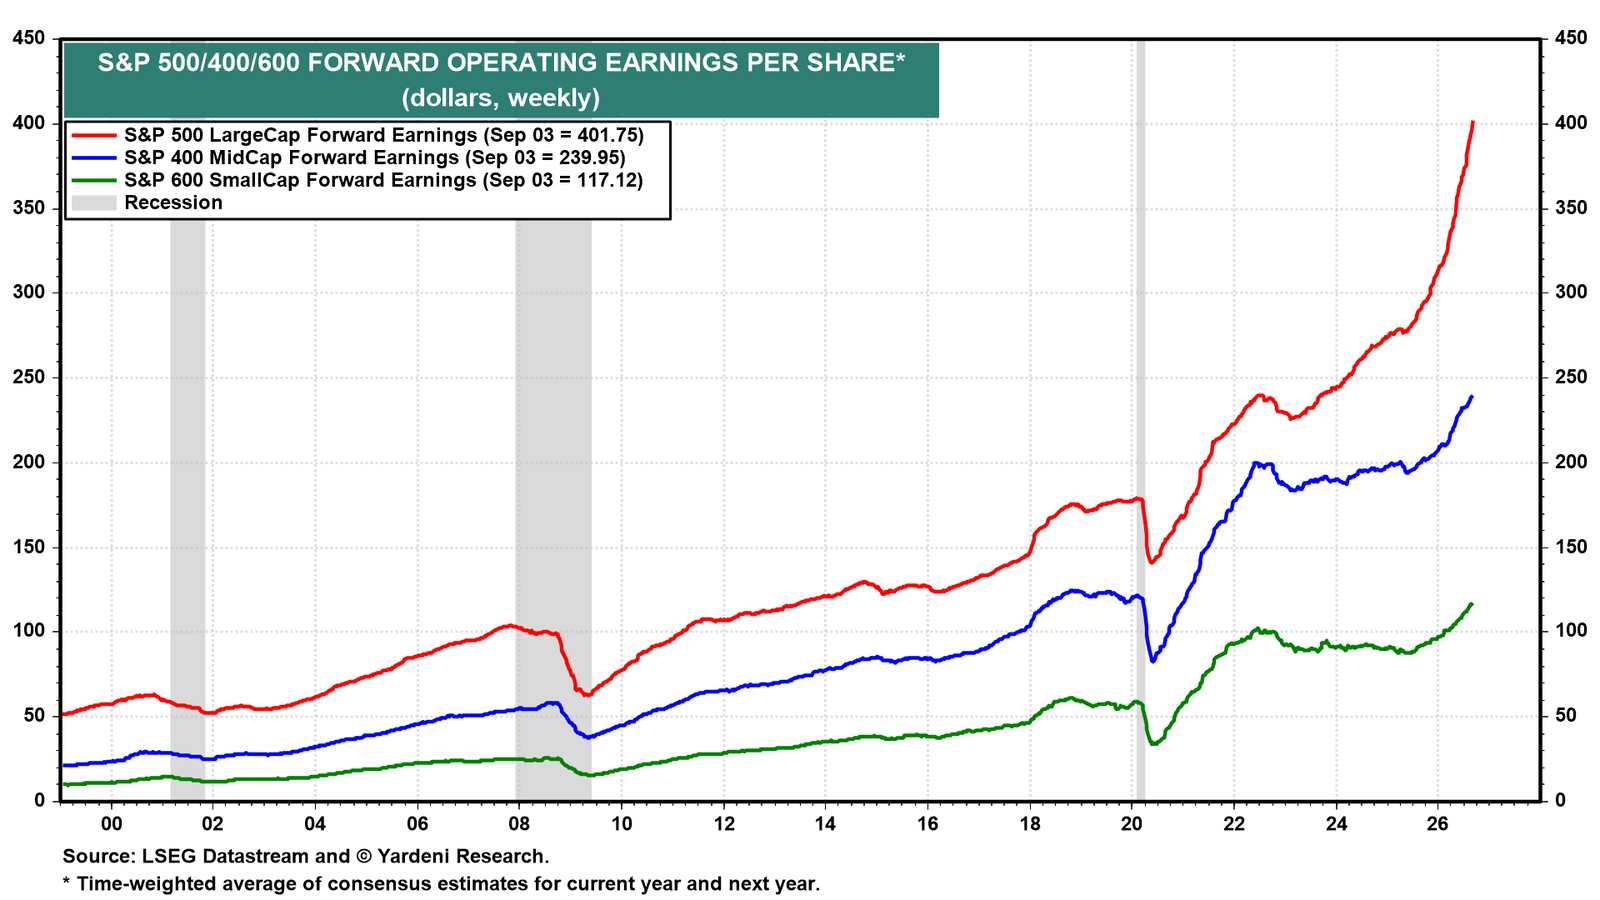
It is not just a LargeCap story, either. Forward earnings for the S&P 500, S&P 400, and S&P 600 all are rising to record highs together (chart).
II. Valuation
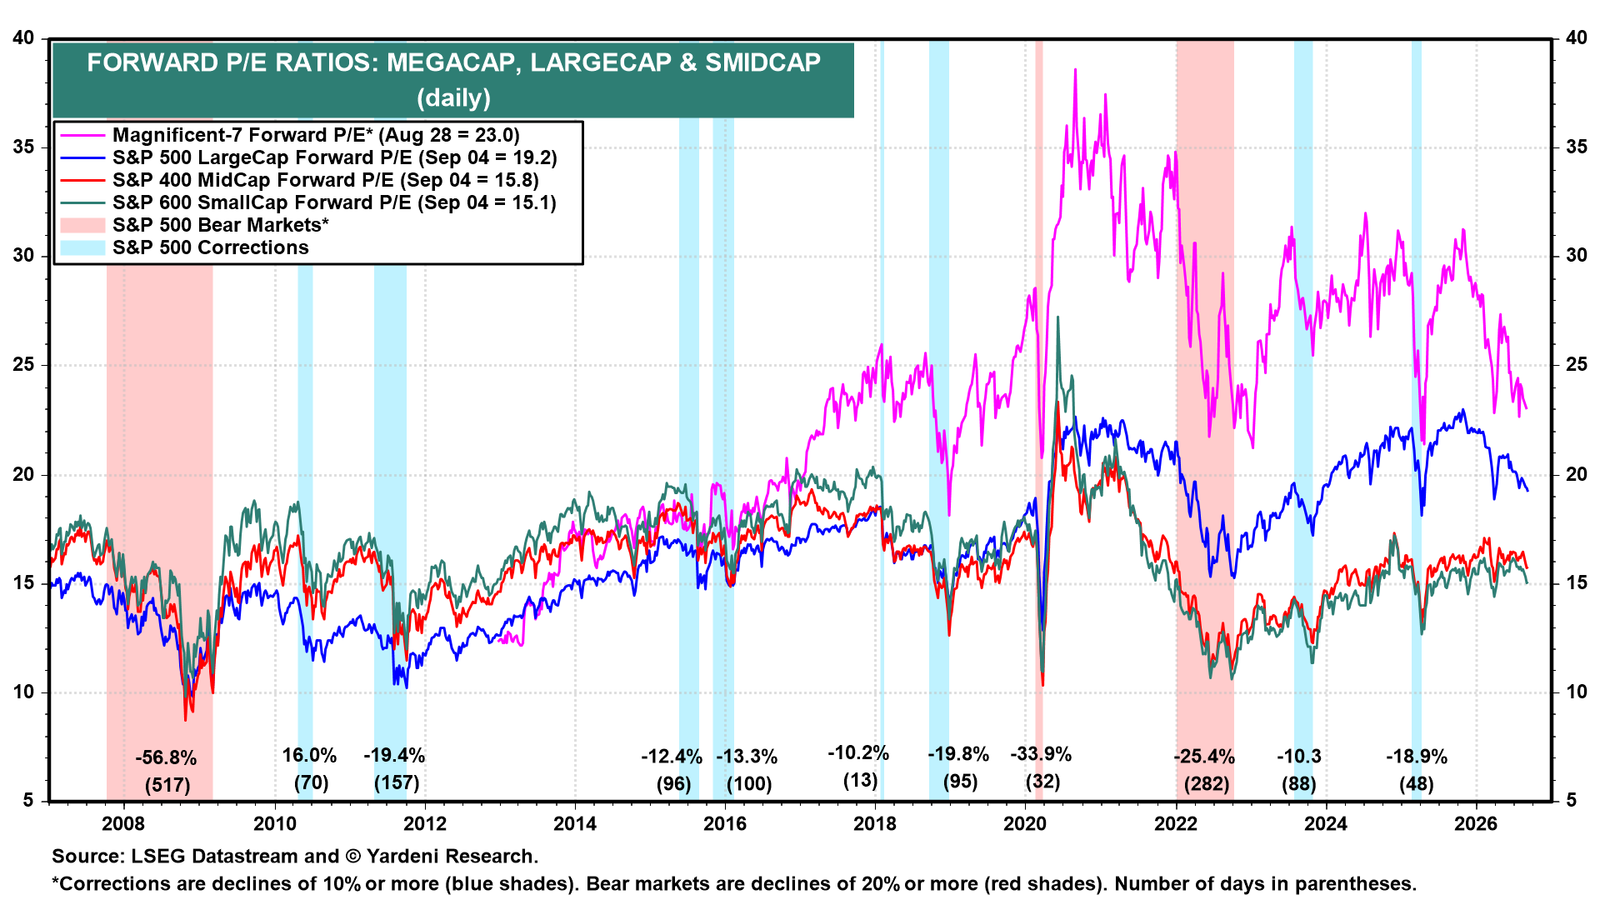
While earnings are soaring, valuation multiples are contracting. The S&P 500 forward P/E is 19.2, with the S&P 400 at 15.8 and the S&P 600 at 15.1 (chart). All three are down in recent weeks. FEMO isn't being matched by fear of missing out (FOMO). As a result, investors are getting more earnings per dollar than they were at the start of the year.
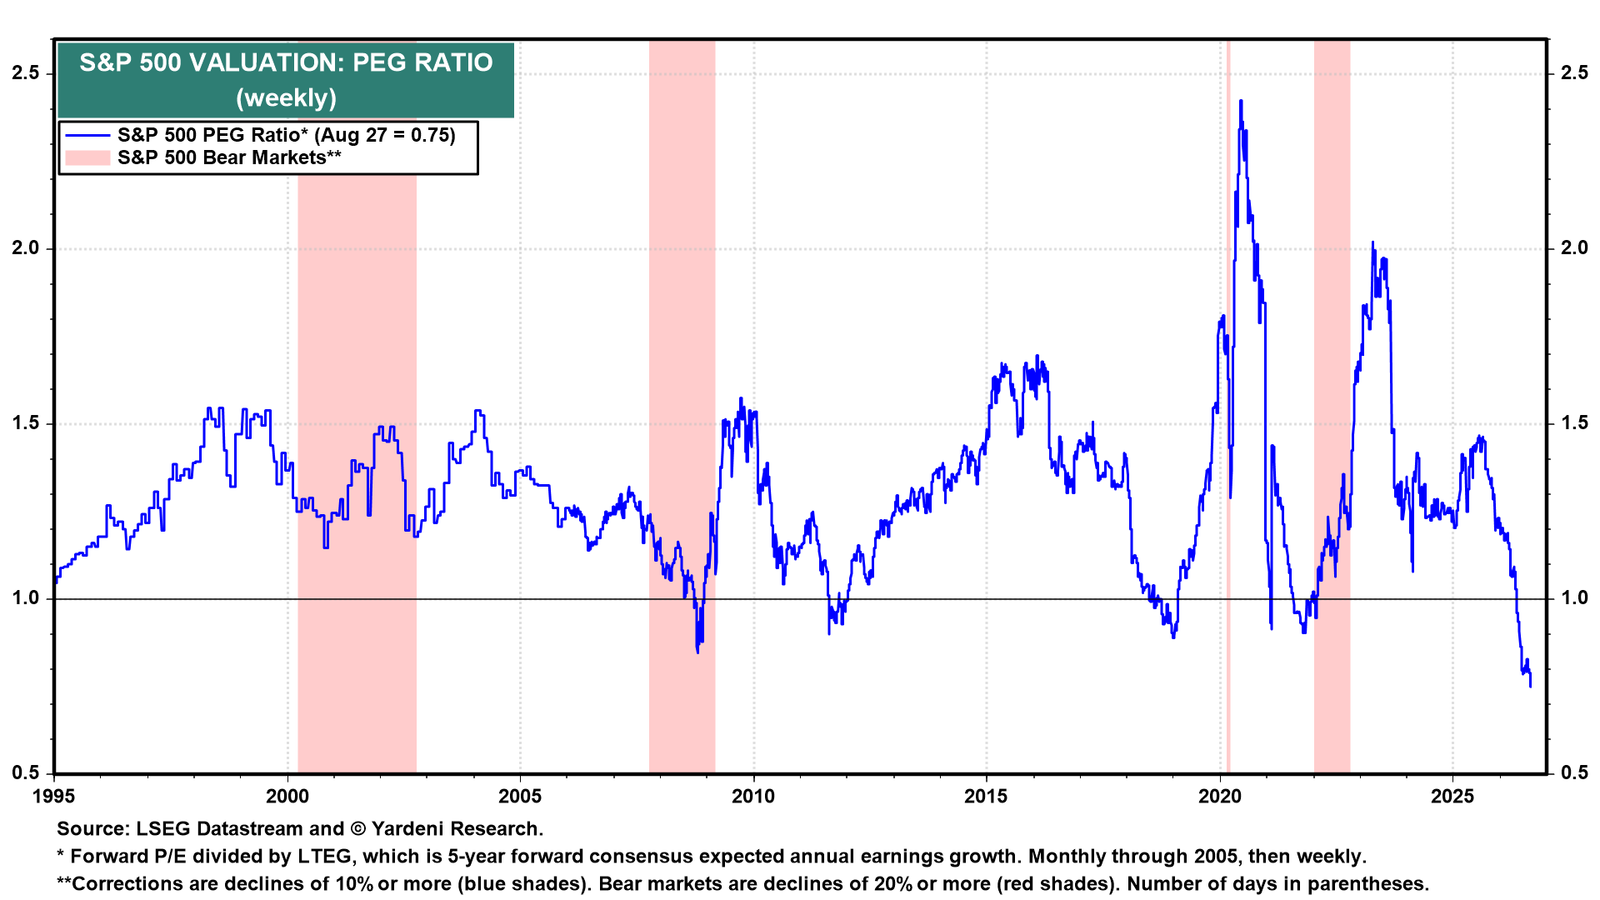
The PEG ratio tells the same story. It has fallen to 0.75, the lowest reading of its 30-year history (chart). Investors are skeptical of industry analysts' heady earnings expectations.
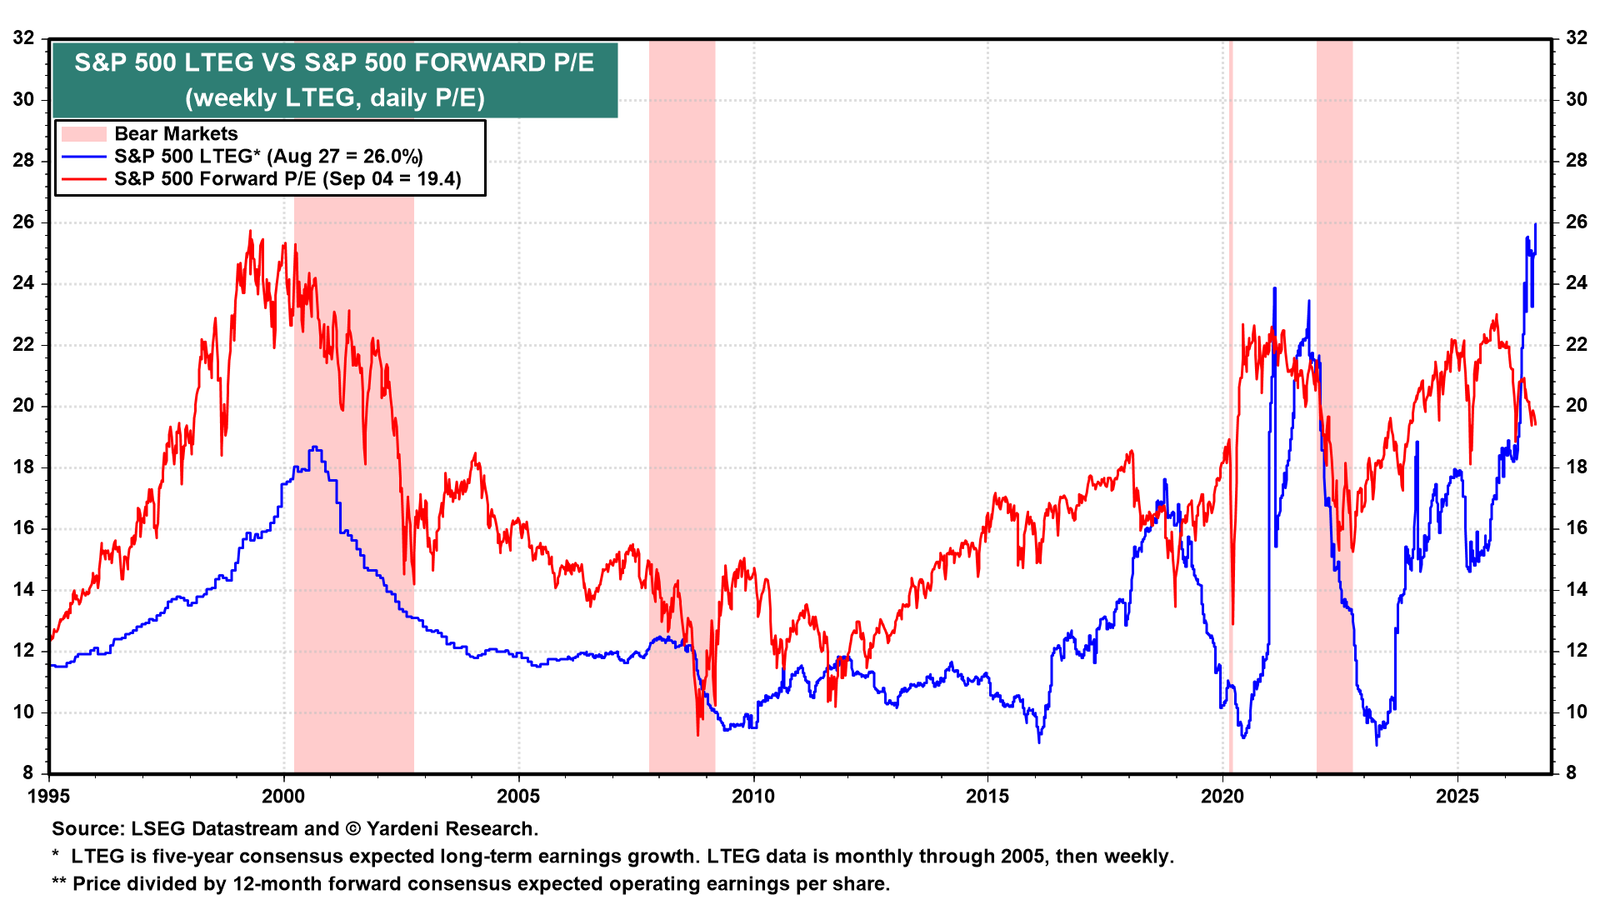
Compare that with 1999. Then, investors bid multiples to extremes that long-term earnings growth (LTEG) expectations never justified. Now the reverse holds. Analysts' LTEG estimate is 26.0%, while the forward P/E has declined so far this year (chart). Analysts are exuberant. Investors are not.
III. Performance
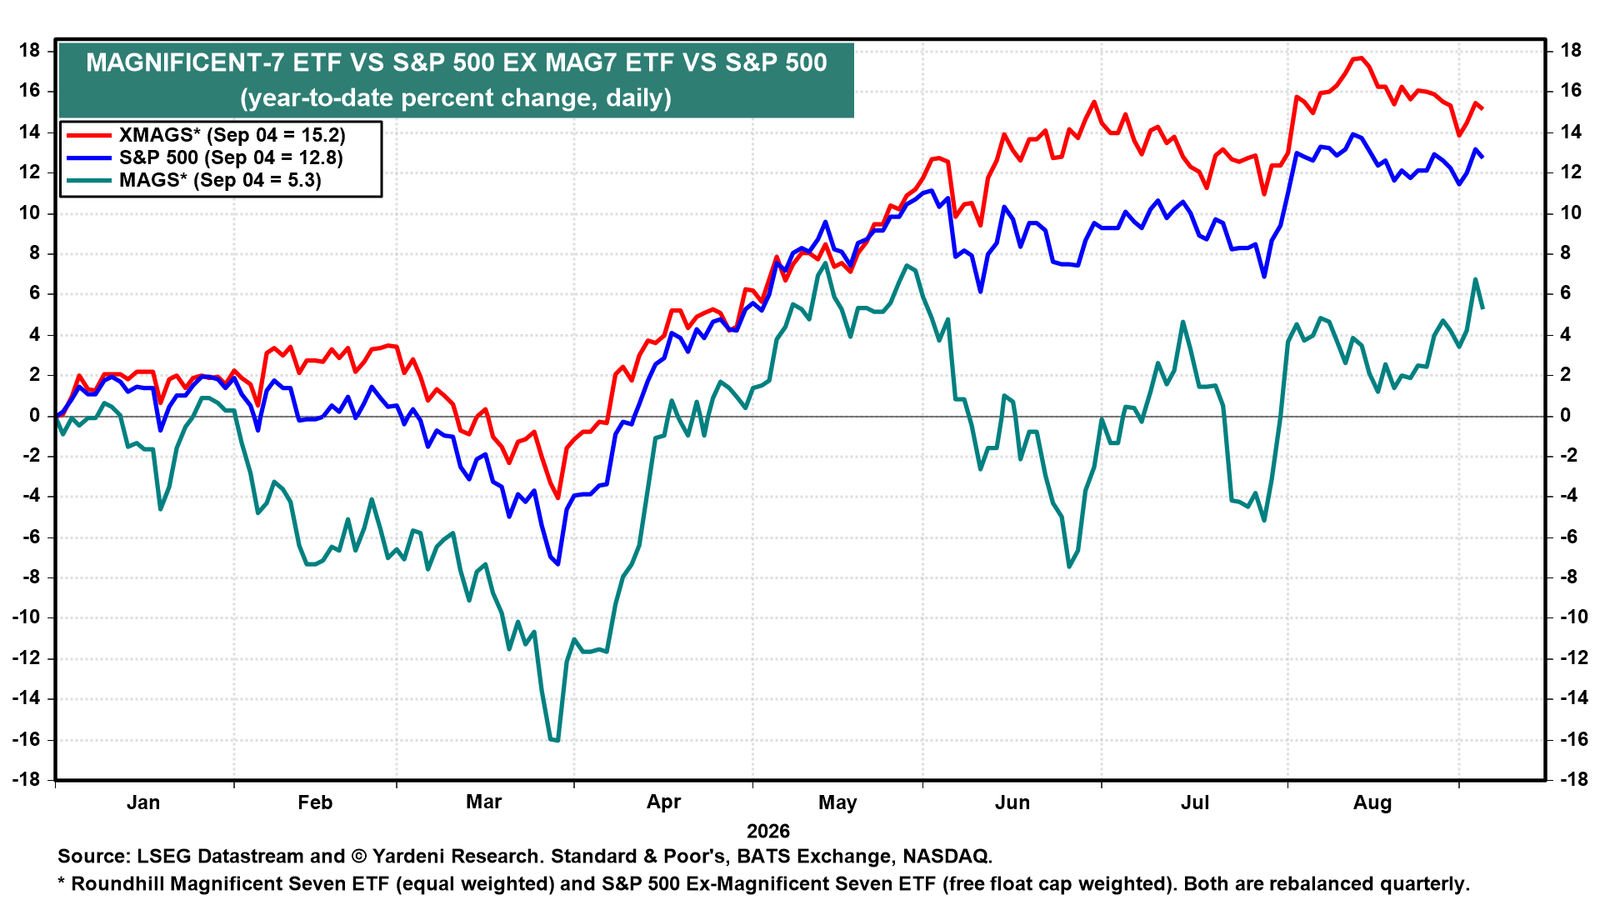
The Magnificent-7 had a good week, with the MAGS ETF up 1.3% while the S&P 500 Ex-Magnificent-7 ETF fell 0.7%. The year still belongs to the Impressive 493. XMAGS is up 15.2% ytd against 12.8% for the S&P 500 and 5.3% for MAGS (chart). The bull market has broadened as we expected.
IV. Bonds
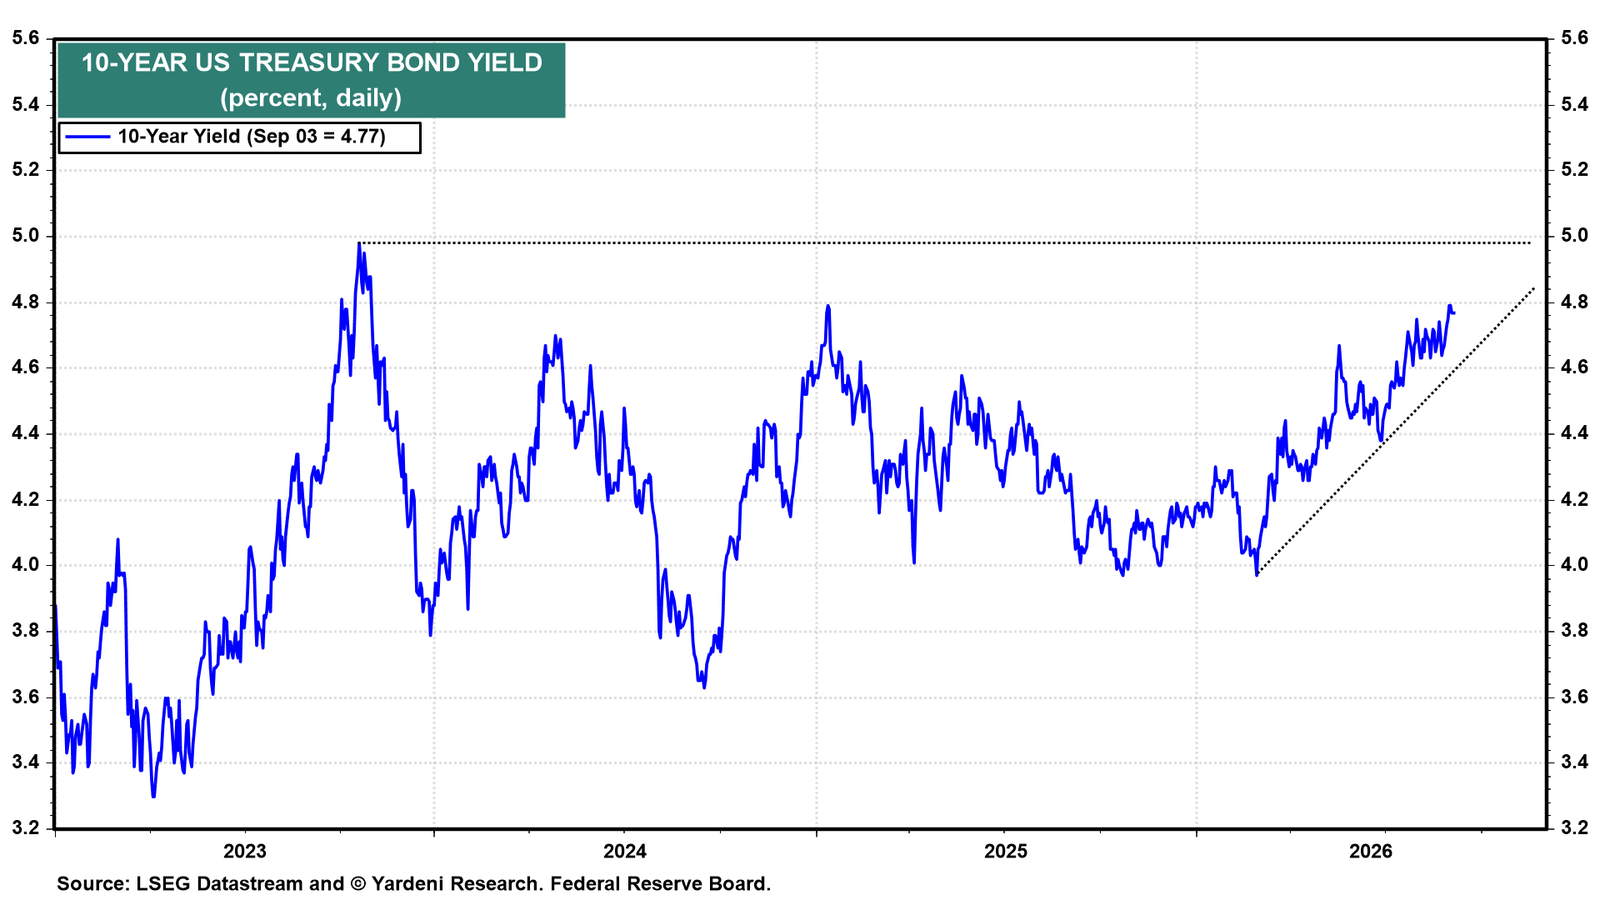
The 10-year Treasury yield is 4.77% and has been trending higher since the spring (chart). It remains inside the 4.00%-5.00% "old normal" range we have argued is the right one for this business cycle. The yield is now pressing against its January 2025 high of 4.81%. A move above that would likely test 5.00%. We would view that level as attractive rather than alarming.