I. Yen-Carry Trade Unwinding?
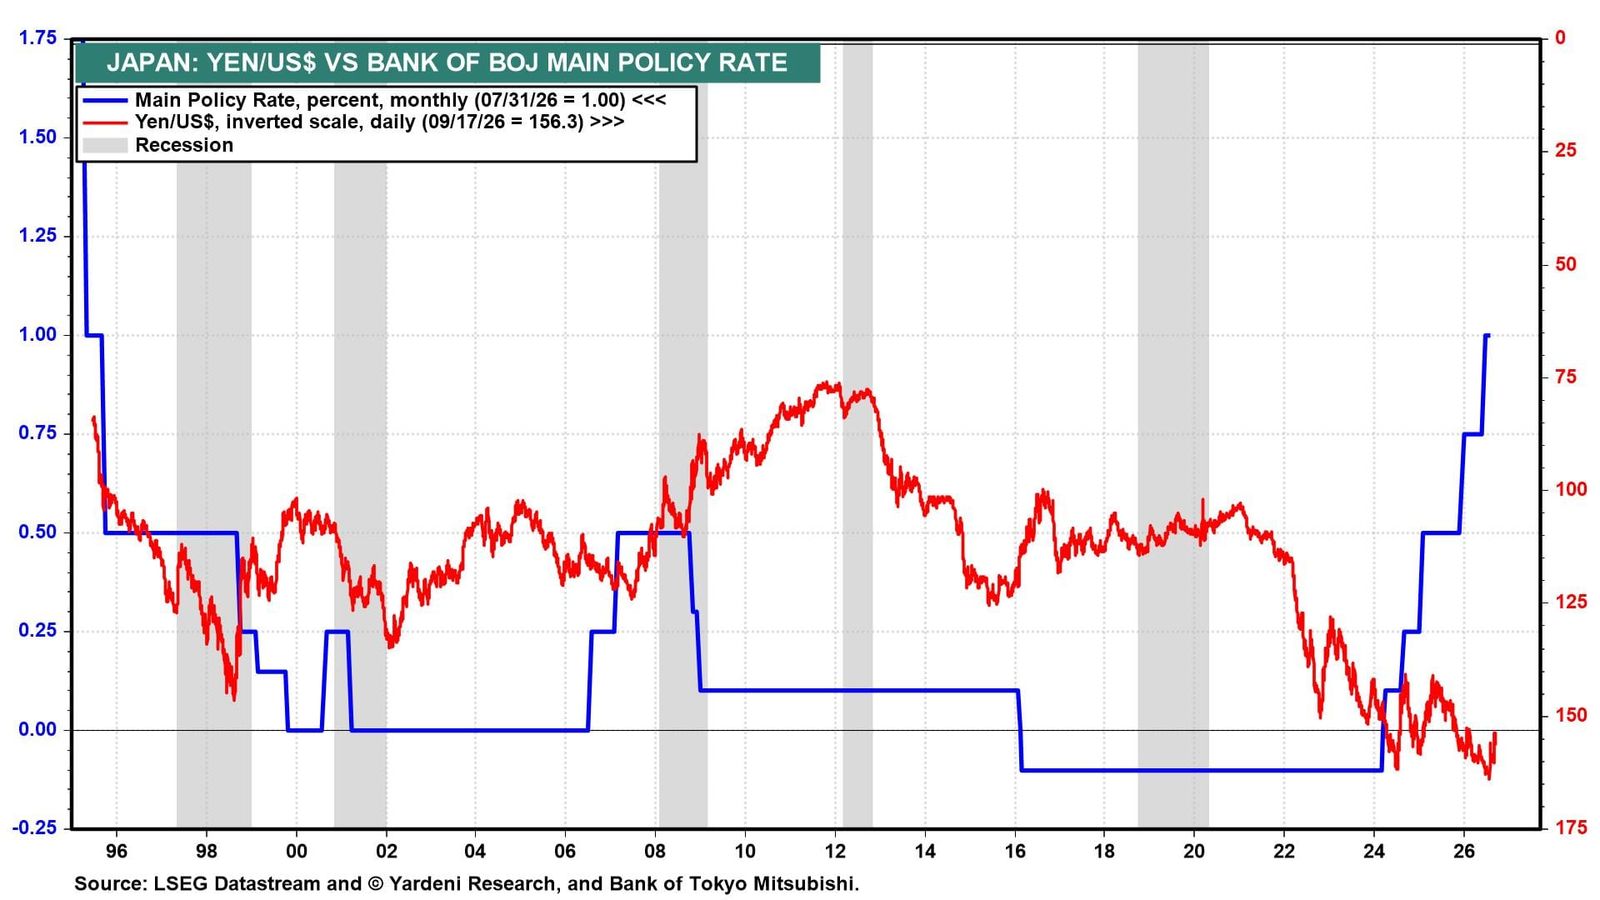
The “yen‑carry trade” has been a key feature of global financial markets since roughly 2012. It rested on two pillars: ultra-low Japanese interest rates and either a weak or relatively stable yen. Hedge funds could borrow funds cheaply in yen, convert the proceeds to other currencies, and buy government bonds in those currencies. The beauty of this trade is that it increased downward pressure on the yen as long as the Bank of Japan (BOJ) kept its official policy rate near zero (chart).
Today, both pillars are cracking. Since early 2024, after years of near-zero and even negative rates, the BOJ has raised its official policy rate to 1.0%, the highest since 1995, with another 25bps hike expected tomorrow morning. Meanwhile, the yen has become more volatile and is expected to strengthen in response to tighter monetary policy. After weakening to around ¥163 per dollar, near a four-decade low, it has rallied since late July following joint Japan-US intervention in the forex market.
Higher Japanese interest rates and likely further yen appreciation have been forcing traders to unwind their yen-carry trades. This might explain the rout in the global bond market since 2024.
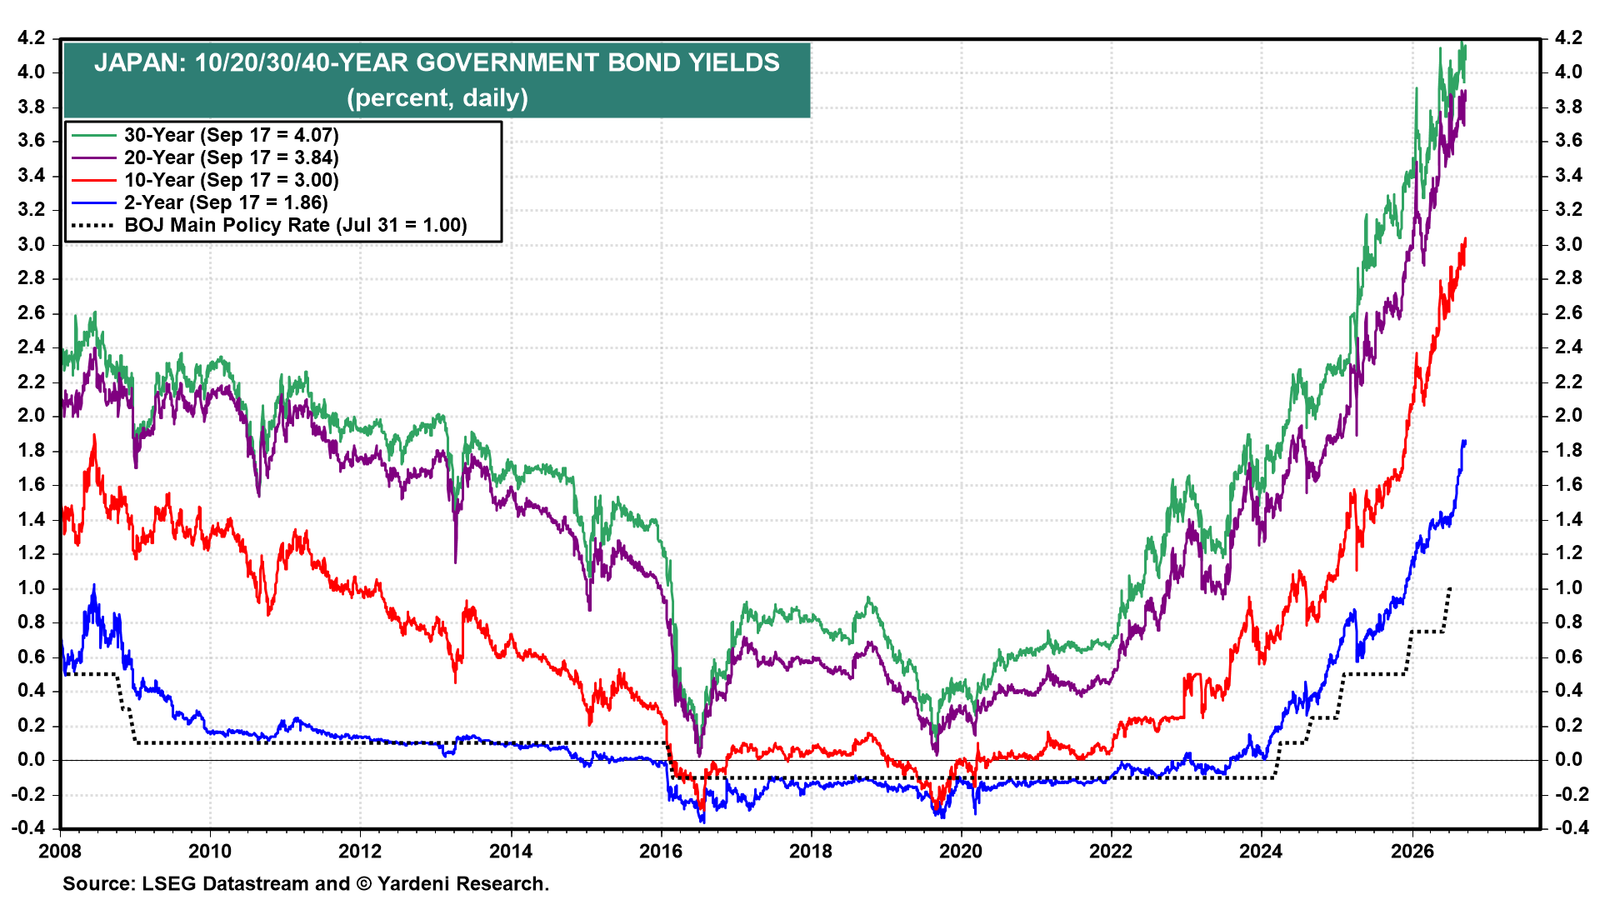
Japan’s bond market confirms the BOJ has more tightening to do. JGB yields have risen sharply alongside the policy rate but remain well above it across the curve (chart). Japan’s Bond Vigilantes are signaling that monetary policy remains too accommodative. Higher Japanese bond yields also encourage Japanese bond investors to return home and reduce their exposure to foreign bonds, especially if the yen continues to rally.
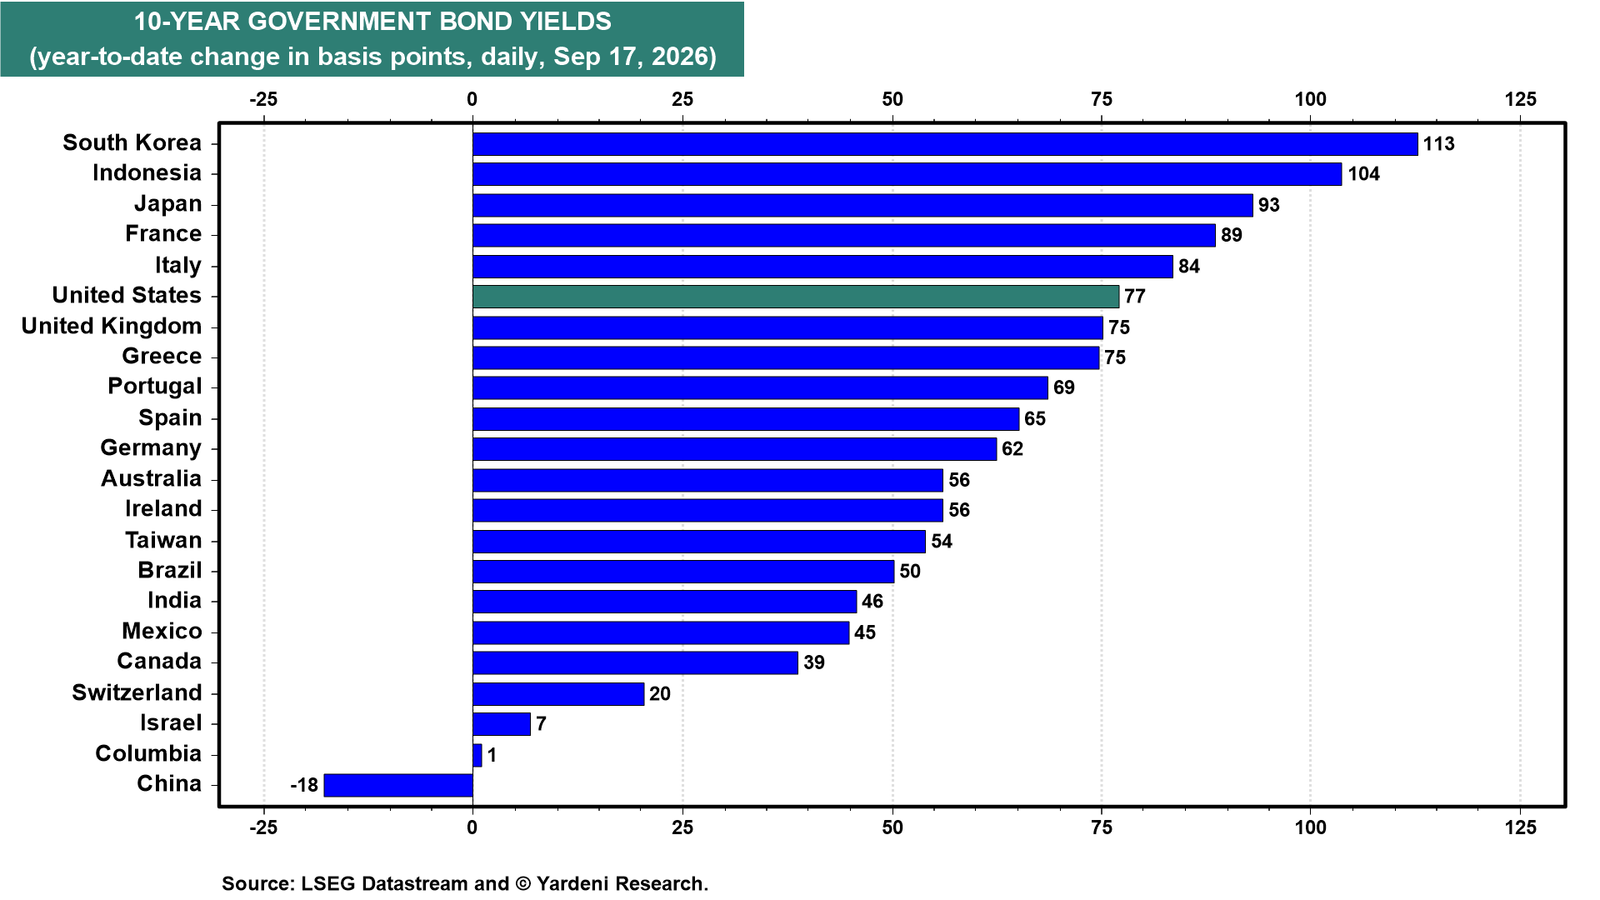
The surge in the 10-year JGB yield has occurred alongside a broad rise in global government bond yields (chart). In our view, the unwinding of yen-funded positions may be a key contributor to the synchronized rise in these bond yields.
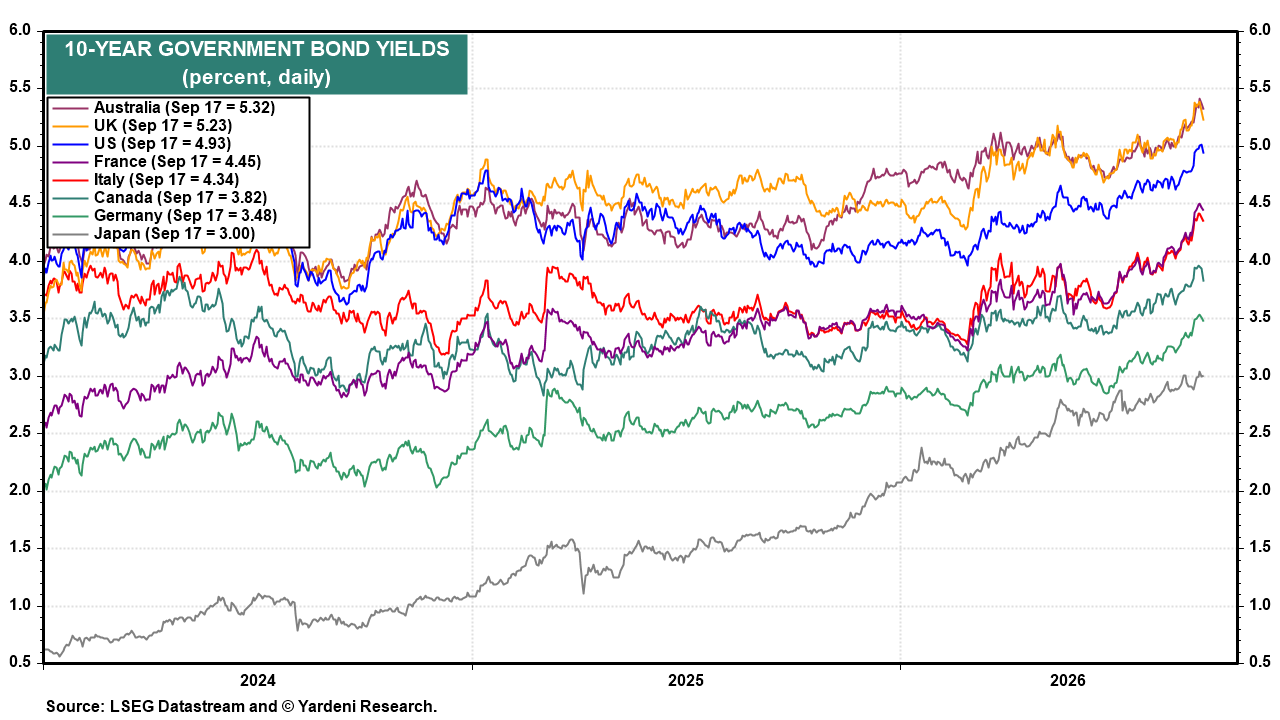
Japan is leading the global bond selloff. Its 10-year yield is up 93bps this year, one of the largest increases globally (chart). We will be interested to see how the BOJ's rate decision affects global yields tomorrow.
II. US Capital Flows
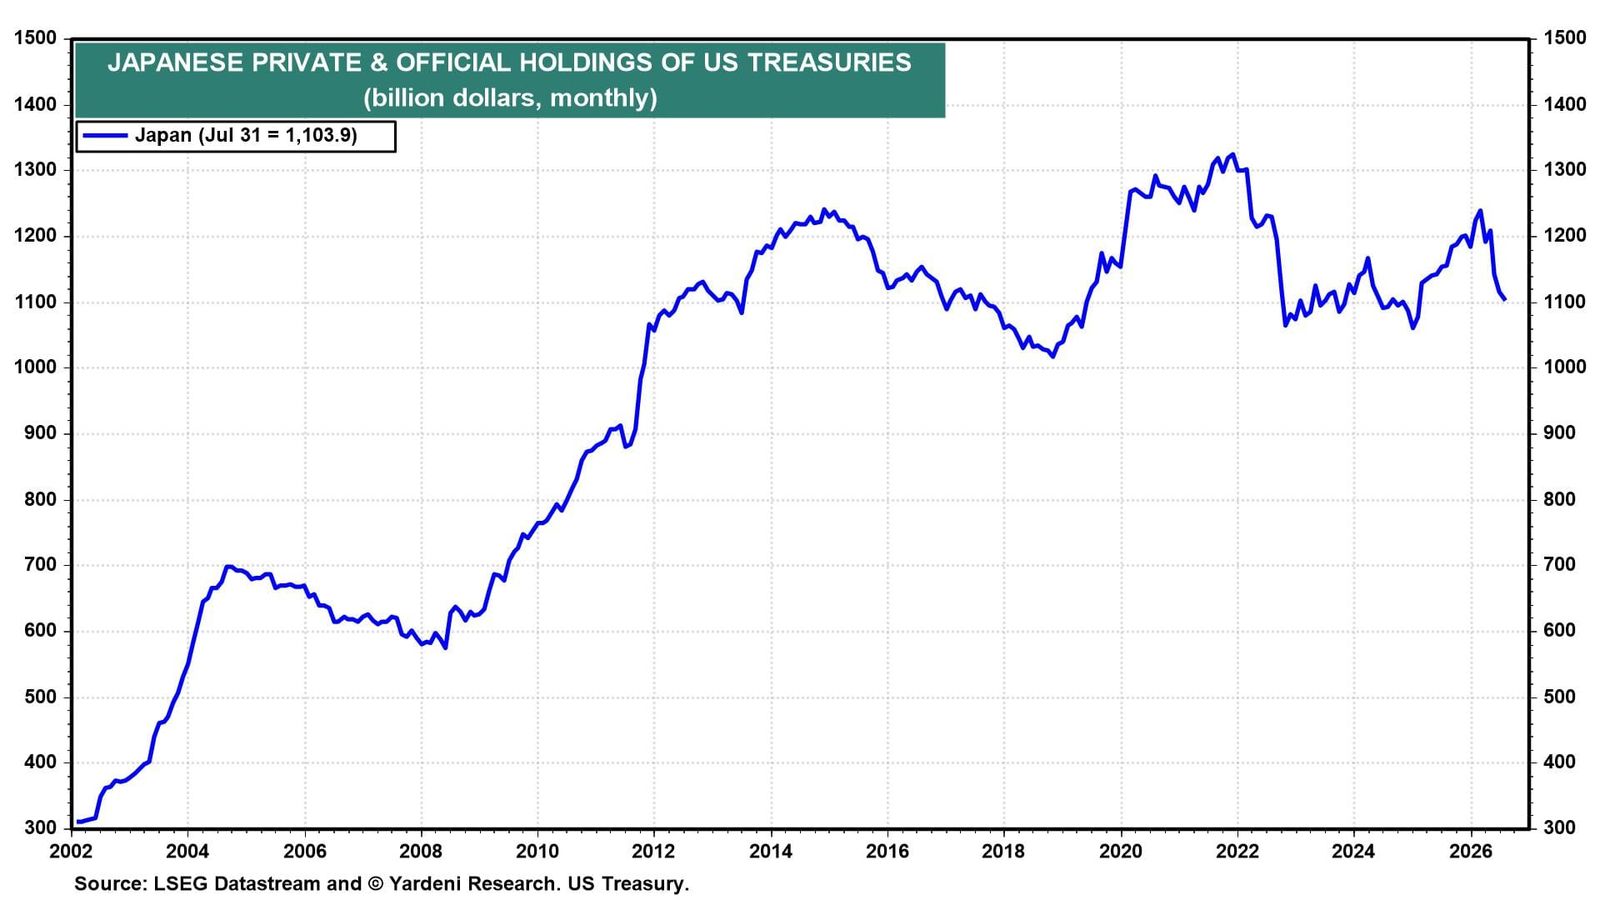
Holdings of US Treasuries by all Japanese accounts (both private and official) have declined recently and appear to be trending lower (chart). The Japanese may be unwinding their overseas positions in global bonds too, as domestic yields rise, making JGBs more attractive again.
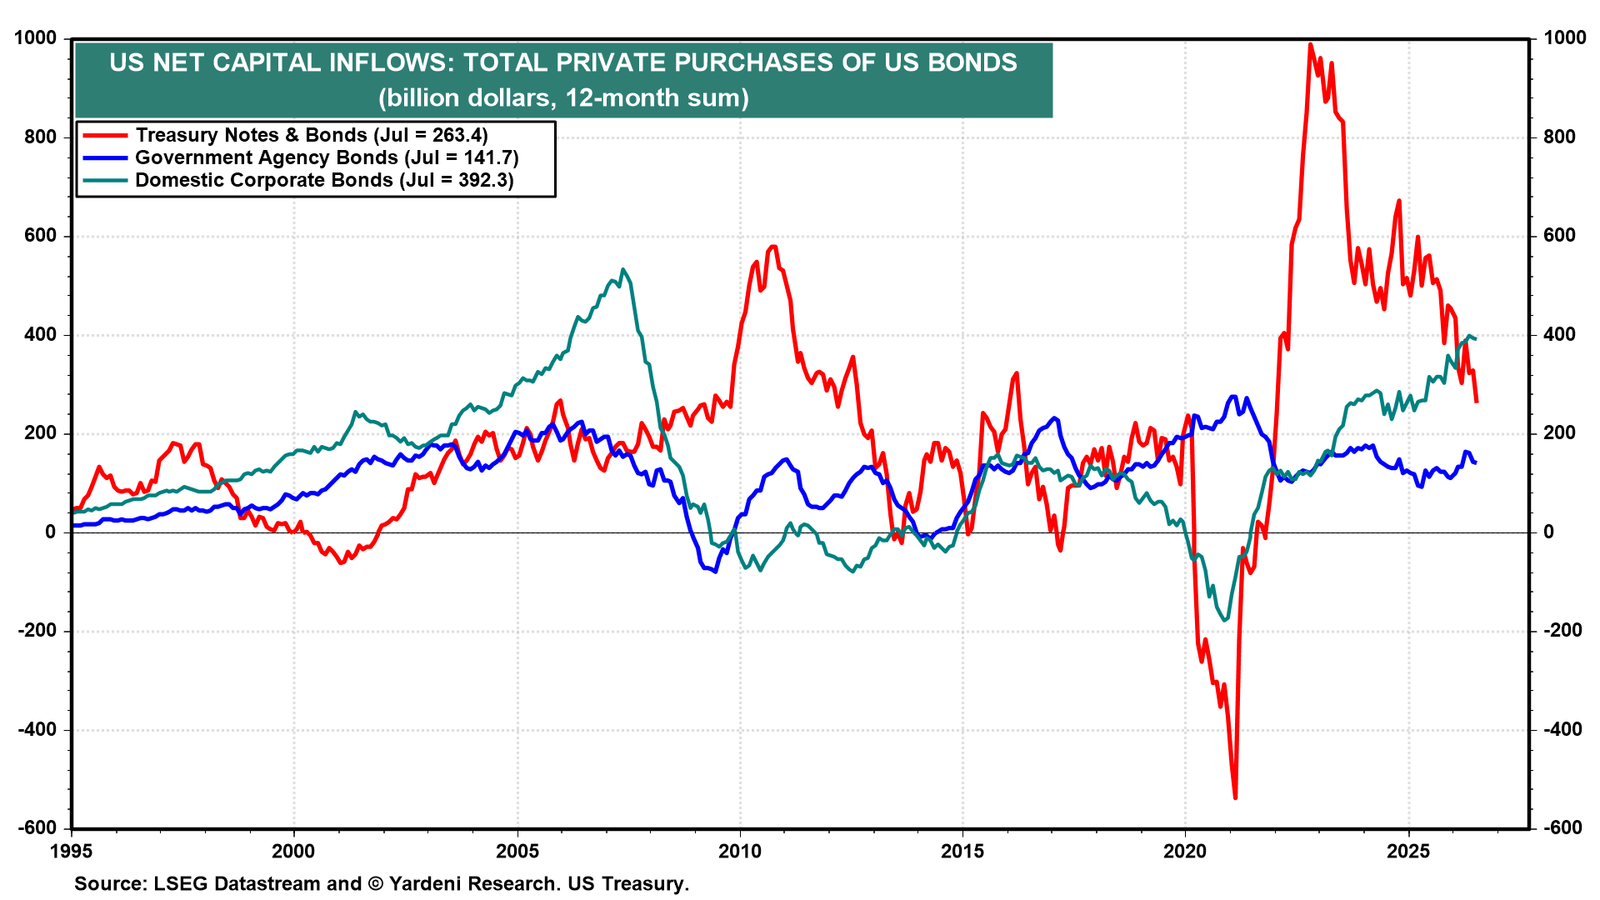
Total private foreign purchases of US Treasury notes and bonds fell to $263.4 billion over the past 12 months, the lowest since 2022. Purchases of US corporate bonds totaled $392.3 billion over the past 12 months, as foreign investors increasingly favor investment-grade debt tied to the AI buildout (chart).
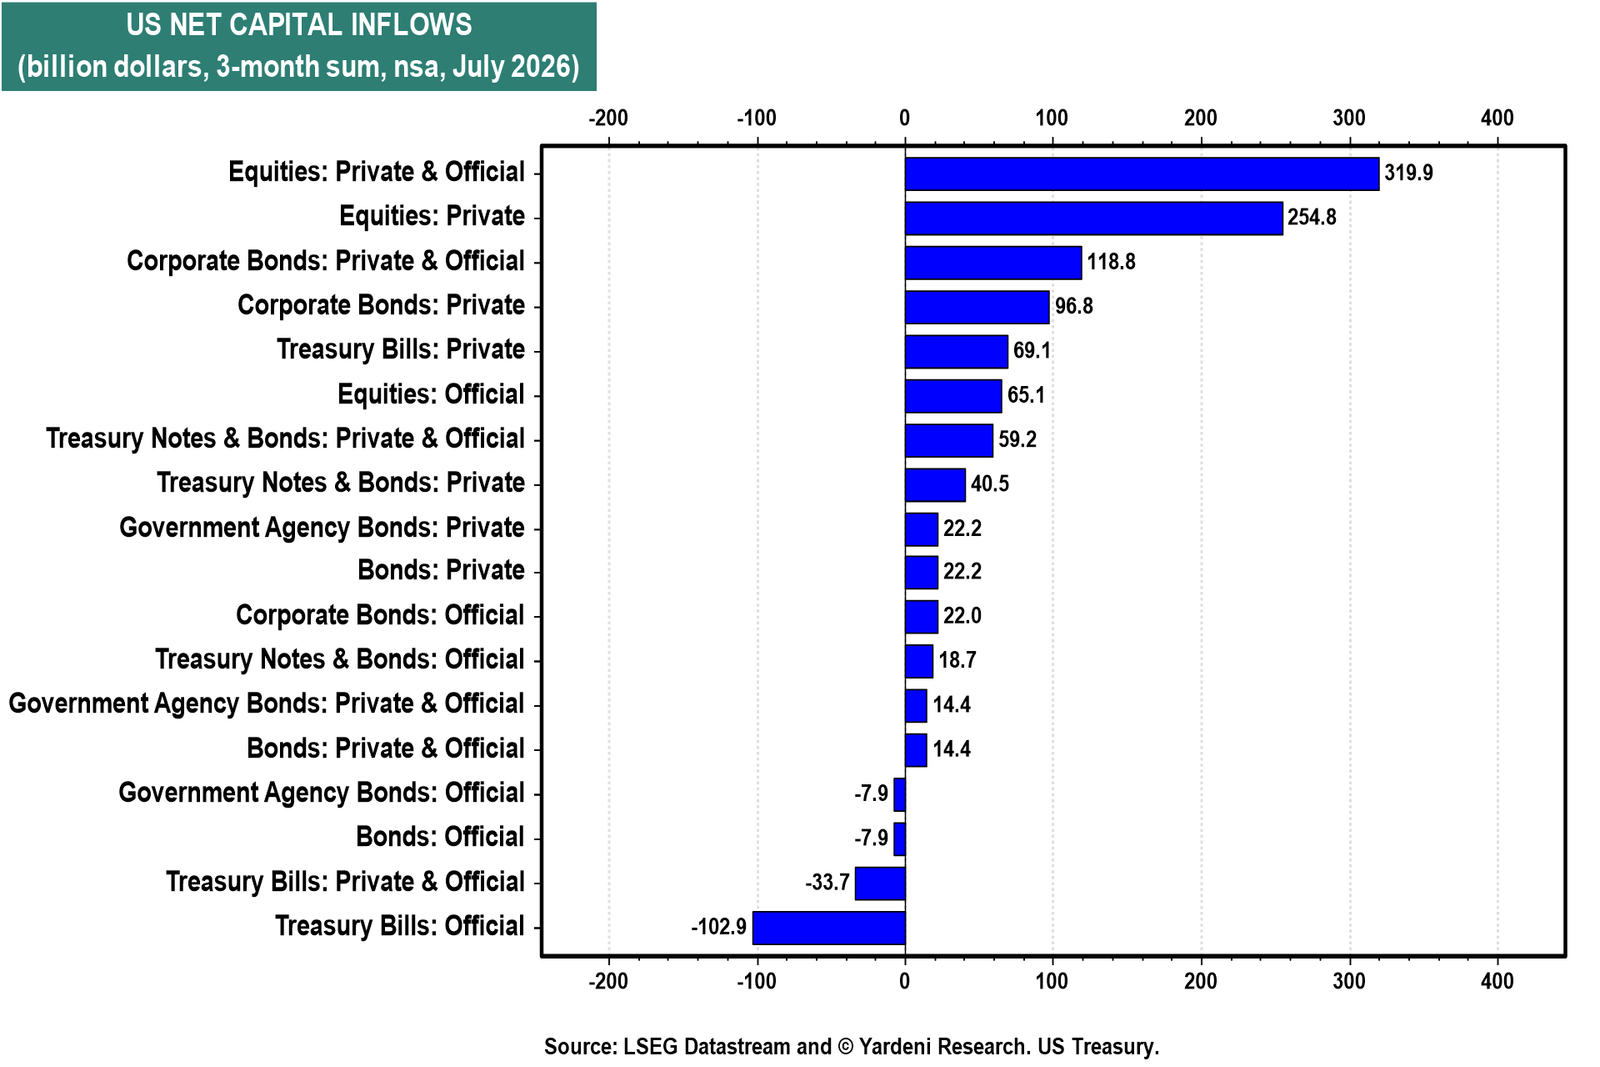
The shift in the composition of foreign demand for US assets is also clear over the past three months through July. Equities attracted the largest inflows, followed by corporate bonds, while purchases of Treasury notes and bonds were much smaller (chart).
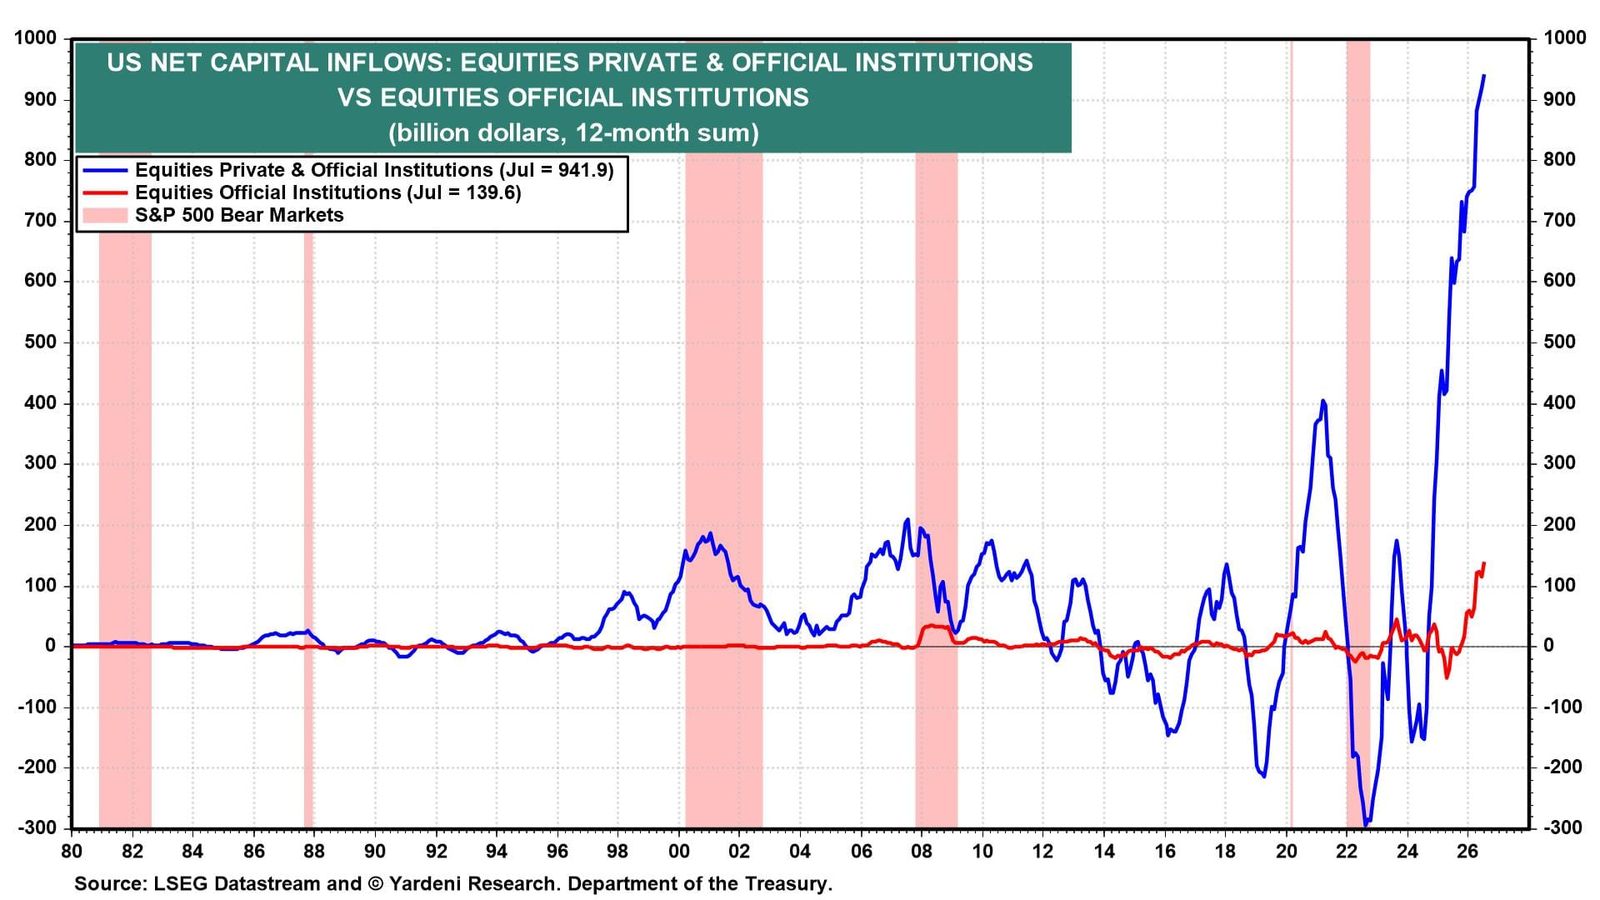
Now get this: Over the past 12 months, foreigners purchased a record $941.9 billion in US equities (chart)! This includes $139.6 billion in US equity purchases by foreign official accounts over the past 12 months.
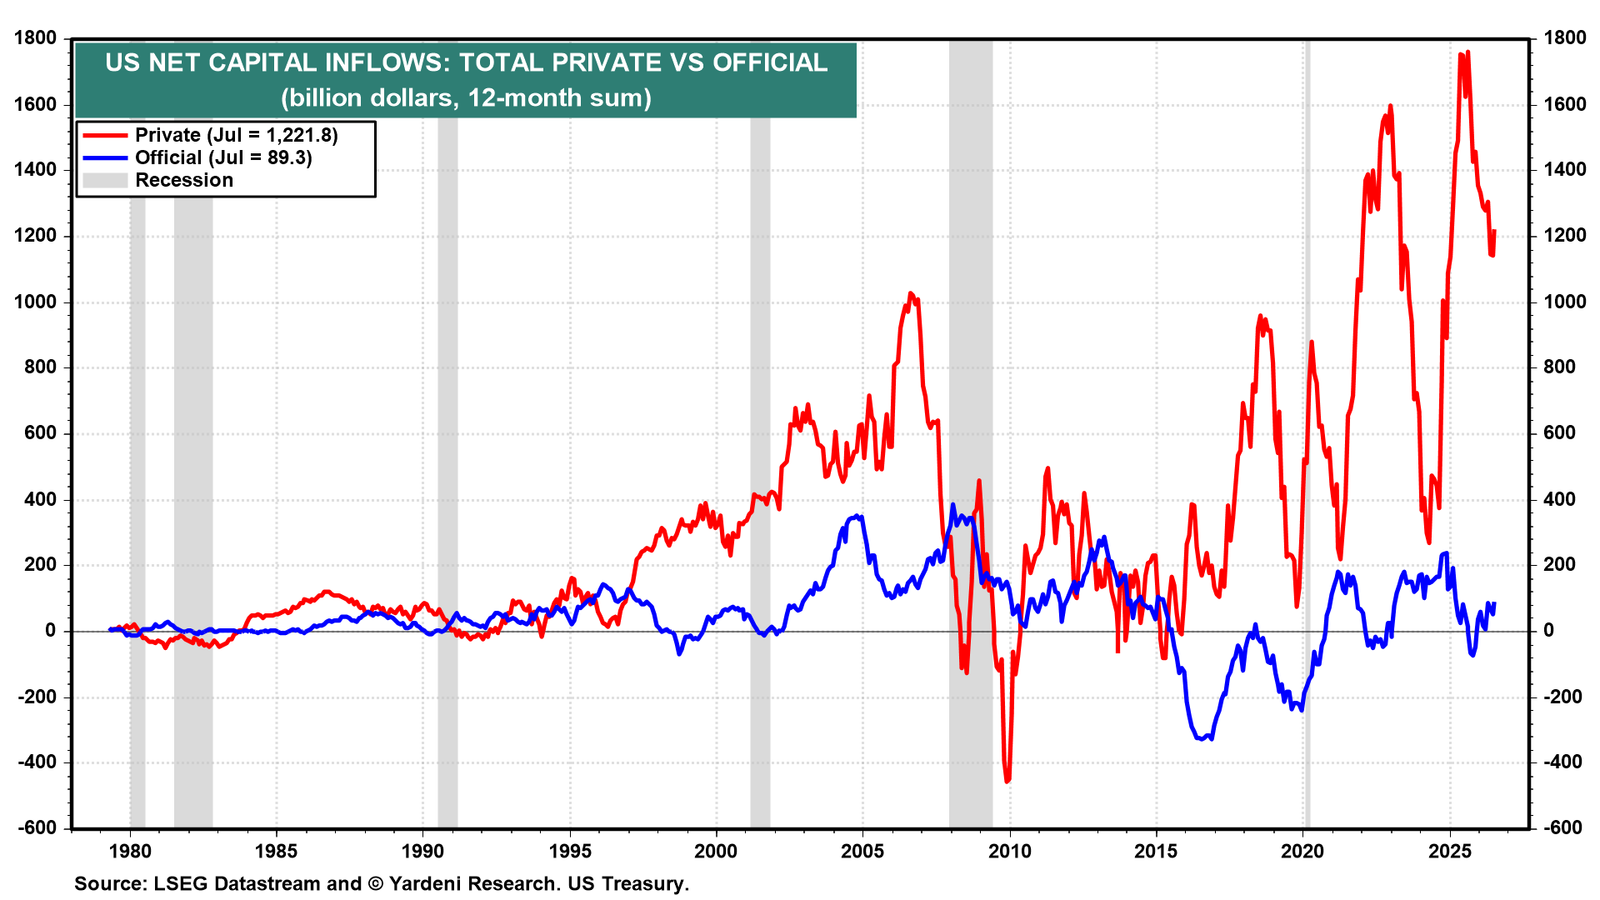
In aggregate, private net foreign capital inflows into the US remained elevated at around $1.2 trillion over the past 12 months (chart). Net inflows from foreign official accounts totaled just $31.7 billion.
III. US Economic Indicators
The strength of the US economy remains the key reason private foreign inflows into US equities and corporate bonds are so strong. Here is a look:
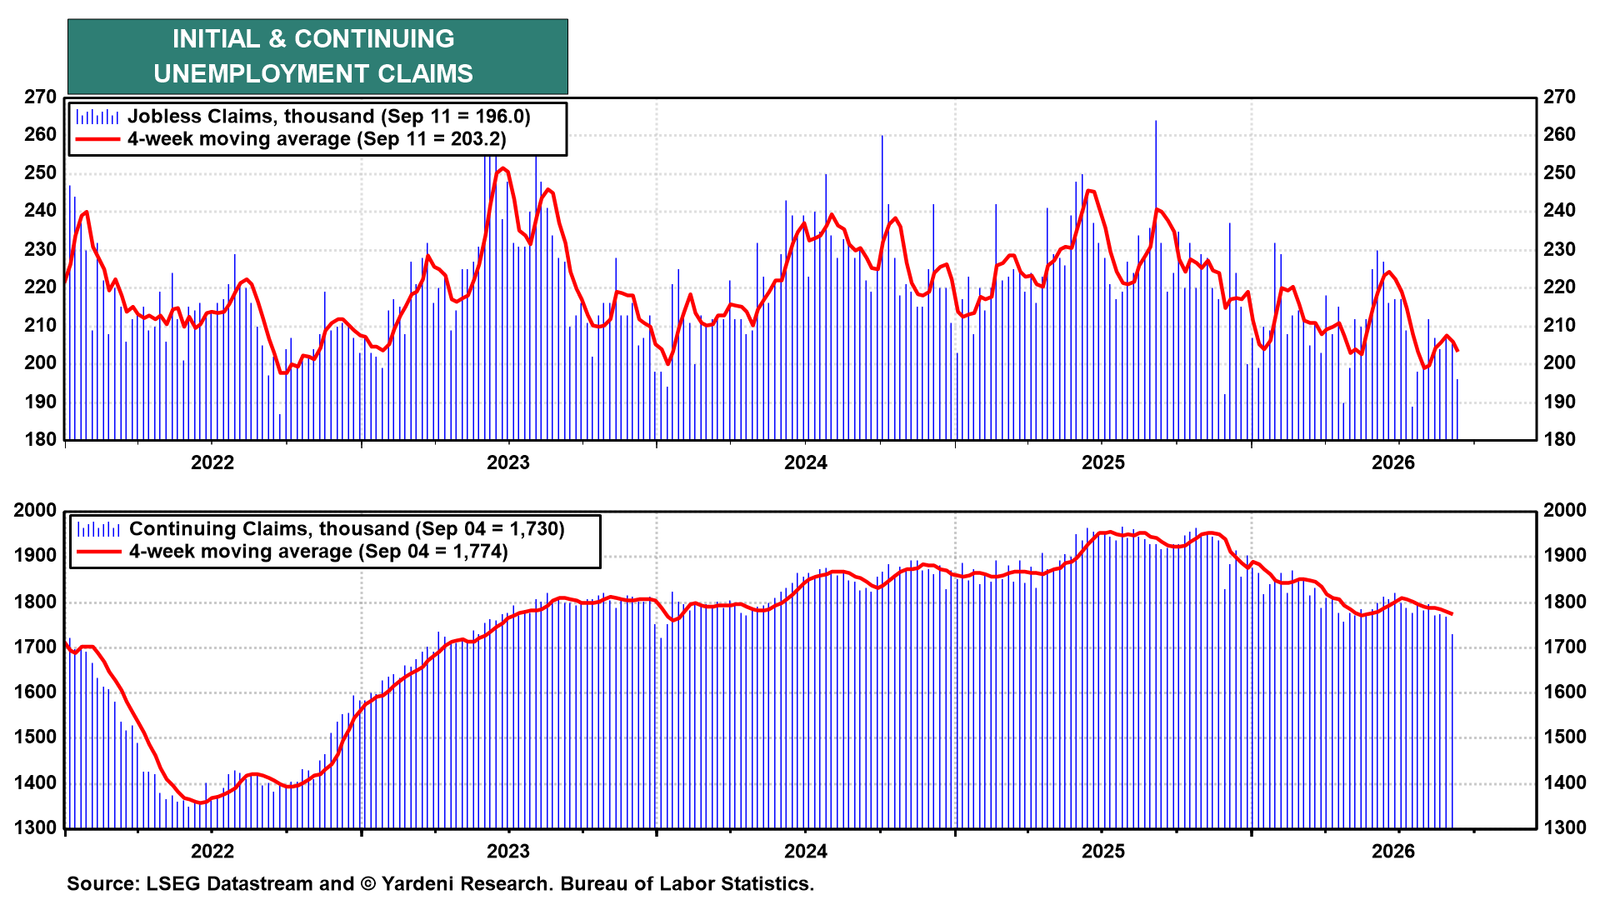
(1) Jobless claims. The US labor market remains in good shape. Initial jobless claims fell to 196,000 during the week of September 11 and have now come in below 200,000 five times this year, versus just once in 2025 (chart). Meanwhile, the four-week moving average of continuing claims fell to its lowest level since January 2024 and has declined for four consecutive weeks.
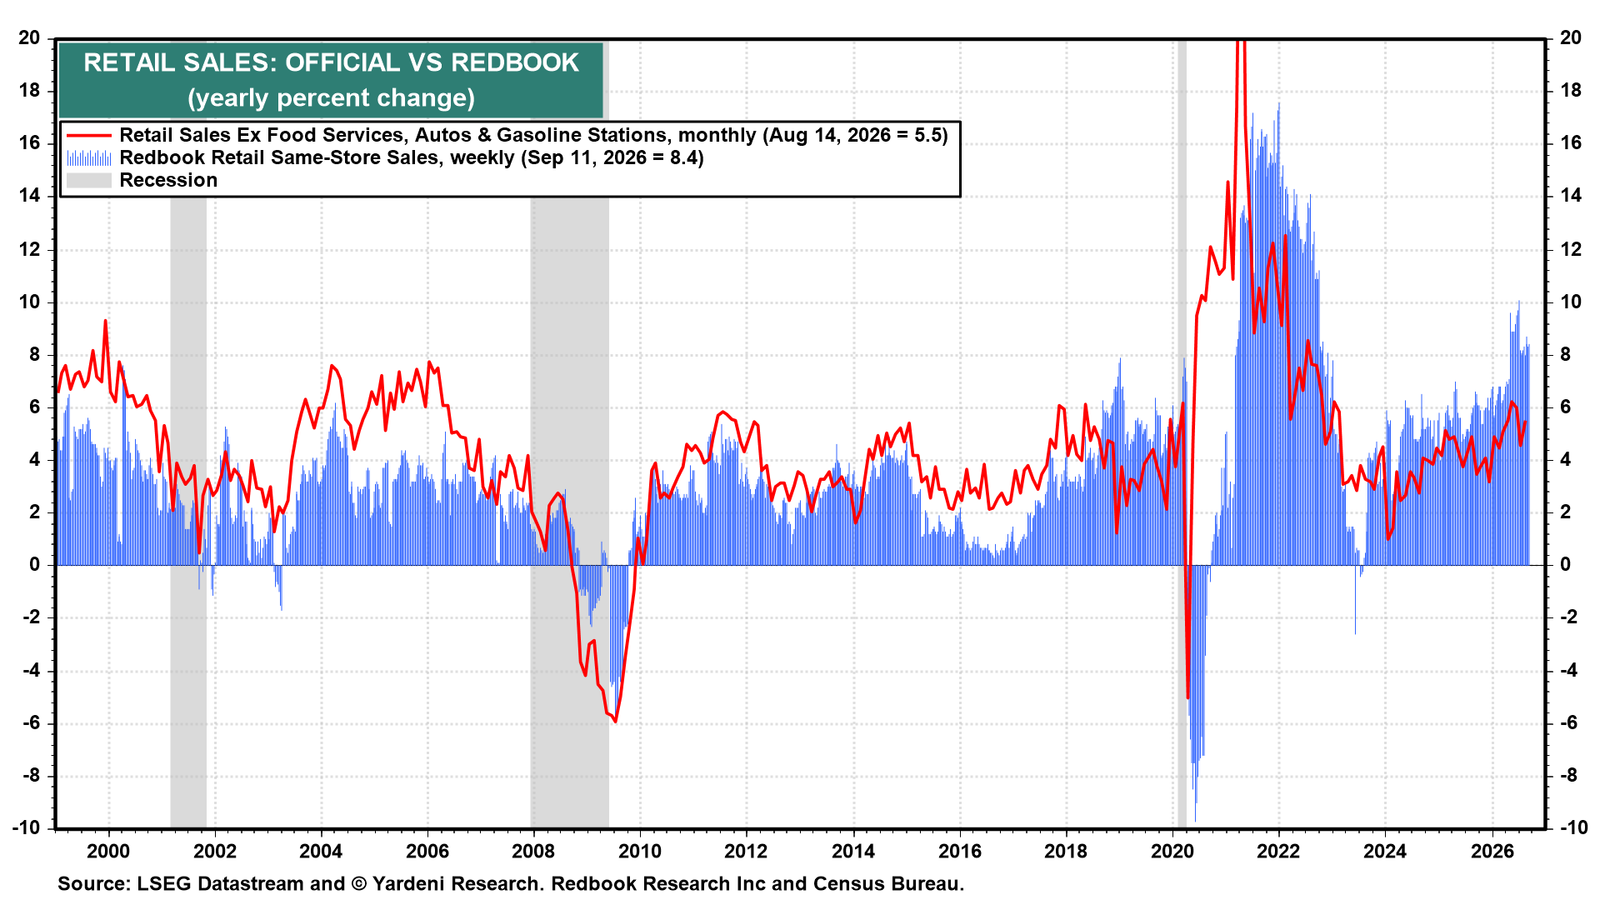
(2) Consumer spending. After the August retail sales report showed consumer spending remained robust, Redbook data suggest that strength has carried into September. Same-store sales rose 8.4% y/y during the week of September 11, well above the 5.8% average in 2025 (chart).
Bank of America’s August Consumer Checkpoint Survey also points to robust spending. Card spending per household rose 0.9% m/m and 4.5% y/y, more than four times the 2025 average. Excluding gasoline, spending rose 3.7% y/y, more than 2.5 times the 2025 pace.
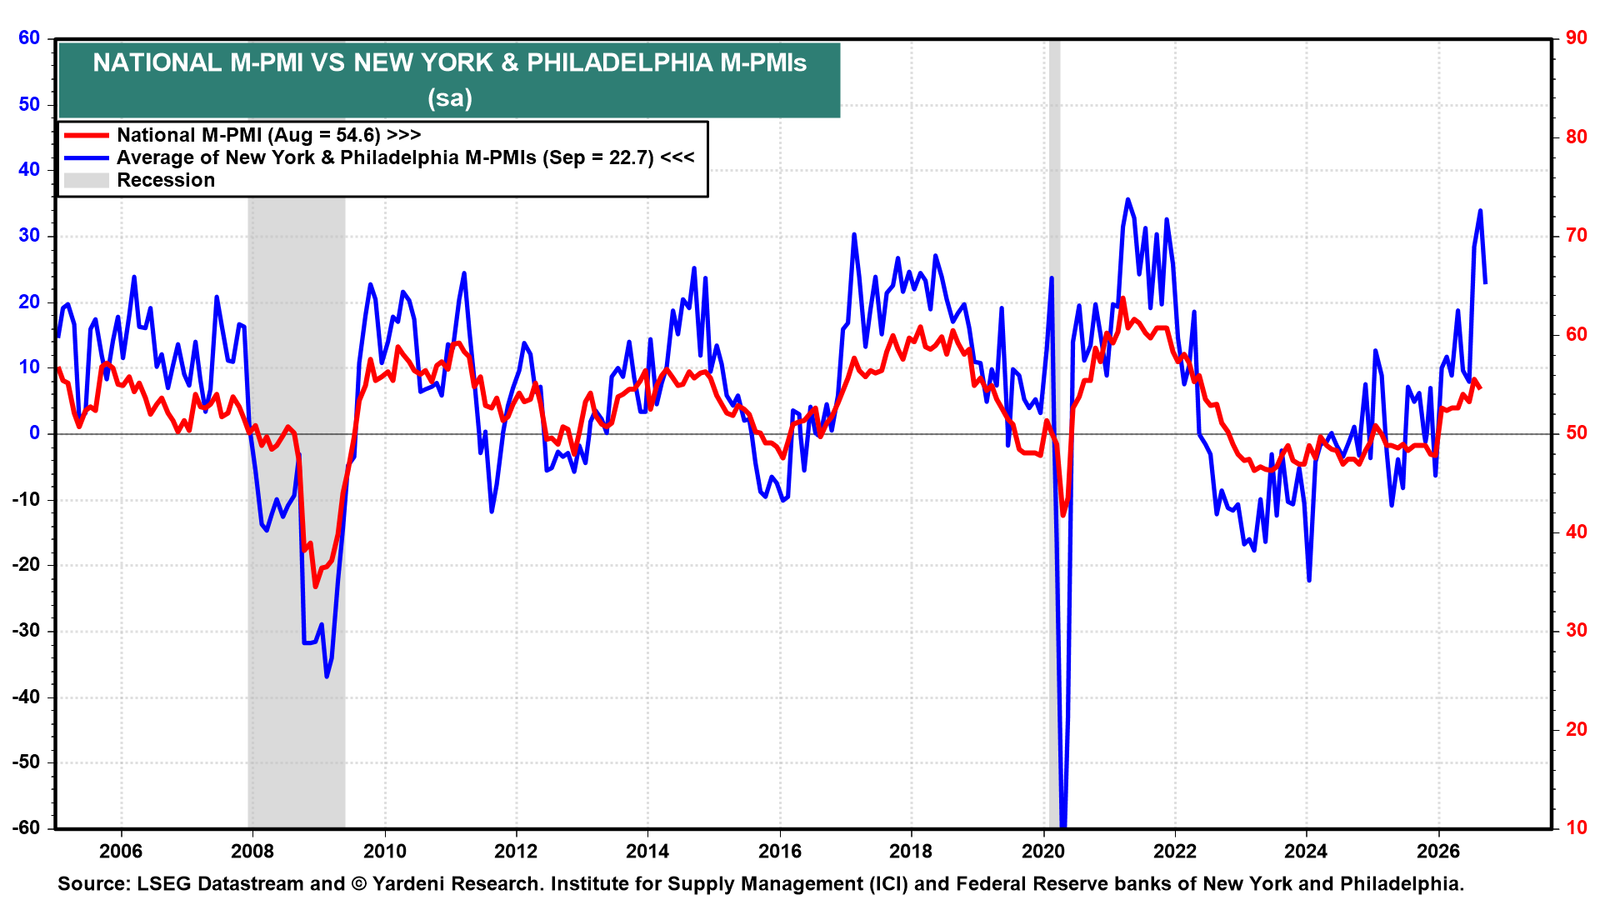
(3) Manufacturing. Economic activity in manufacturing also remains remarkably robust. The average of the New York and Philadelphia Fed manufacturing indexes remained elevated at 22.7 in September, suggesting the national M-PMI likely remained comfortably in expansion territory (chart).
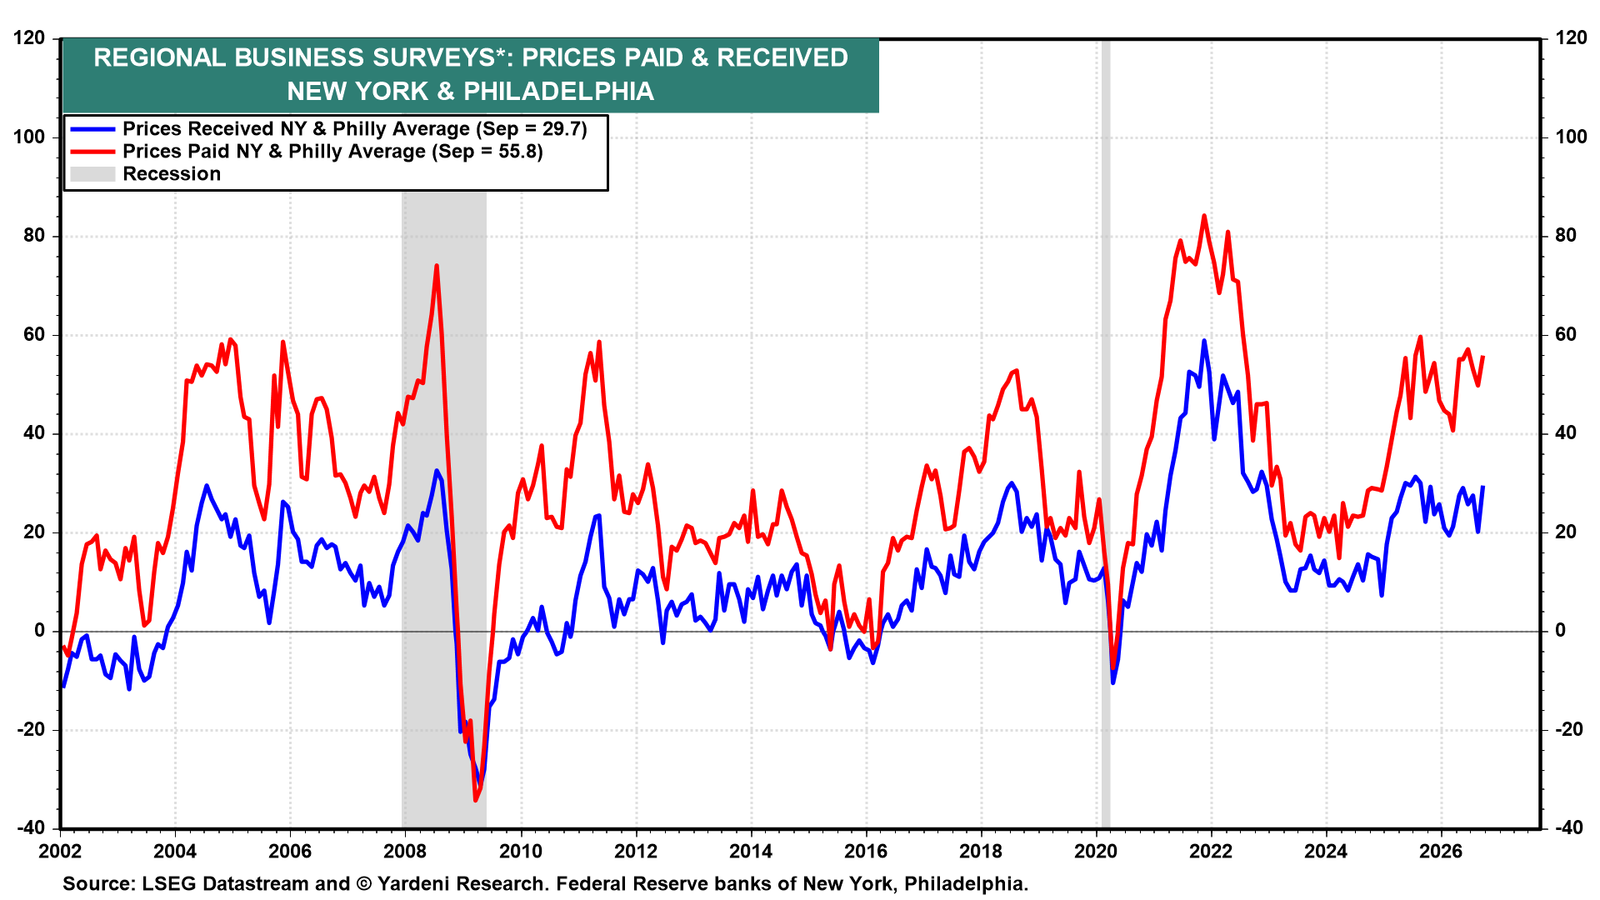
The regional prices-paid and prices-received indexes remained high, suggesting that inflation pressures remain troublesome (chart).