I. The Silver Tsunami
The “silver tsunami” refers to the large wave of Baby Boomers moving into retirement and the rise in the number of older households. That demographic shift is increasingly reshaping America’s consumer economy, as older households account for a growing share of income and spending power.
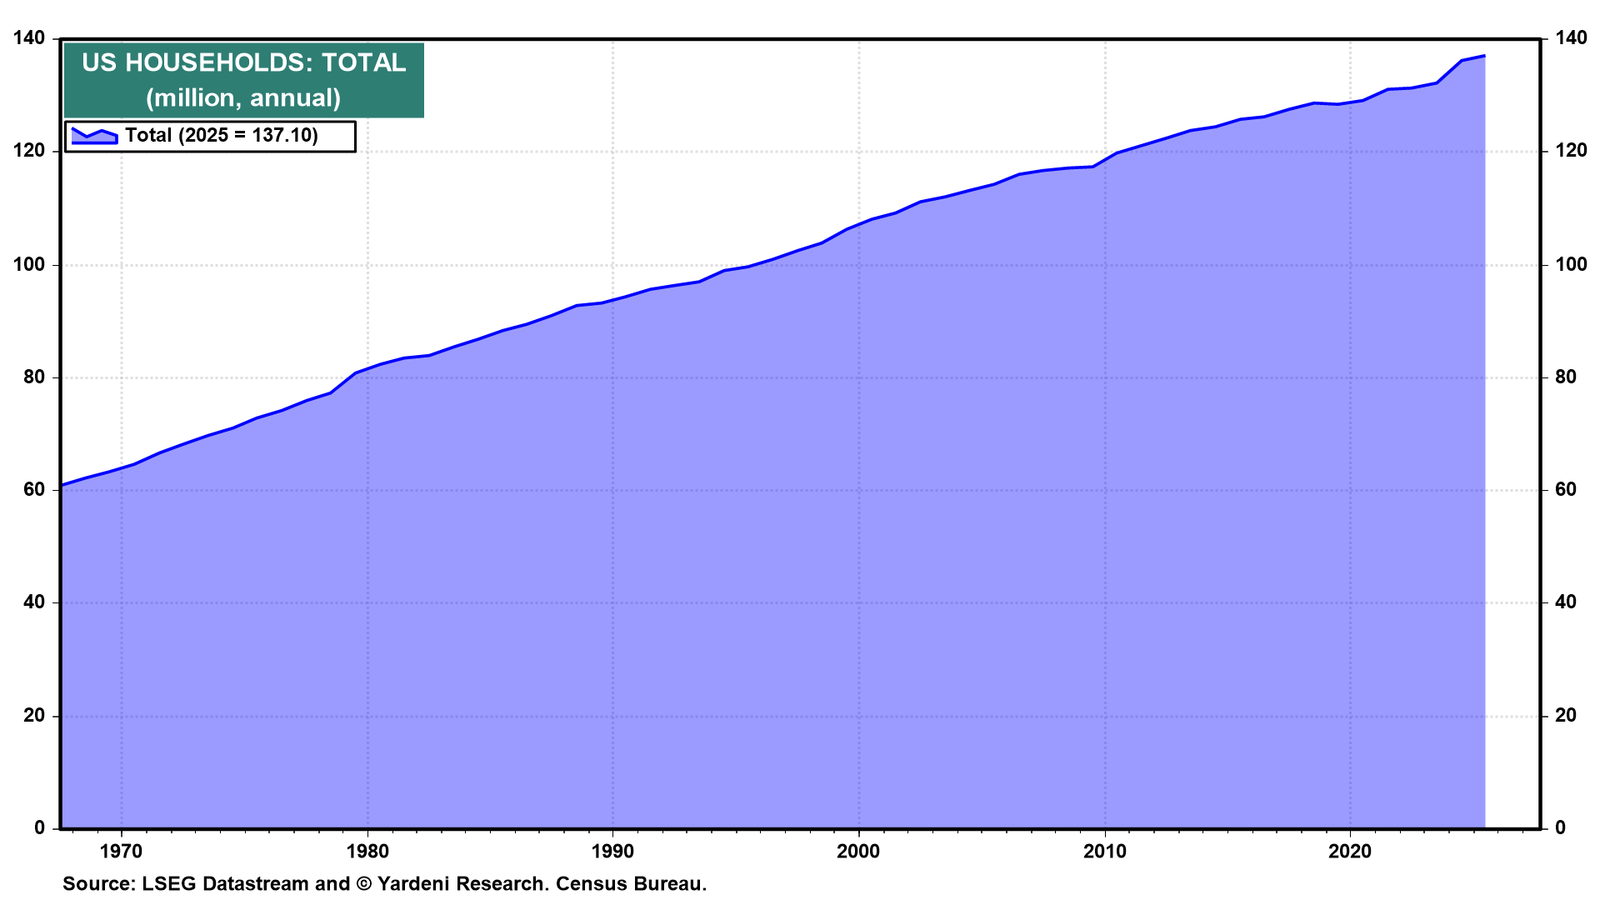
The scale of that shift becomes clearer when viewed against the broader expansion of the household sector. The US had 137.1 million households in 2025, more than twice as many as in the late 1960s (chart). That expanding household base has created a much larger pool of consumers earning and spending income.
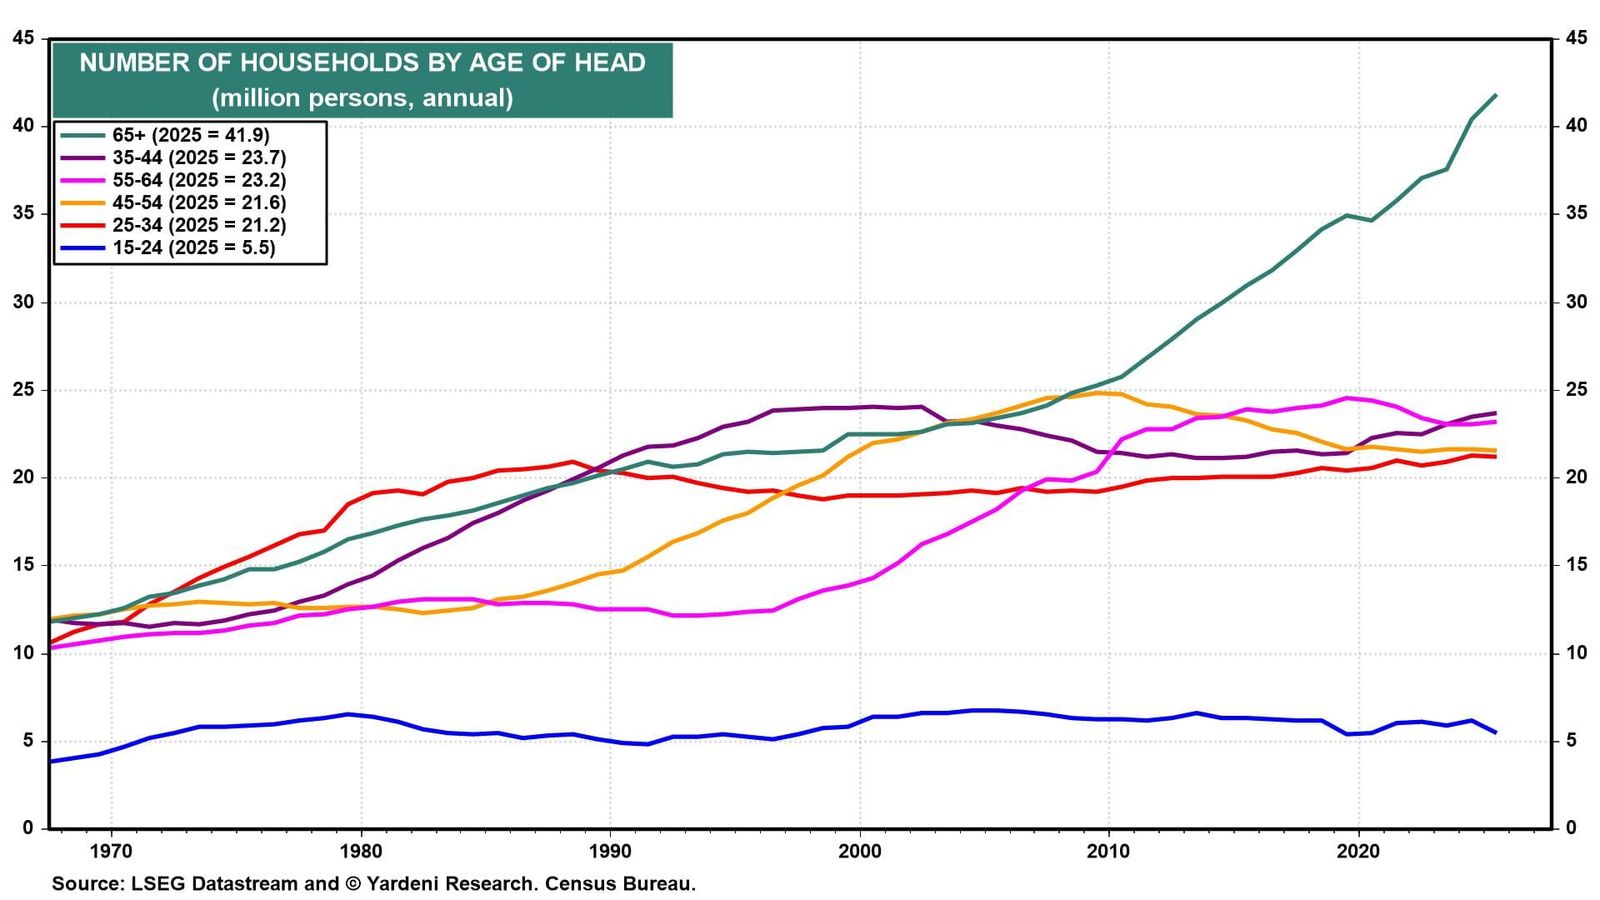
Just as important is the change in the age composition of those households. The number headed by someone 65 or older has climbed to 41.9 million, far above any other age group (chart). Most younger cohorts have grown much more slowly. That's because by 2029, everyone in the large Baby Boomer cohort will be 65 years old or older, and they are living longer.
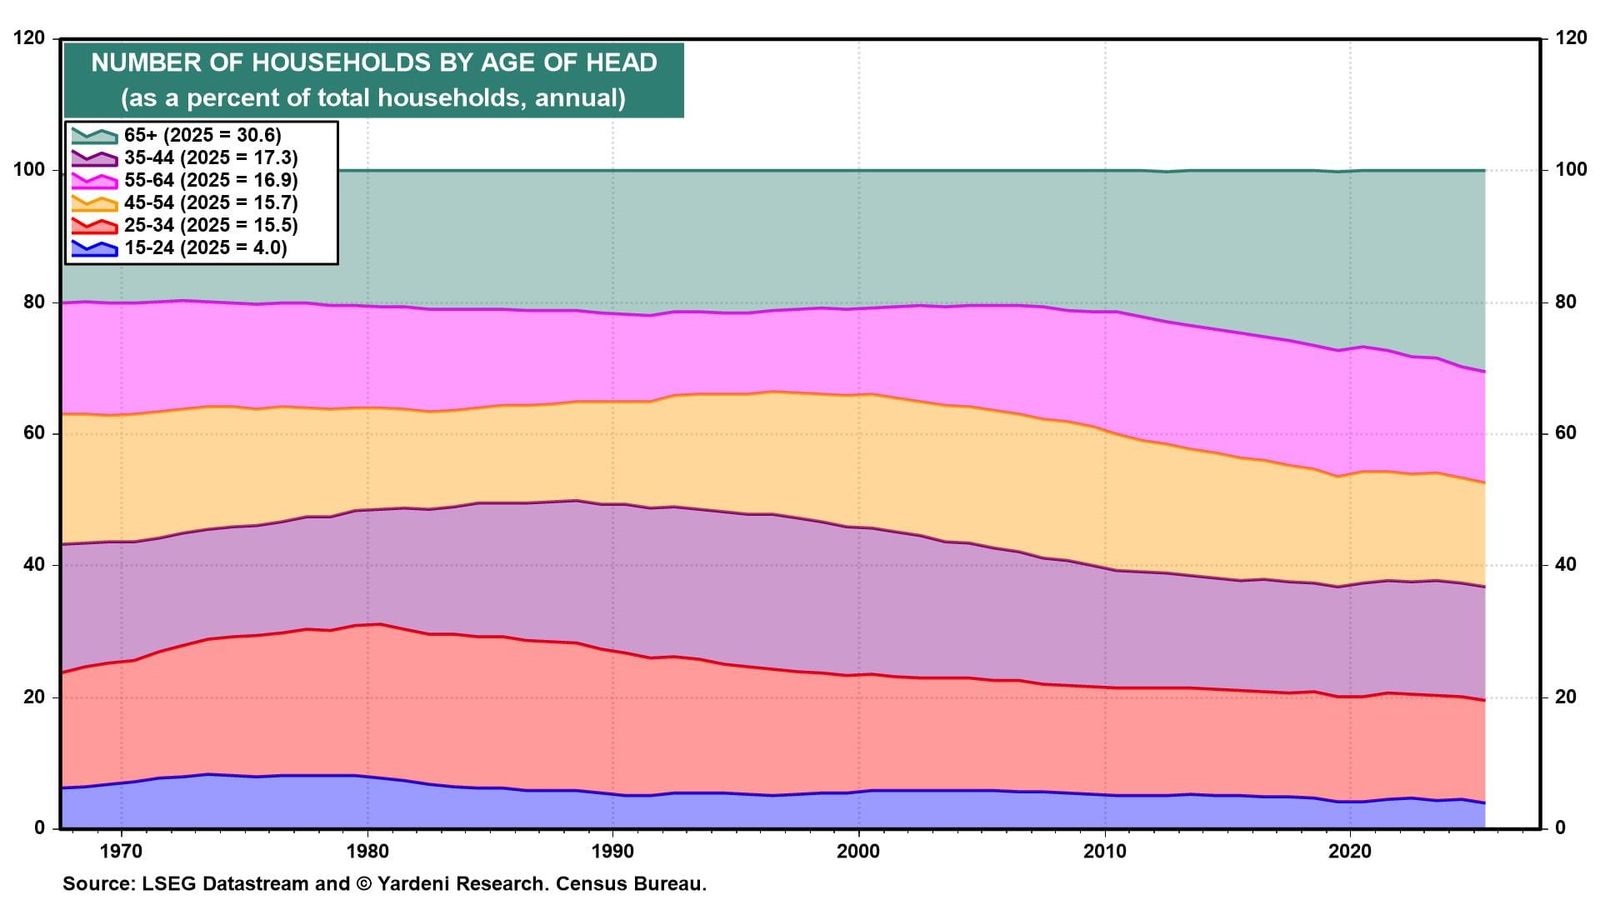
As a result, the 65+ group now accounts for 30.6% of all US households, up from roughly one-fifth around the turn of the century (chart). Nearly one in three households is now headed by a senior.
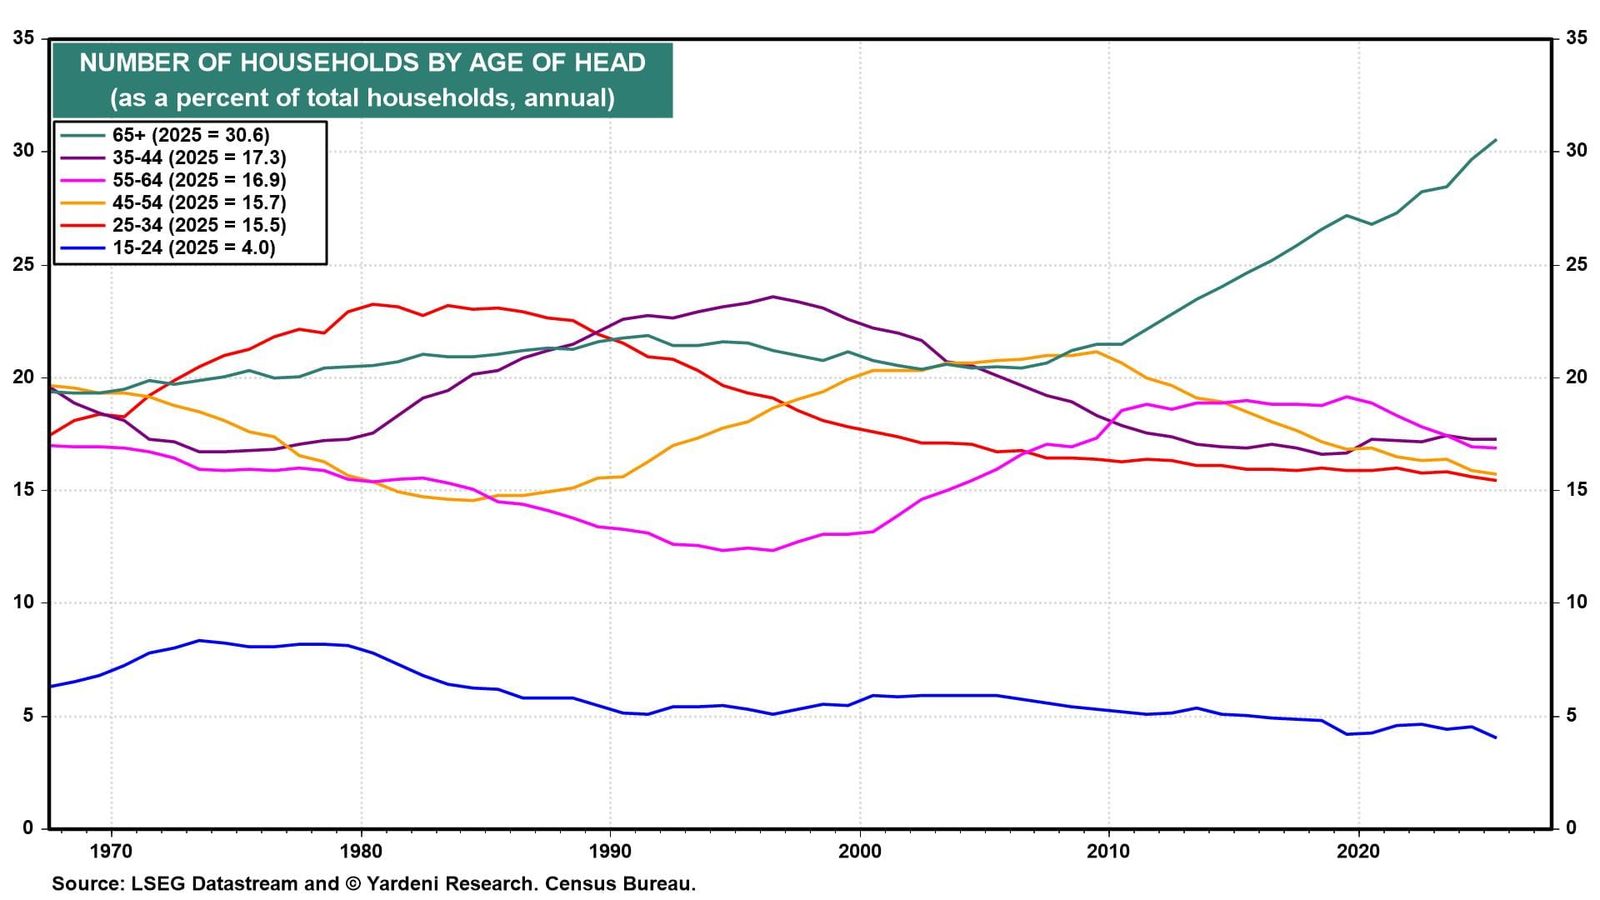
Over time, the 65+ cohort has taken up a steadily larger share of the household sector, while the shares represented by several younger age groups have declined (chart).
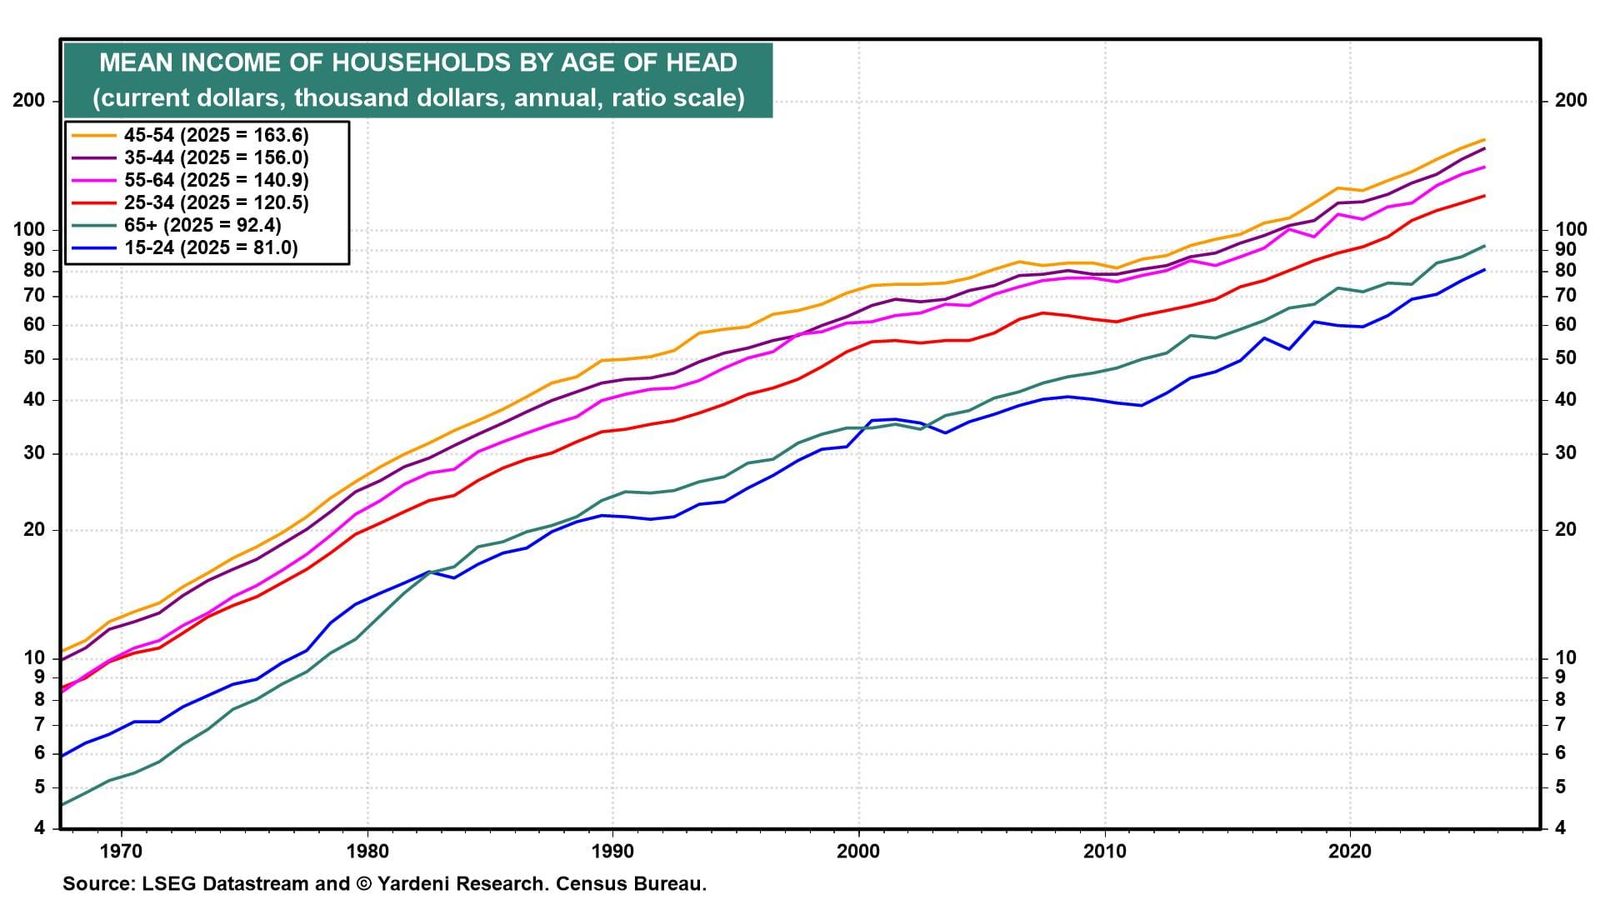
Income follows a clear life-cycle pattern. Household income generally rises through the working years, peaks in middle age, and then falls after retirement. Mean income was $163,600 for households headed by 45- to 54-year-olds in 2025, compared with $92,400 for the 65+ group (chart).
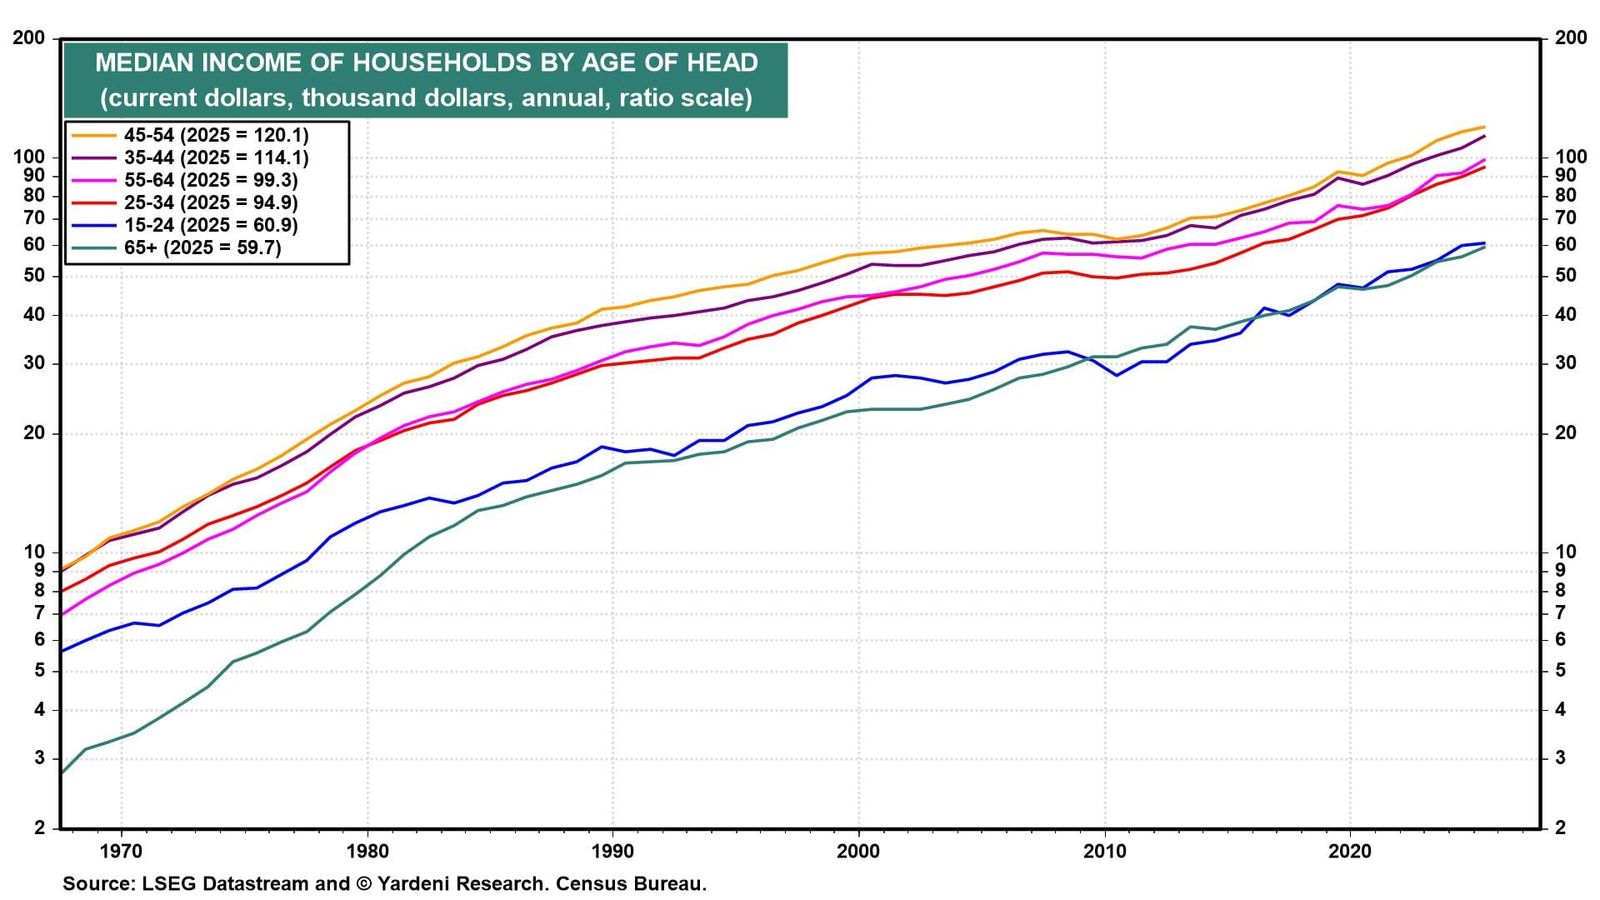
Median income tells the same basic story. It is highest among households headed by 45- to 54-year-olds and lowest among households headed by seniors, confirming that the pattern is not simply being driven by a small number of high-income households distorting the mean (chart).
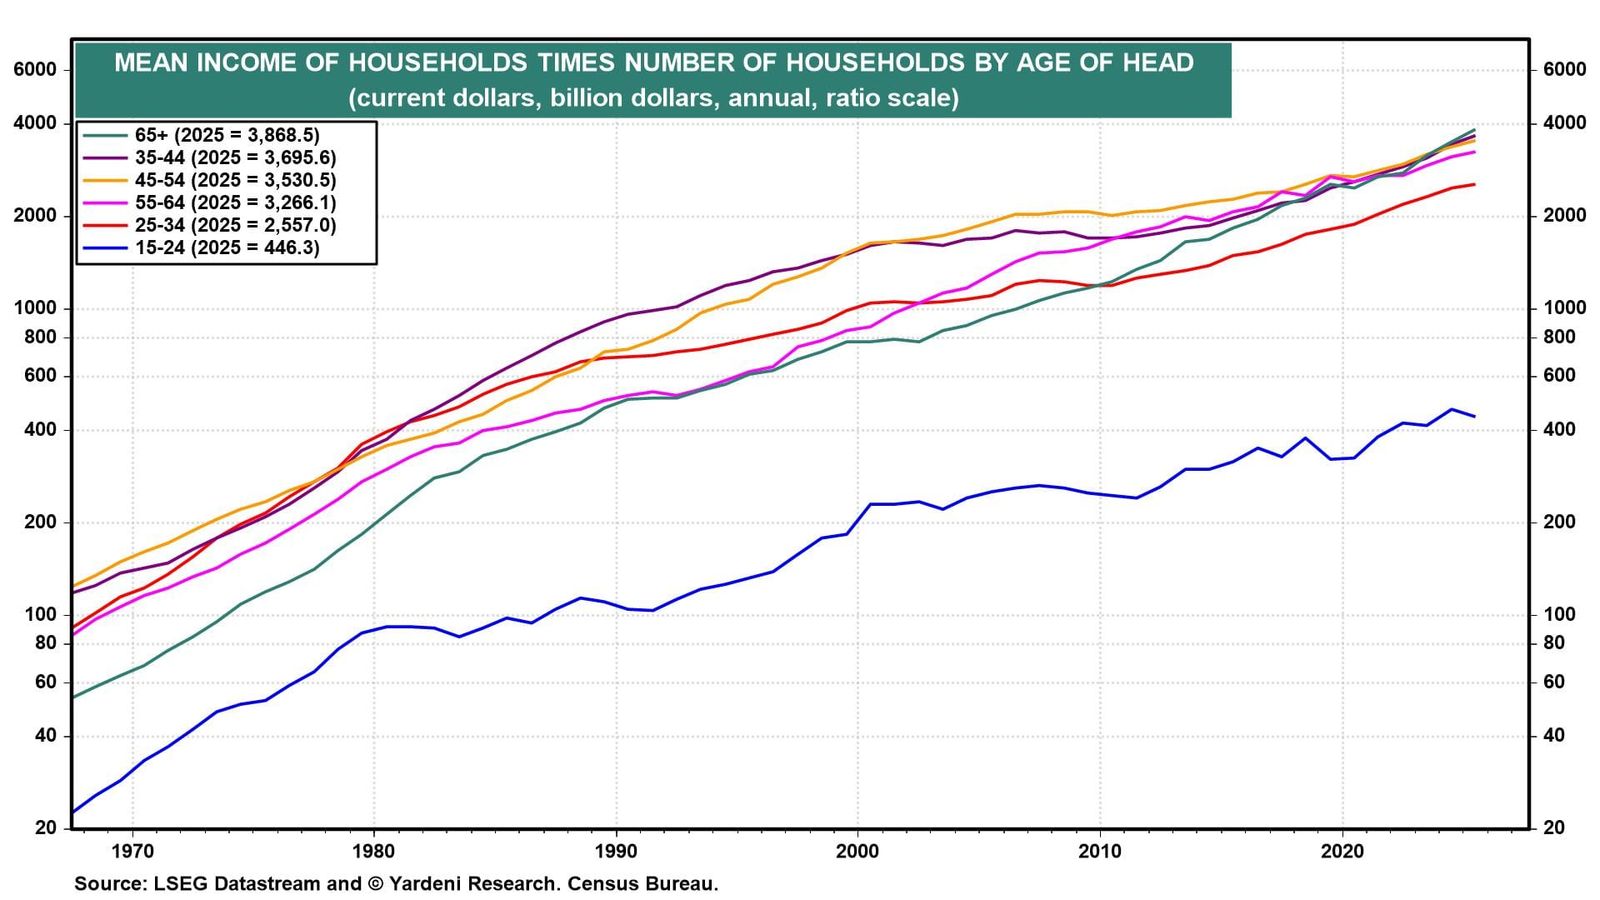
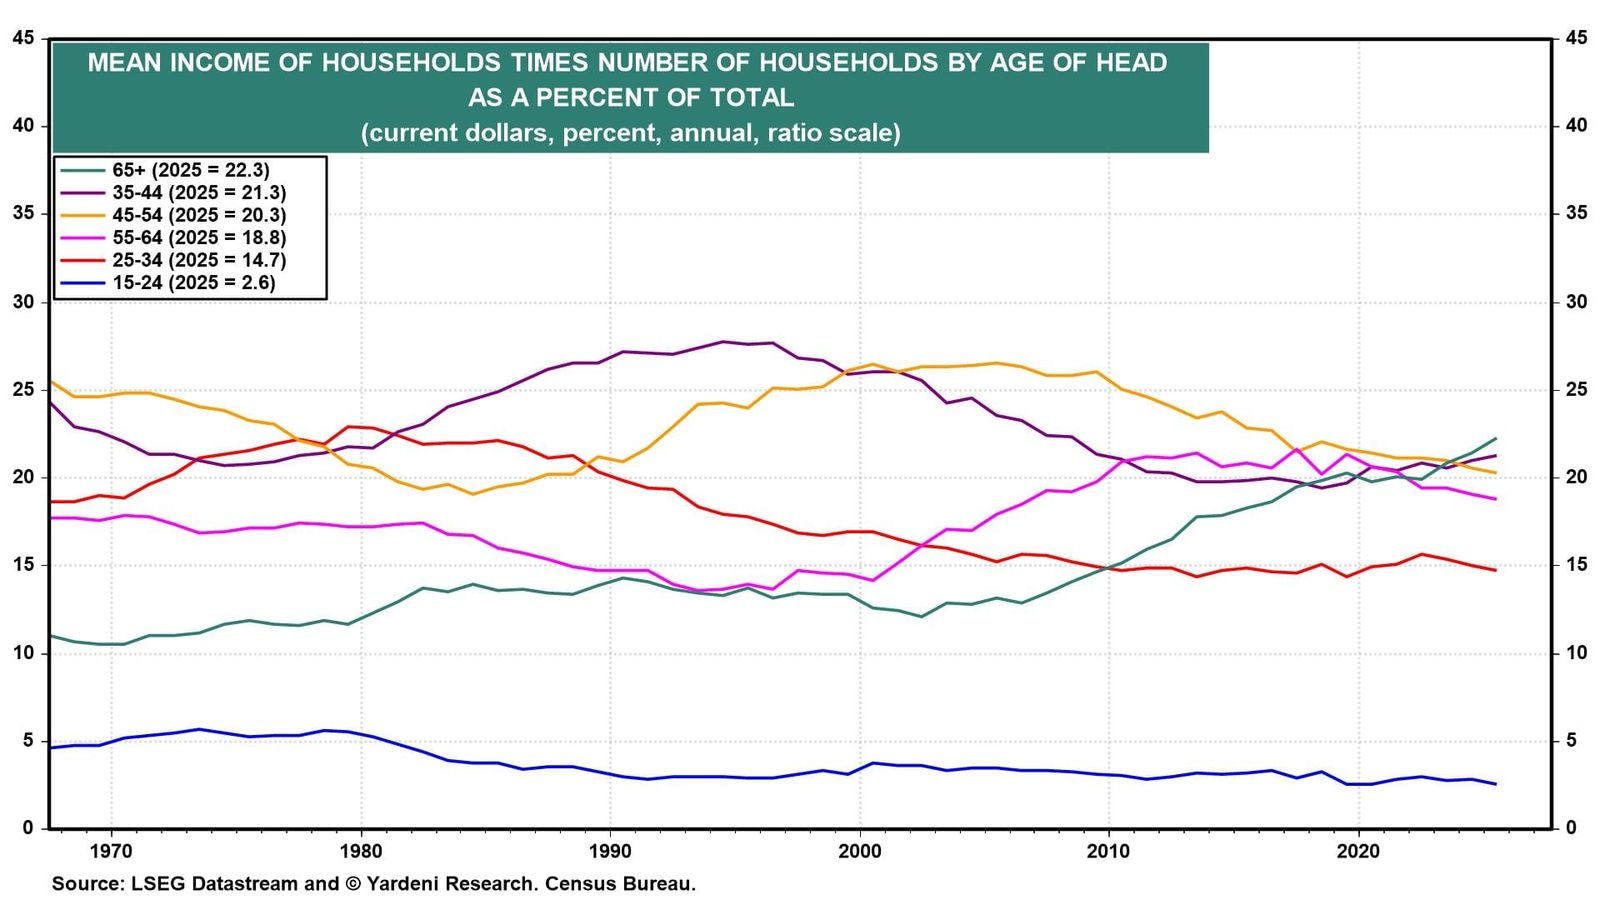
But here is where the silver tsunami starts to matter for aggregate spending power. Seniors earn less per household, but there are a lot more of them. Multiplying mean income by the number of households shows that the 65+ group collectively received $3.87 trillion in money income in 2025, more than any other age cohort (chart).
That has pushed the senior share of household income sharply higher. Households headed by someone 65 or older accounted for 22.3% of aggregate household income in 2025, roughly double their share in the late 1960s and now the largest of any age group (chart).
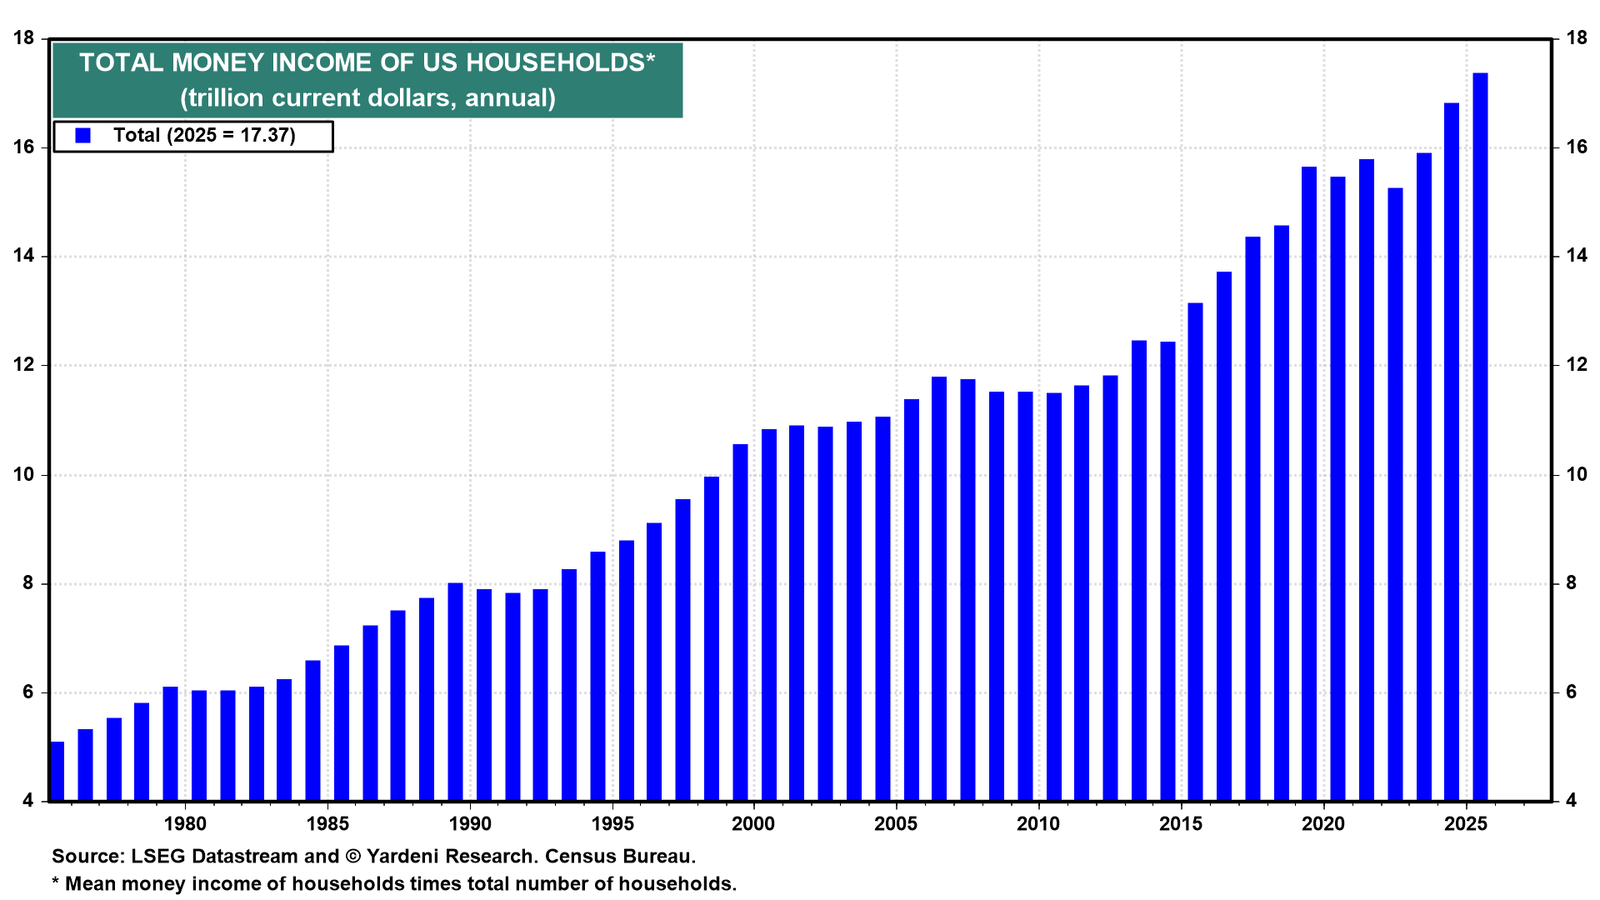
The overall household income pool has also become enormous. Total money income reached a record $17.37 trillion in 2025, up substantially over the past decade (chart). This provides a large base of purchasing power to support consumer spending.
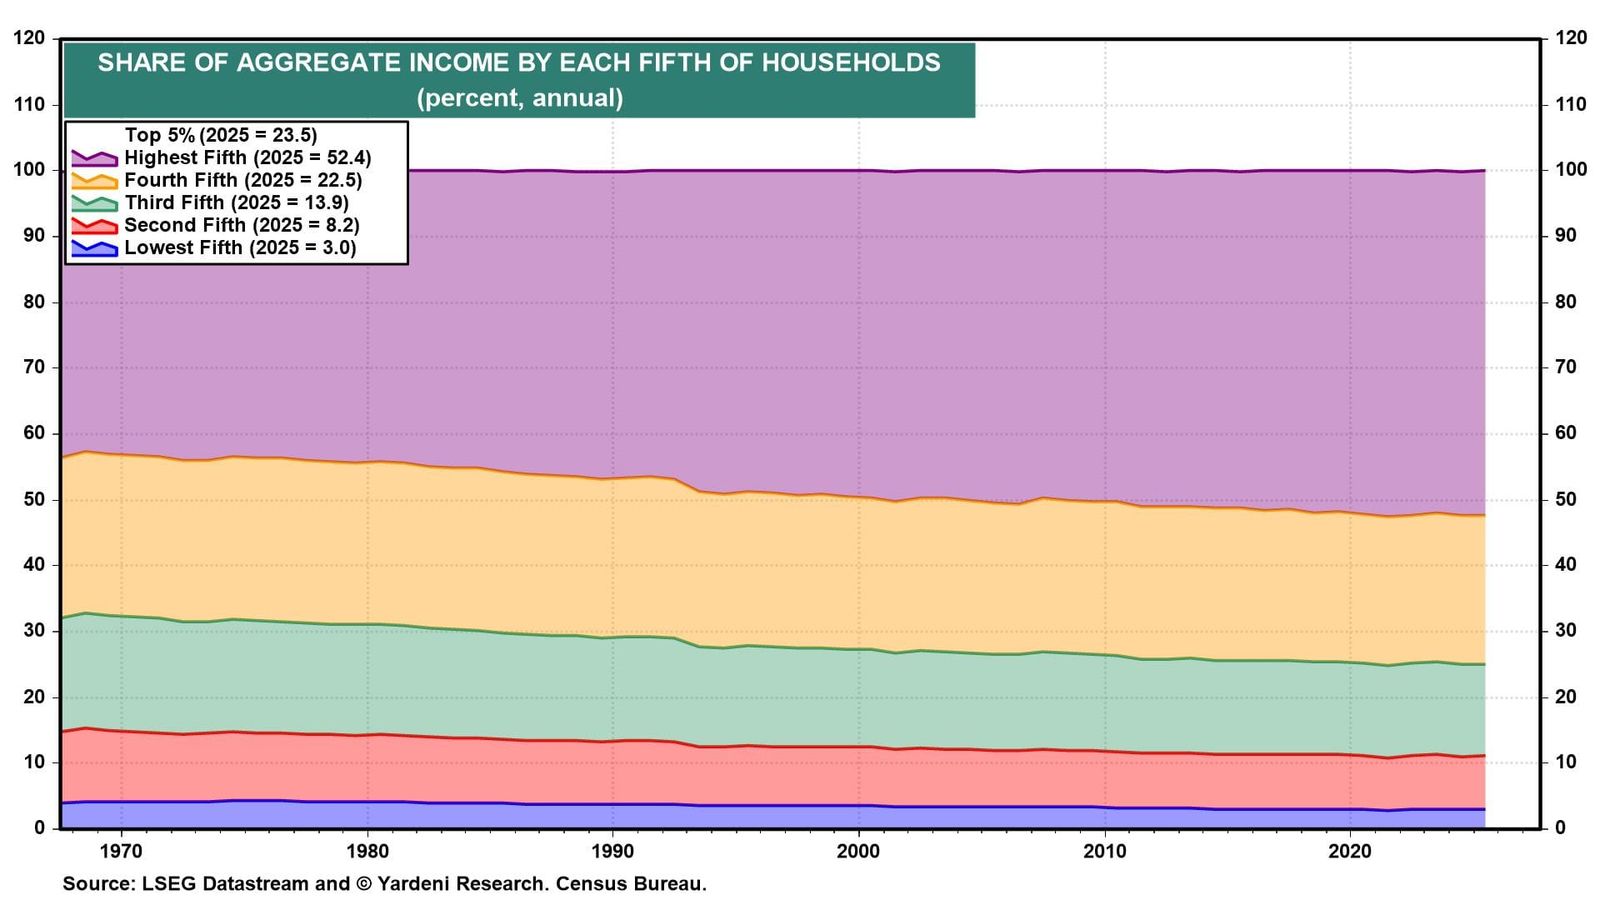
But that income is not evenly distributed. The highest-income fifth of households received 52.4% of aggregate income in 2025, while the top 5% alone received 23.5% (chart). The lowest two fifths together received just over one-tenth.
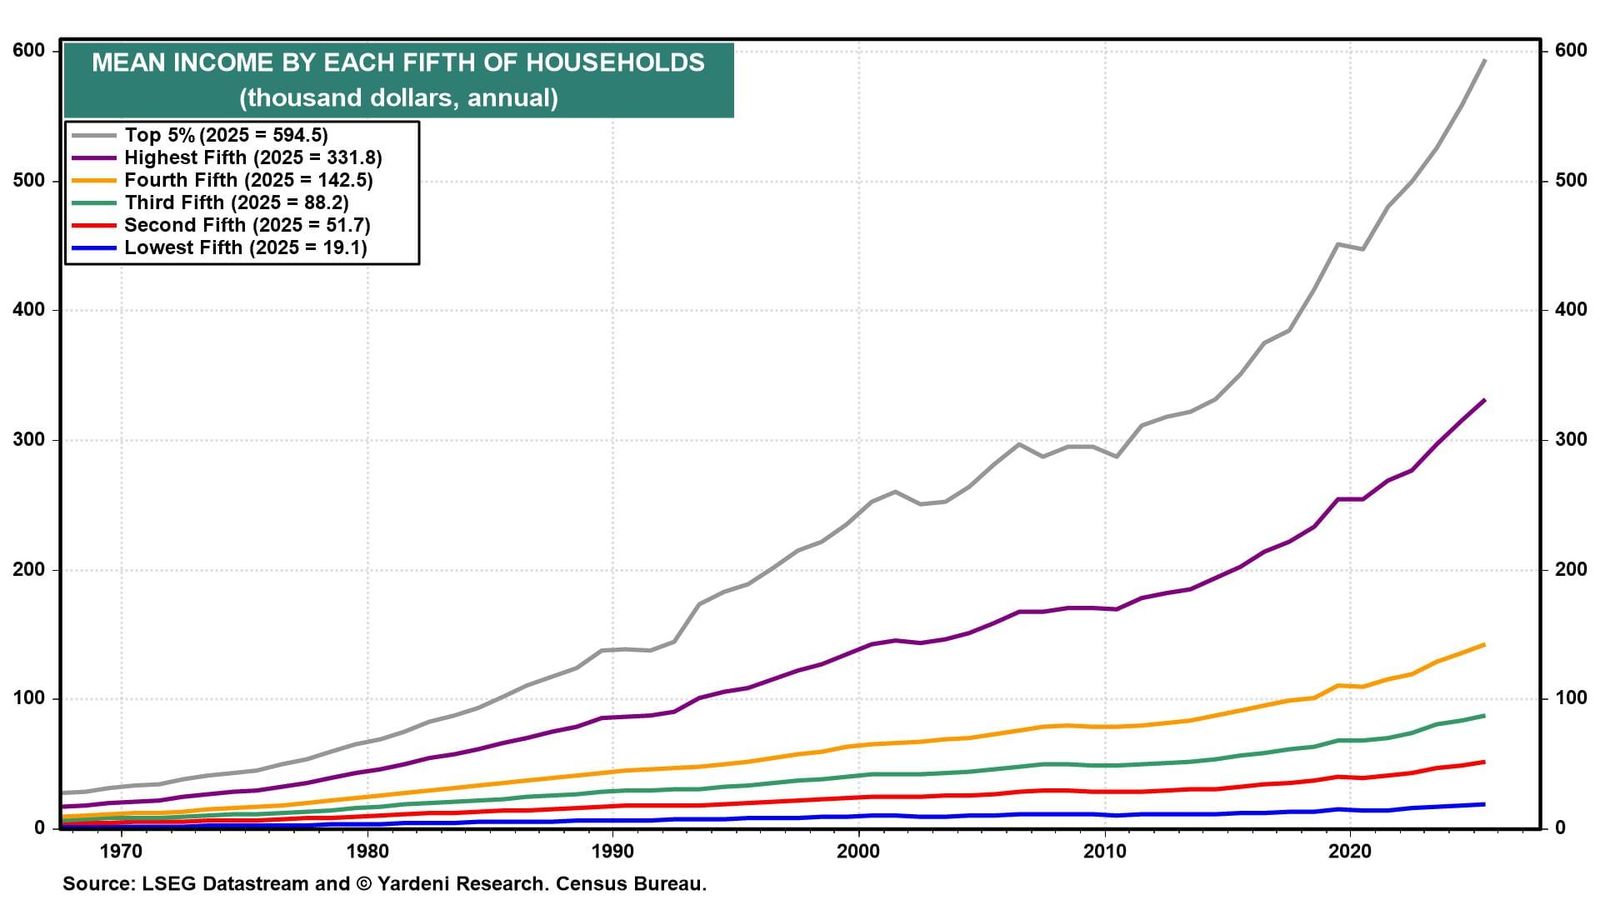
Mean income was $331,800 for the highest quintile and $594,500 for the top 5%, compared with just $19,100 for the lowest quintile (chart).
Taken together, the story is straightforward. America has more households, those households are increasingly older, and a growing share of income is attributable to older and higher-income consumers. That helps explain why aggregate spending remains resilient even as younger and lower-income households face more financial pressure. It also fits our “G-shaped” economy thesis: Consumer strength is increasingly supported by generational wealth, not current income alone.
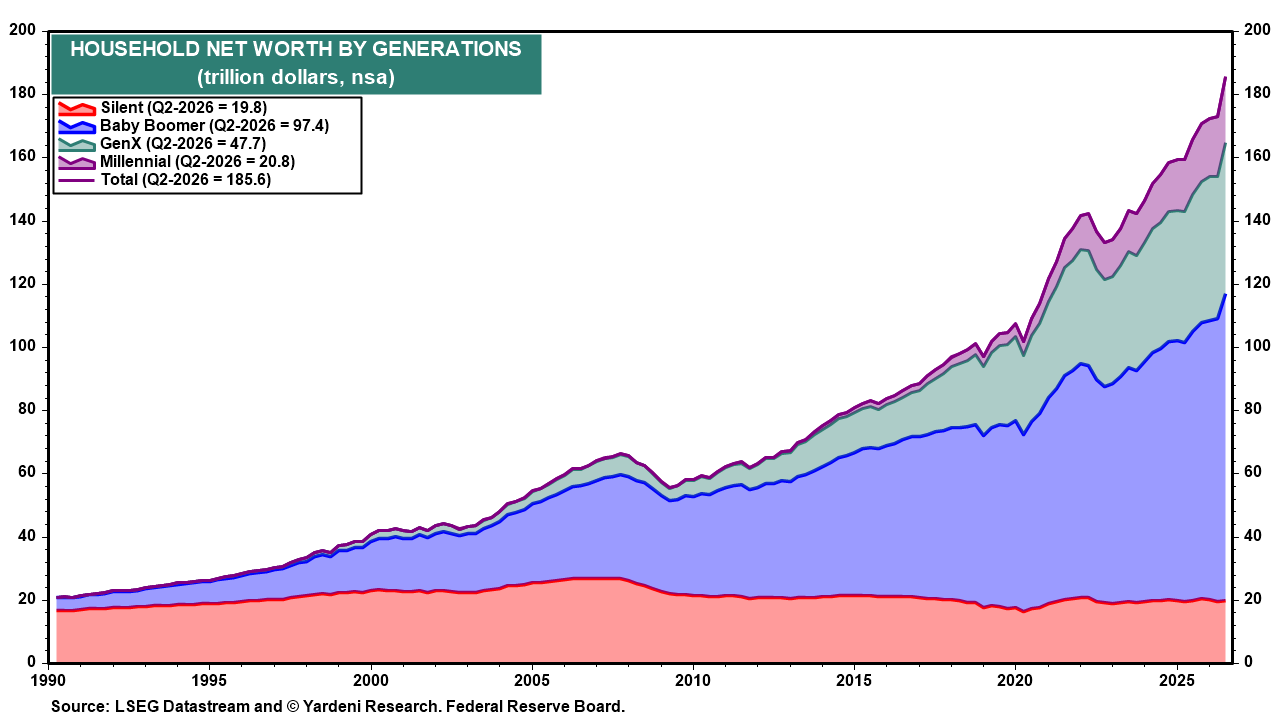
Baby Boomers have accumulated enormous wealth over their working lives and can continue to spend out of those balance sheets in retirement. Indeed, household net worth reached $185.6 trillion in Q2-2026, with Baby Boomers alone holding $97.4 trillion (chart). That wealth is a key reason the silver tsunami remains a key driver of consumer spending.
II. The Golden Economy
The latest economic data suggest that the US economy remains on a solid growth path. Consumer spending remains strong, hiring is picking up, manufacturing activity is improving, and expected Q3 GDP growth is running at a robust pace. Let's take a closer look:
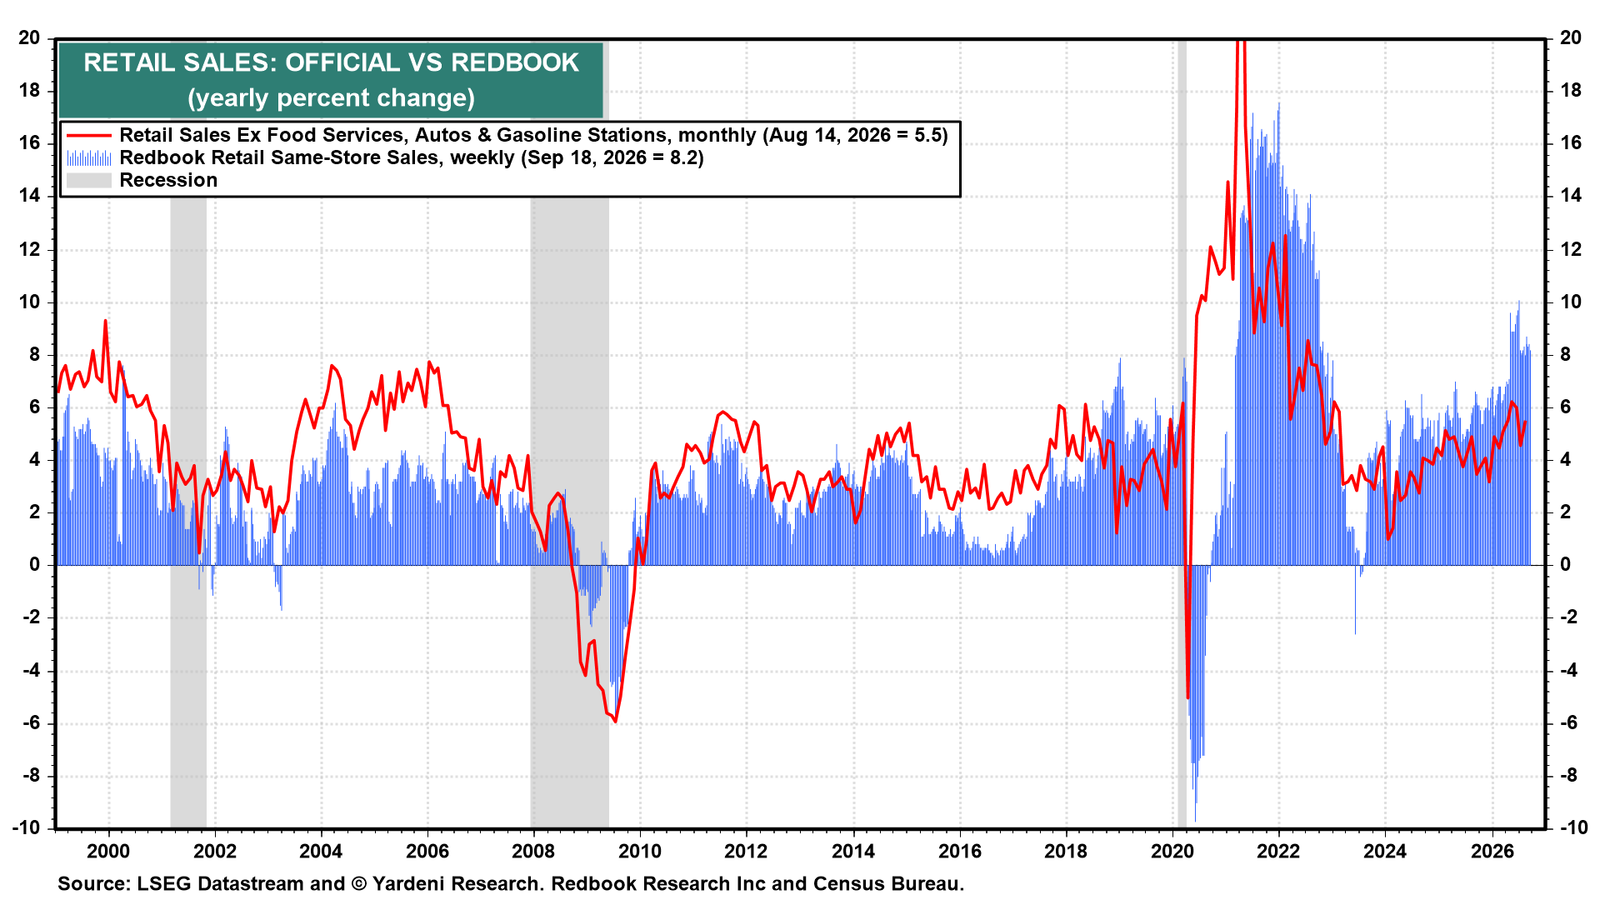
(1) Consumer spending. Redbook same-store retail sales rose 8.2% y/y during the week ended September 18, remaining well above the pace seen through much of the past several years (chart).
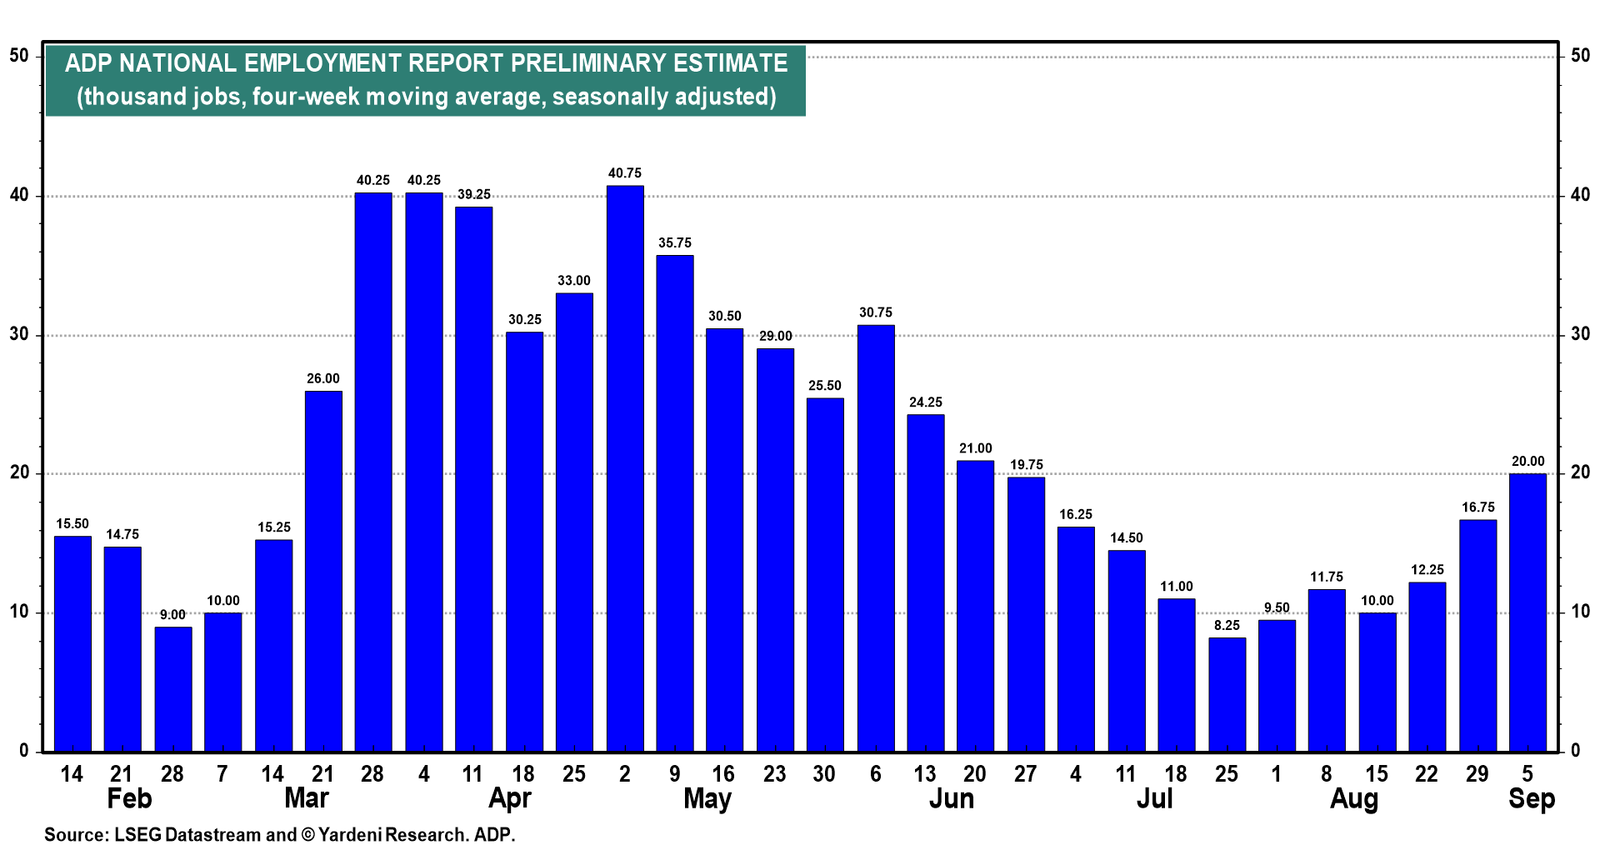
(2) Hiring activity. The latest ADP weekly data suggest that labor demand remains strong. Private employers added an average of 20,000 jobs per week during the four weeks through September 5, the most since June 20 and the third consecutive weekly increase (chart).
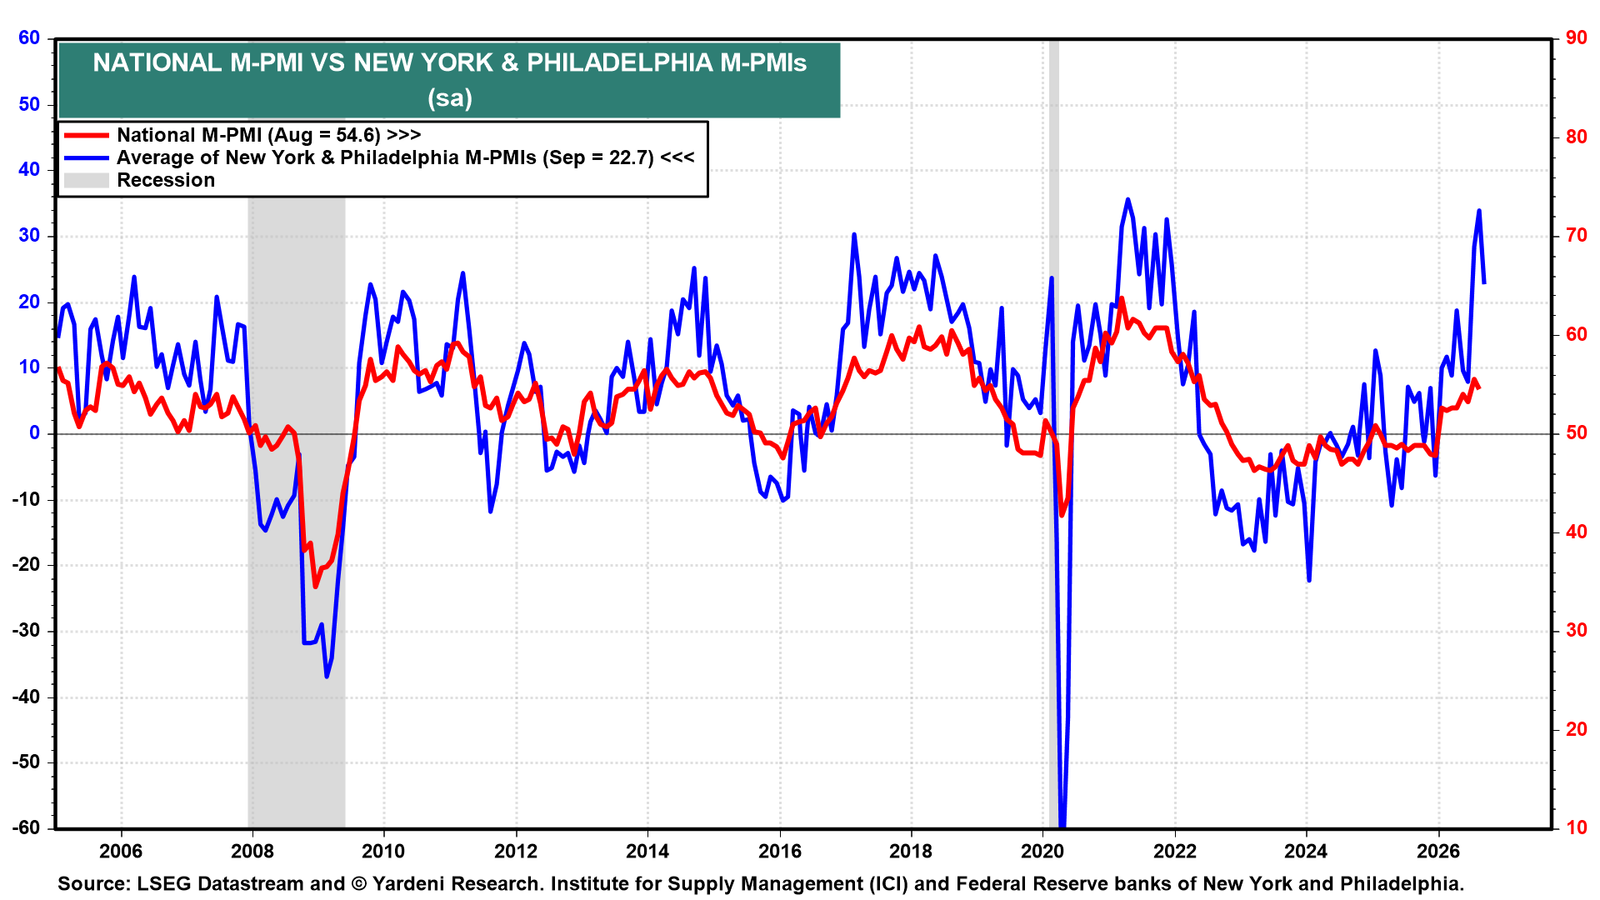
(3) Manufacturing activity. The average of the New York and Philadelphia Fed manufacturing indexes remained elevated at 22.7 in September, suggesting that manufacturing activity continued to expand during the month (chart).
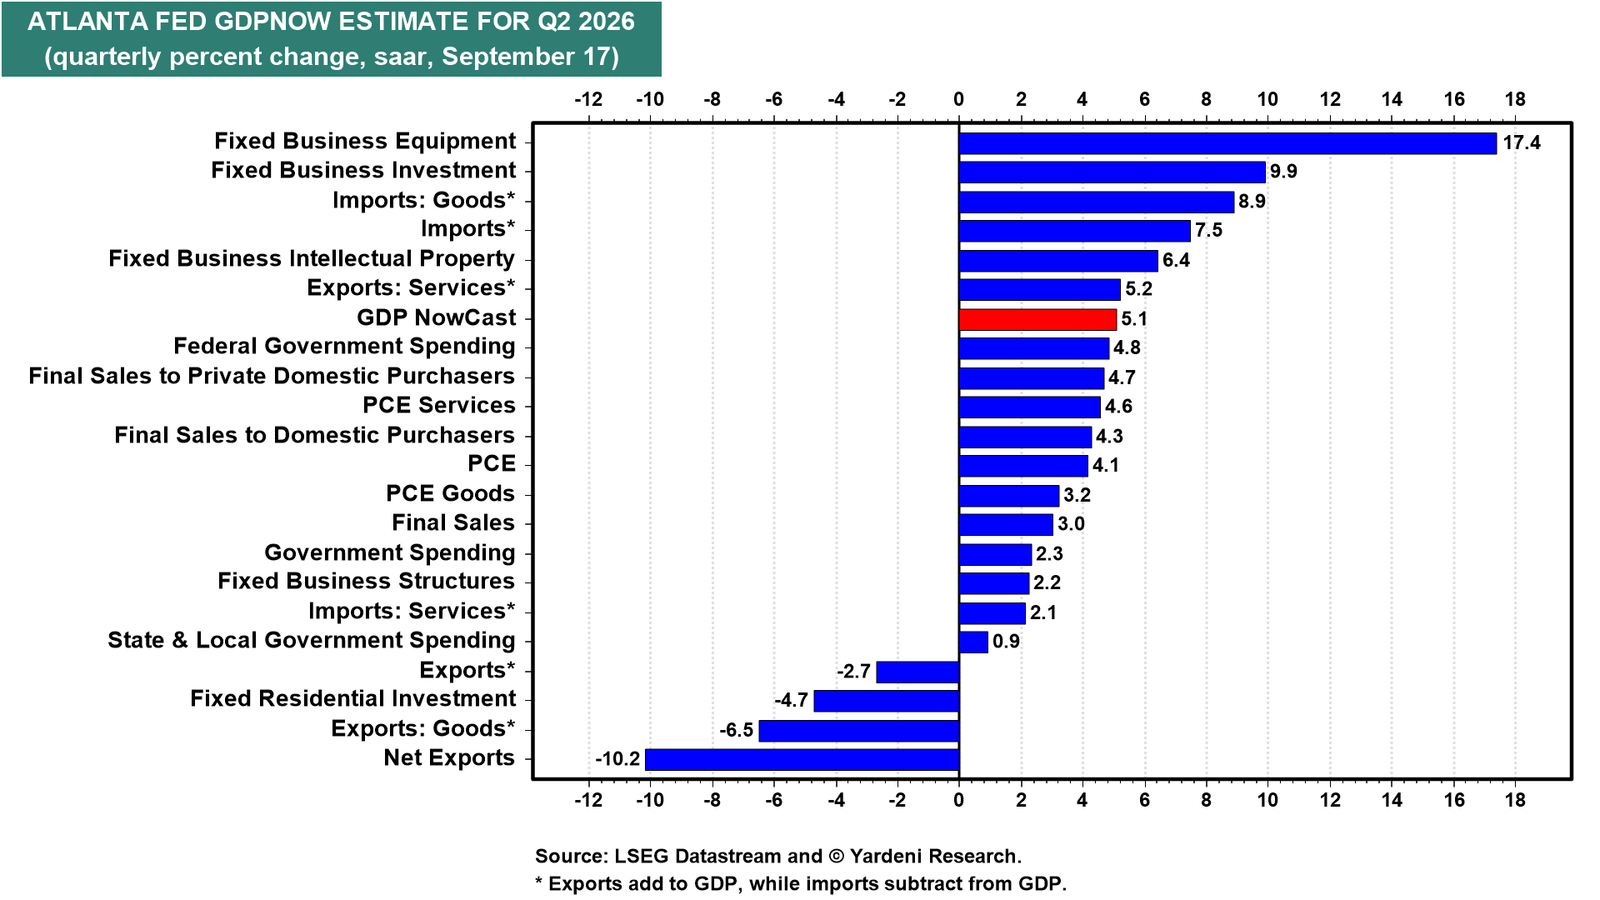
(4) GDP. The Atlanta Fed’s GDPNow model currently estimates 5.1% real GDP growth (saas) in Q3 (chart). Real final sales to private domestic purchasers are expected to rise 4.7%, the strongest since Q2-2021. Consumer spending is expected to increase 4.1%, the strongest since Q1-2023, while business investment is on track for its strongest three-quarter stretch since 2021.