The Q2-2026 earnings reporting season begins next week. The major banks will report at the end of next week. We expect they will beat expectations by reducing their bad-loan provisions. In addition, loan demand has been growing faster in recent weeks, and the IPO calendar has been busy.
The big risk up ahead is that technology companies, especially the hyperscalers, won't beat analysts' overly optimistic earnings growth estimates for the quarter. That could cause a correction among technology stocks. The overall stock market might dodge a correction if investors rotate into sectors that have lagged and report better-than-expected earnings. We are in the rotation camp for the stock market's outlook up ahead.
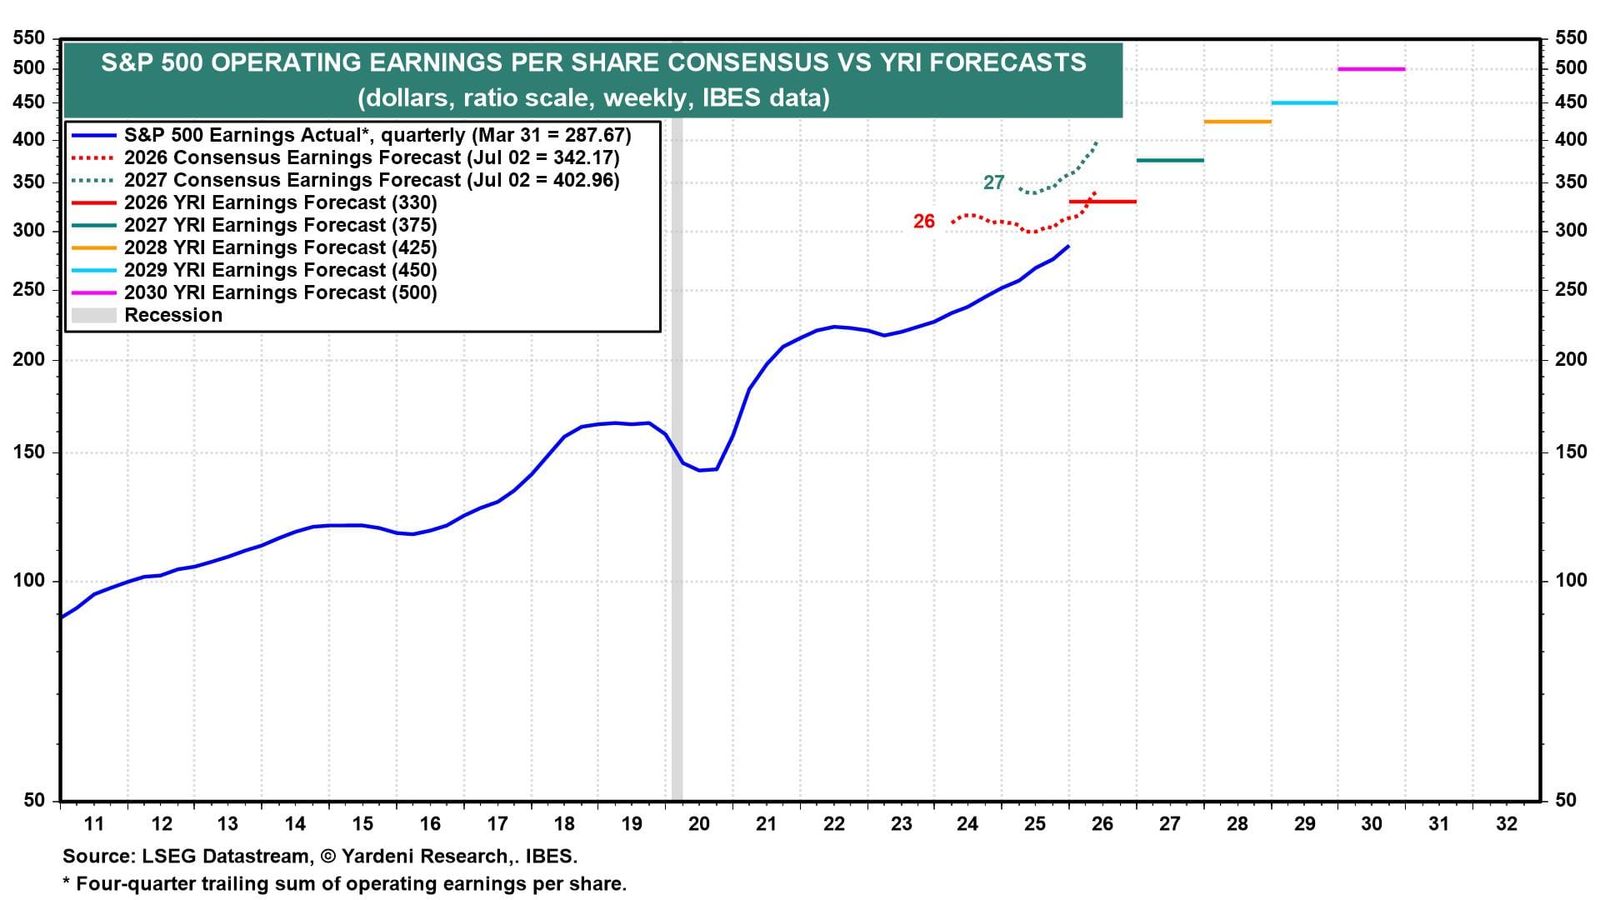
(1) Are analysts too bullish? The problem is that industry analysts may be projecting a hard-to-beat earnings outlook in 2026 and 2027. They are projecting that S&P 500 earnings per share will increase 18.9% this year to $342.17 and 17.8% next year to $402.96 (chart). Both numbers exceed our forecasts of $330 and $375. We've been bullish on earnings, but perhaps not bullish enough. Or else the analysts are entering the realm of irrational exuberance.
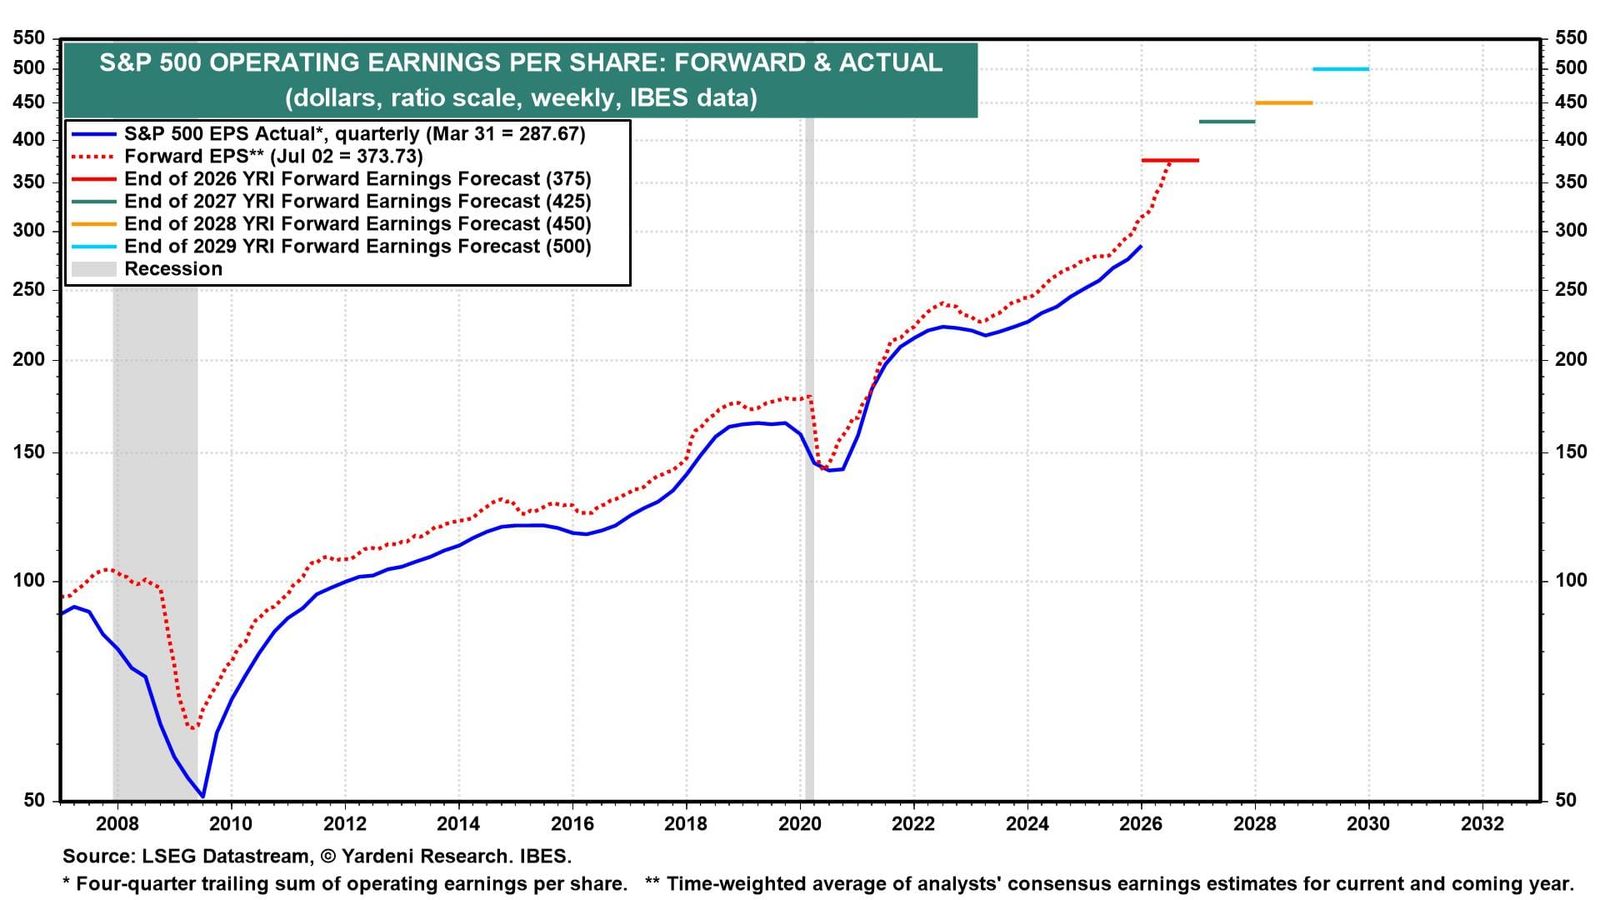
The stock market discounts analysts' earnings estimates over the next 52 weeks, which can be calculated using forward earnings, i.e., the time-weighted average of their weekly estimates for the current year and the coming year (chart). This series rose to a record $373.73 last week, already matching our projection for the end of this year. To forecast the stock market outlook, we assume that analysts' forward earnings estimates at the end of each remaining year of the Roaring 2020s will match our estimate for the following year. So for example, our estimate for 2030 is $500, which we assume will be the analysts' forward earnings at the end of 2029.
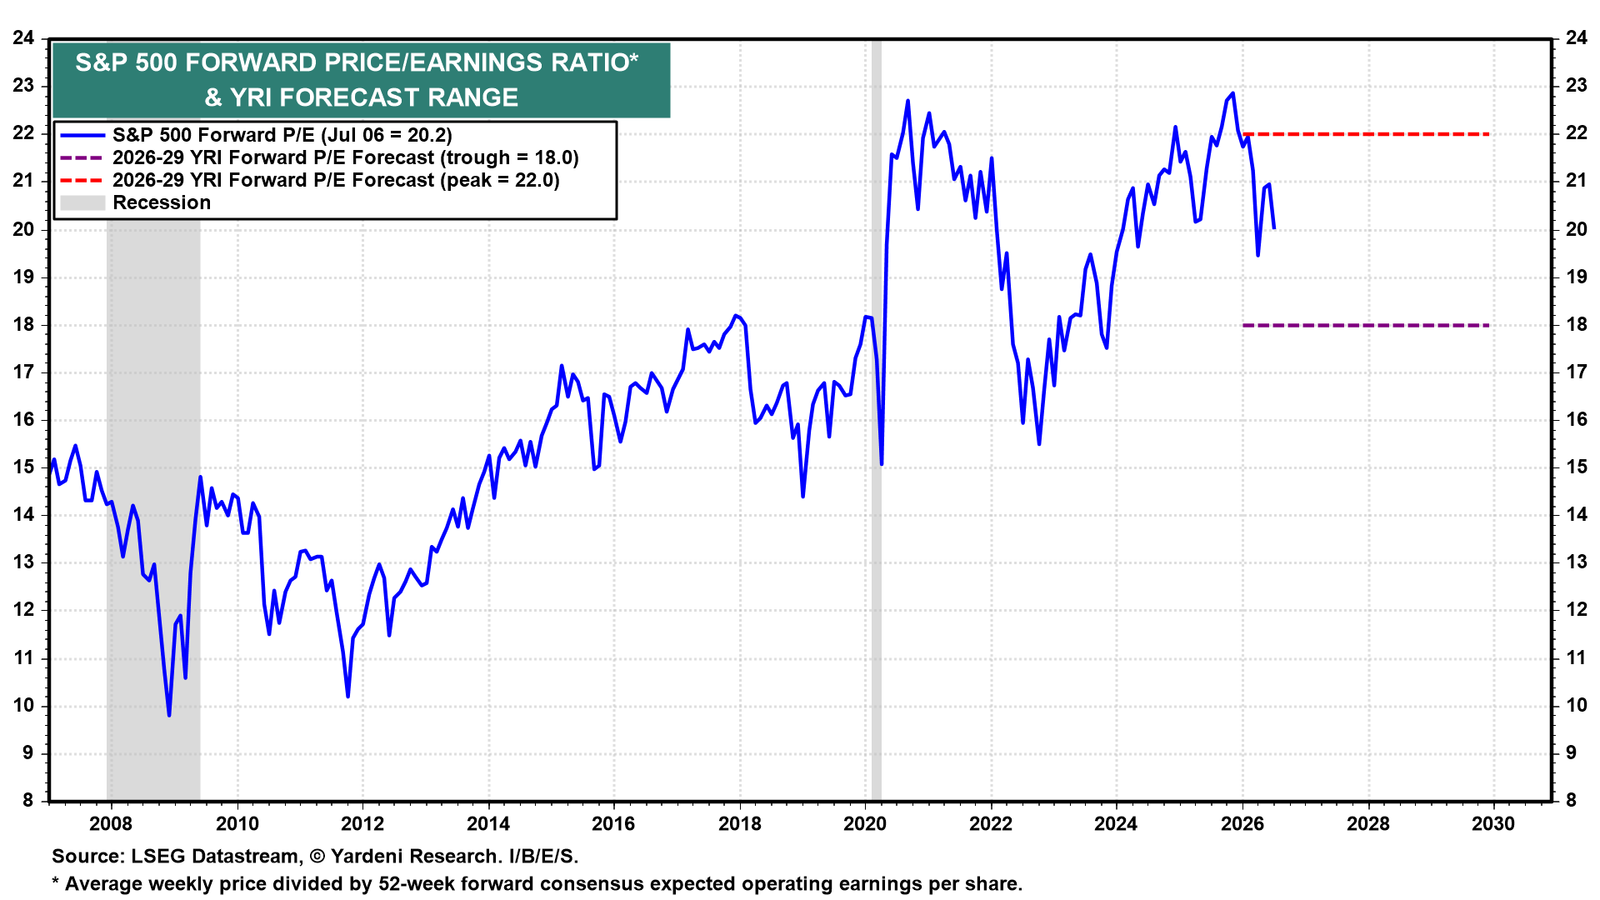
We assume the forward P/E of the S&P 500 remains in the range of 18.0 to 22.0 through the end of the decade (chart). That's a lofty range, but it's consistent with our view that the economy won't experience a recession over the rest of the decade.
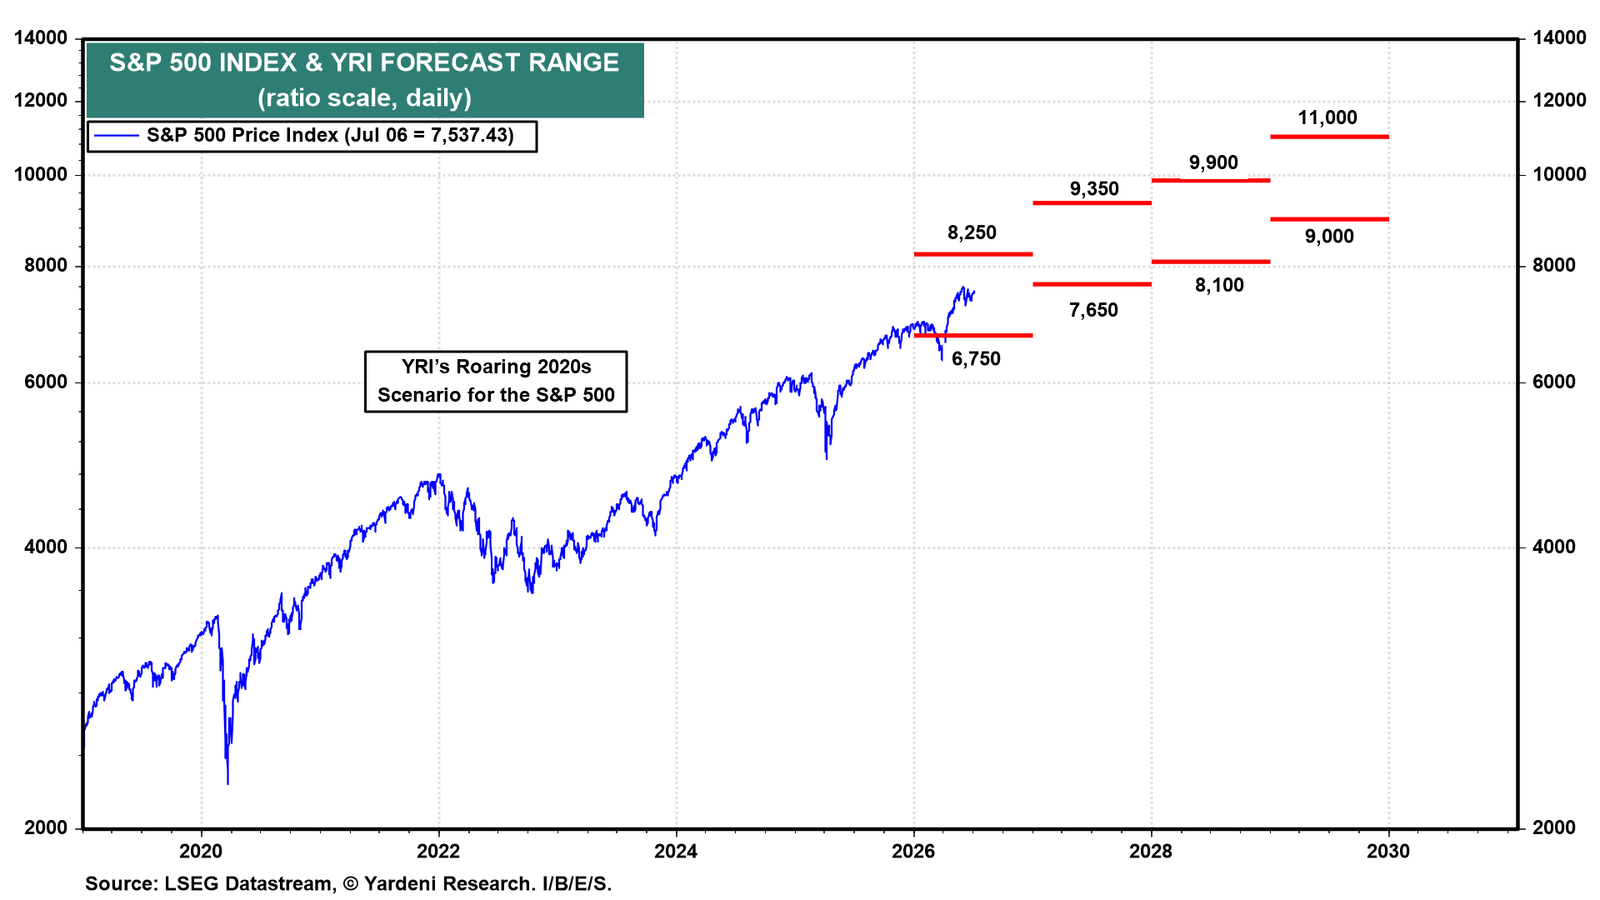
Multiplying our year-end forward earnings estimates by our forward P/E range produces a year-end 2026 range of 6,750-8,250 for the S&P 500 (chart). Our point estimate is the top of that range. Similarly, we reach 9,000-11,000 for the S&P 500 by the end of the decade, with a mid-point estimate of 10,000.
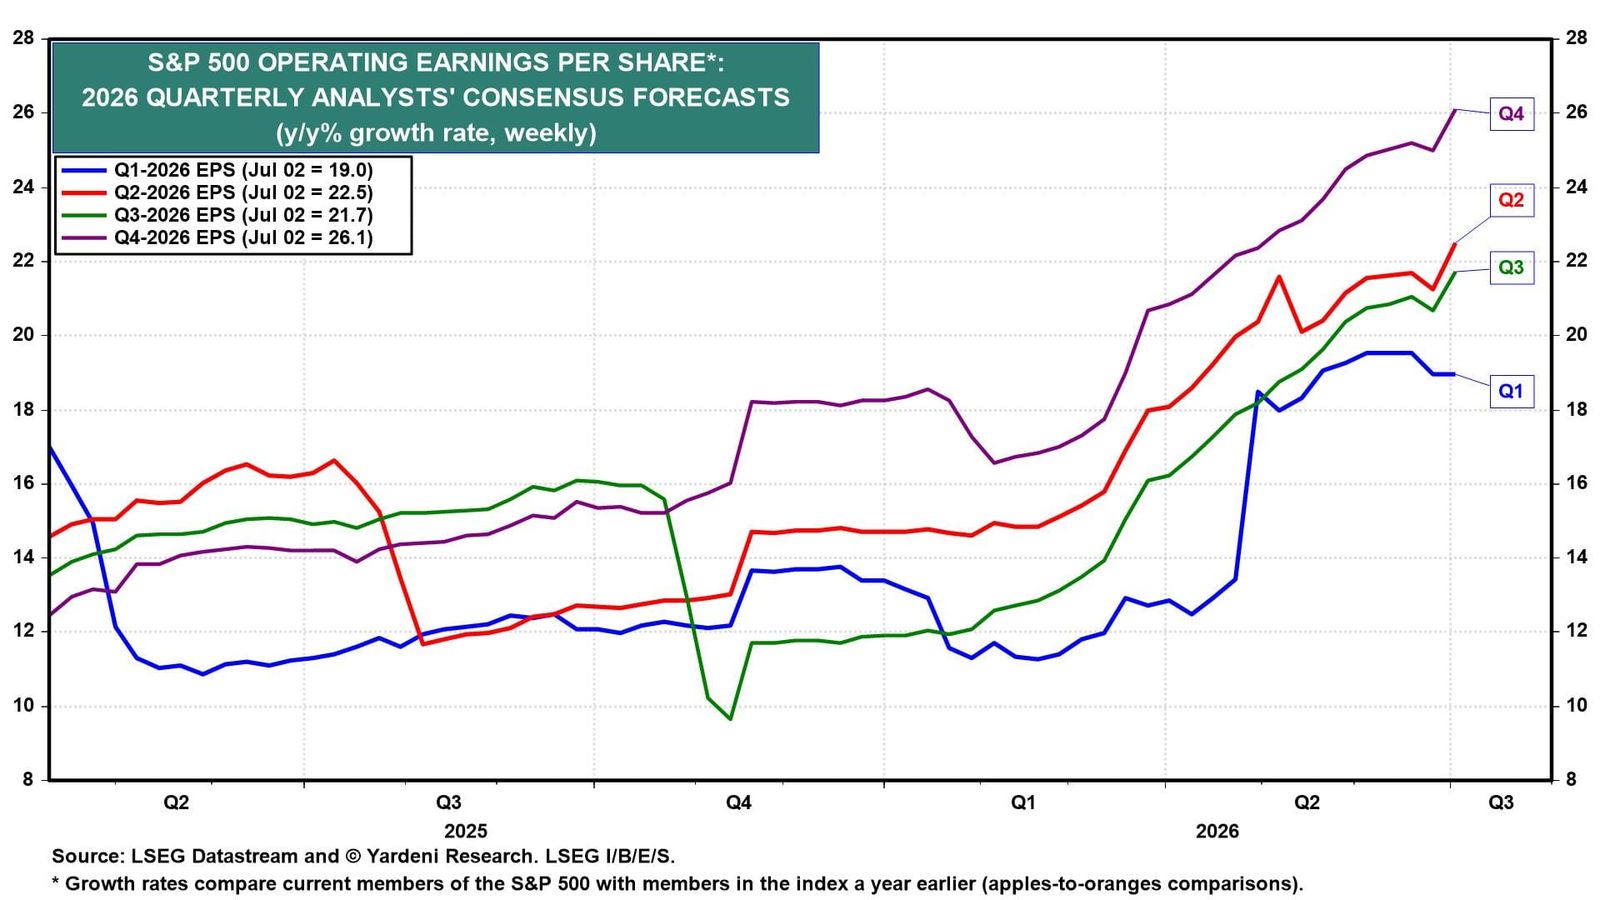
(2) Are expectations too high for the earnings reporting season? For the here and now, industry analysts are estimating a 22.5% y/y increase in S&P 500 earnings during Q2-2026 (chart). The risk is that Q1's exceptionally strong results led them to raise their estimates for the remaining three quarters by too much.
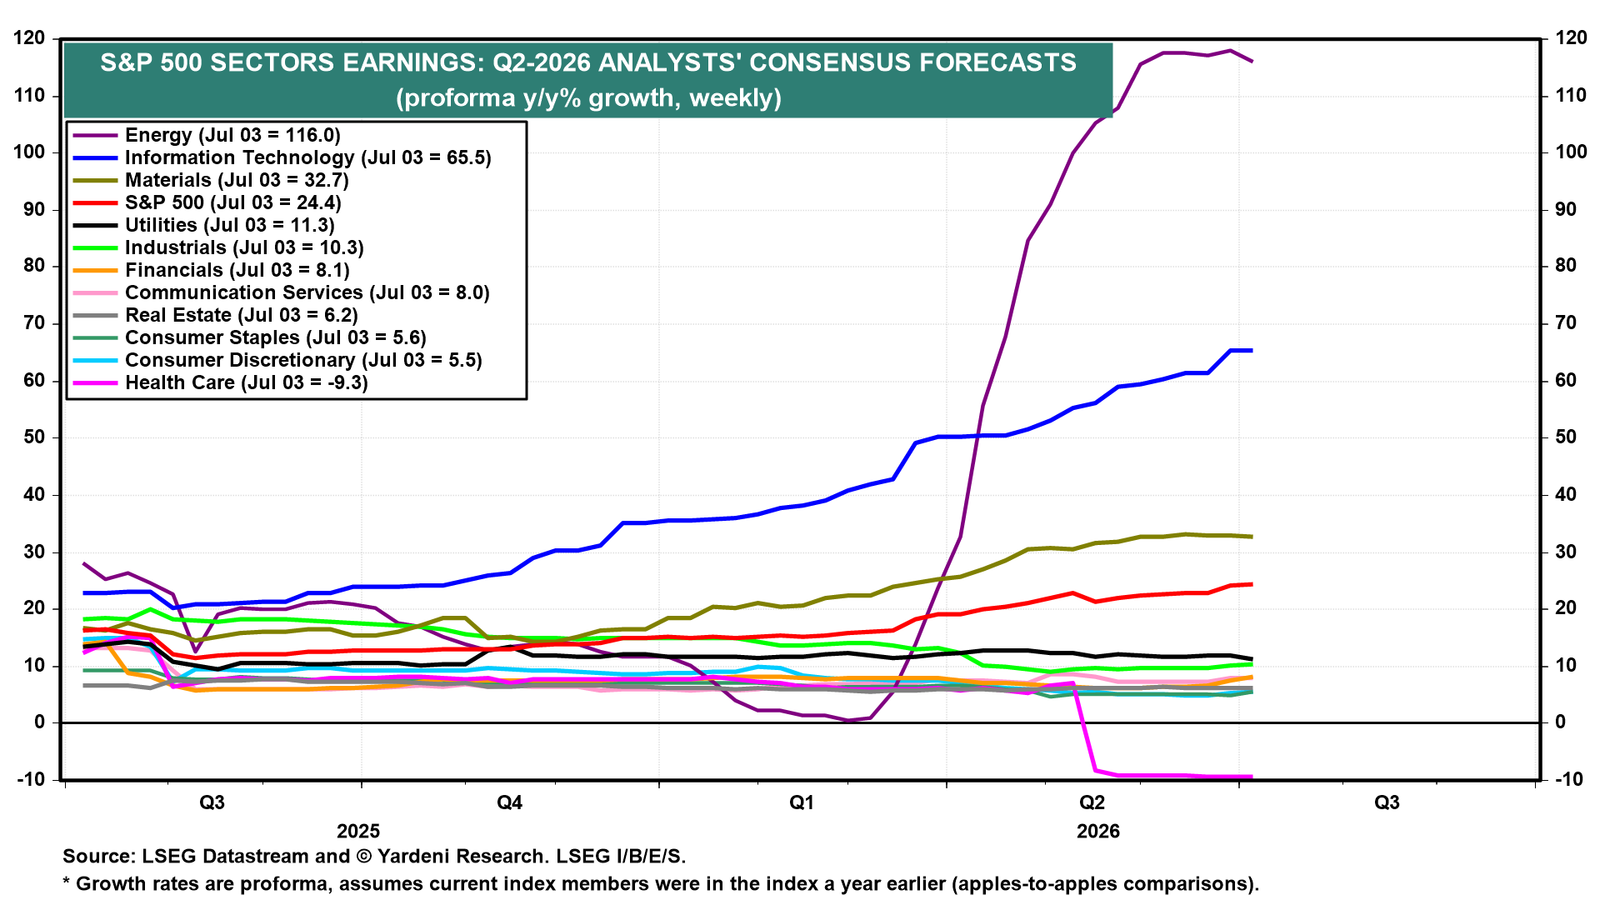
The latest Q2-2026 proforma y/y growth rates for the 11 sectors of the S&P 500 show huge gains for Energy (116.0%), Information Technology (65.5%), and Materials (32.7%). In our opinion, the risk is that some of the best-performing tech stocks get hit if they don't beat already heady expectations.
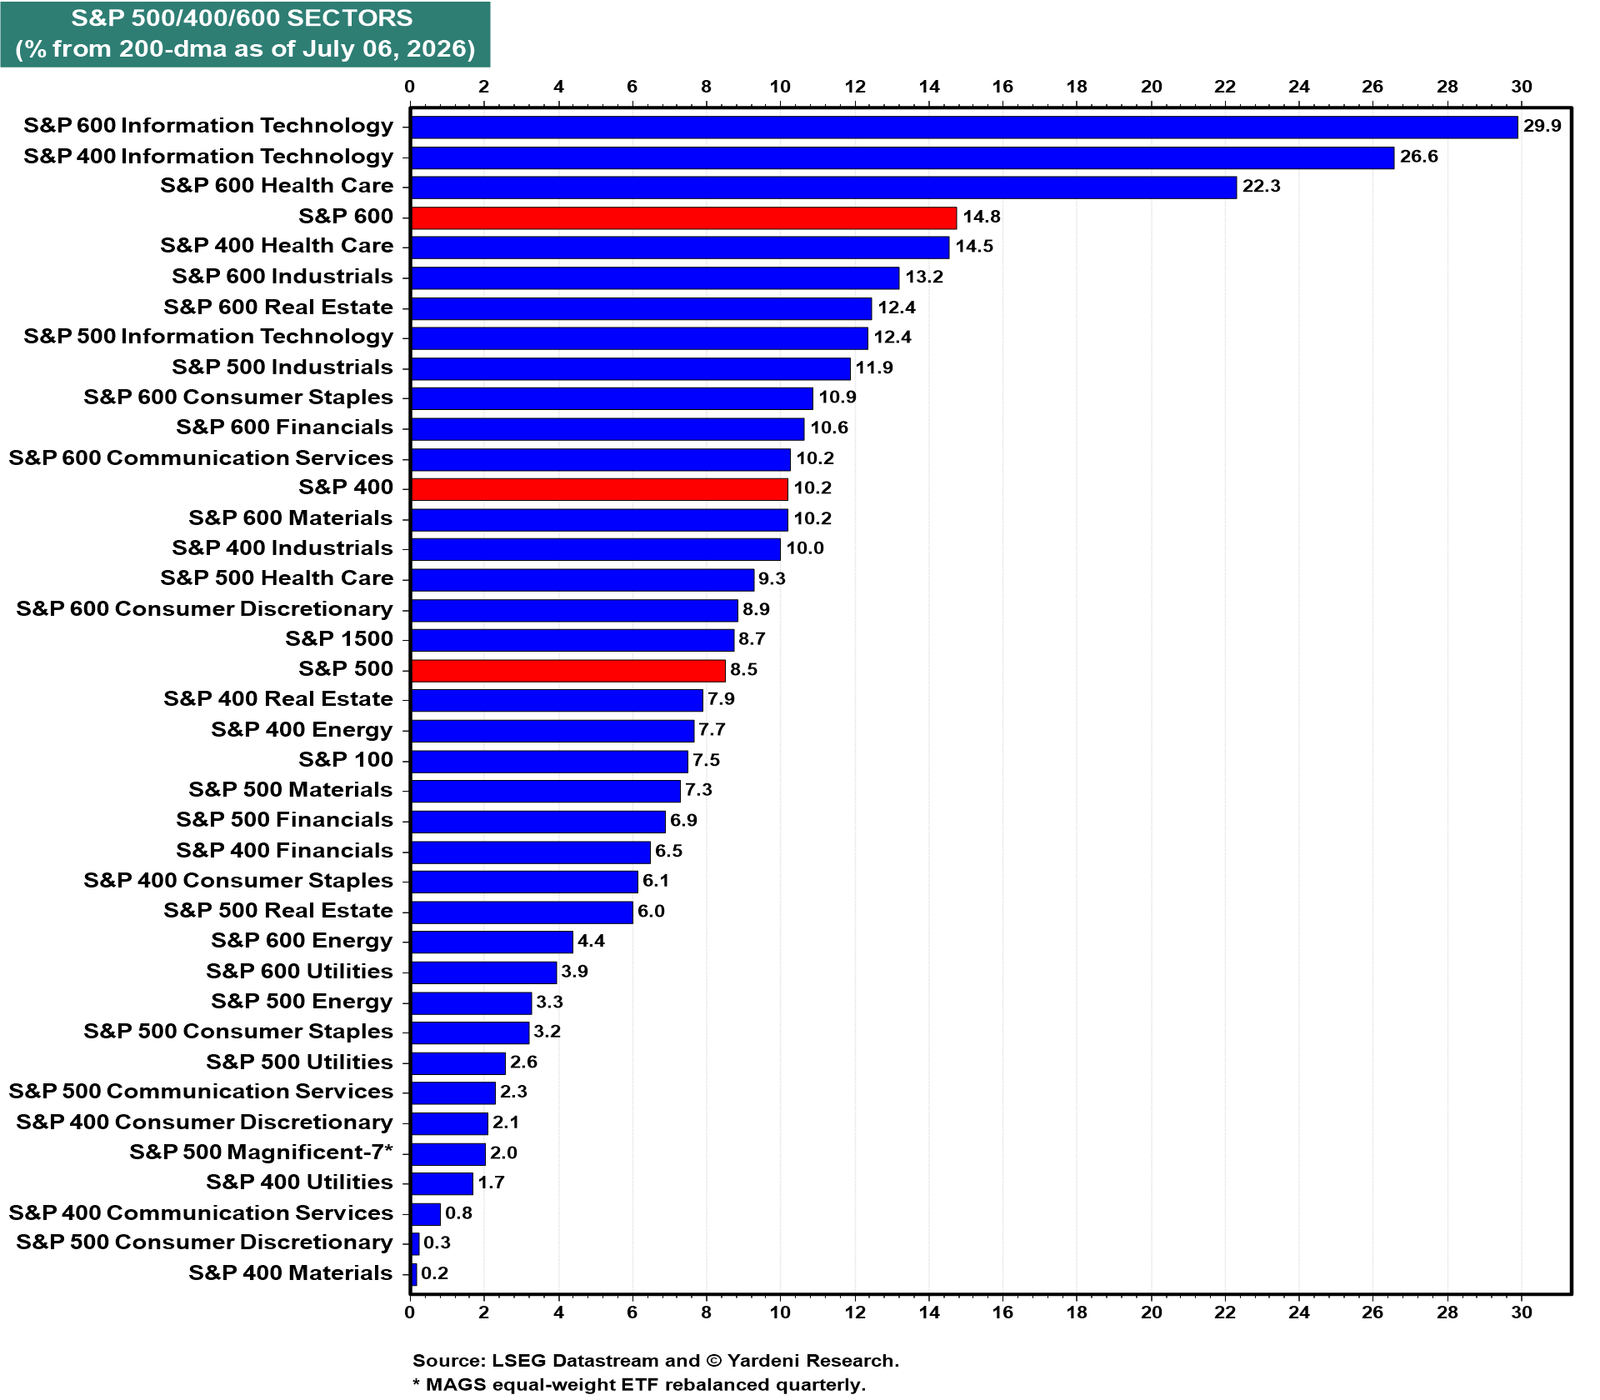
(3) Which sectors are most extended relative to their 200-day moving averages? The most overbought sectors in the stock market are the S&P 400 and S&P 600, with Information Technology, Health Care, and Industrials the most overbought as a percentage of their 200-day moving averages (chart). In the S&P 500, Information Technology and Industrials are the most extended.
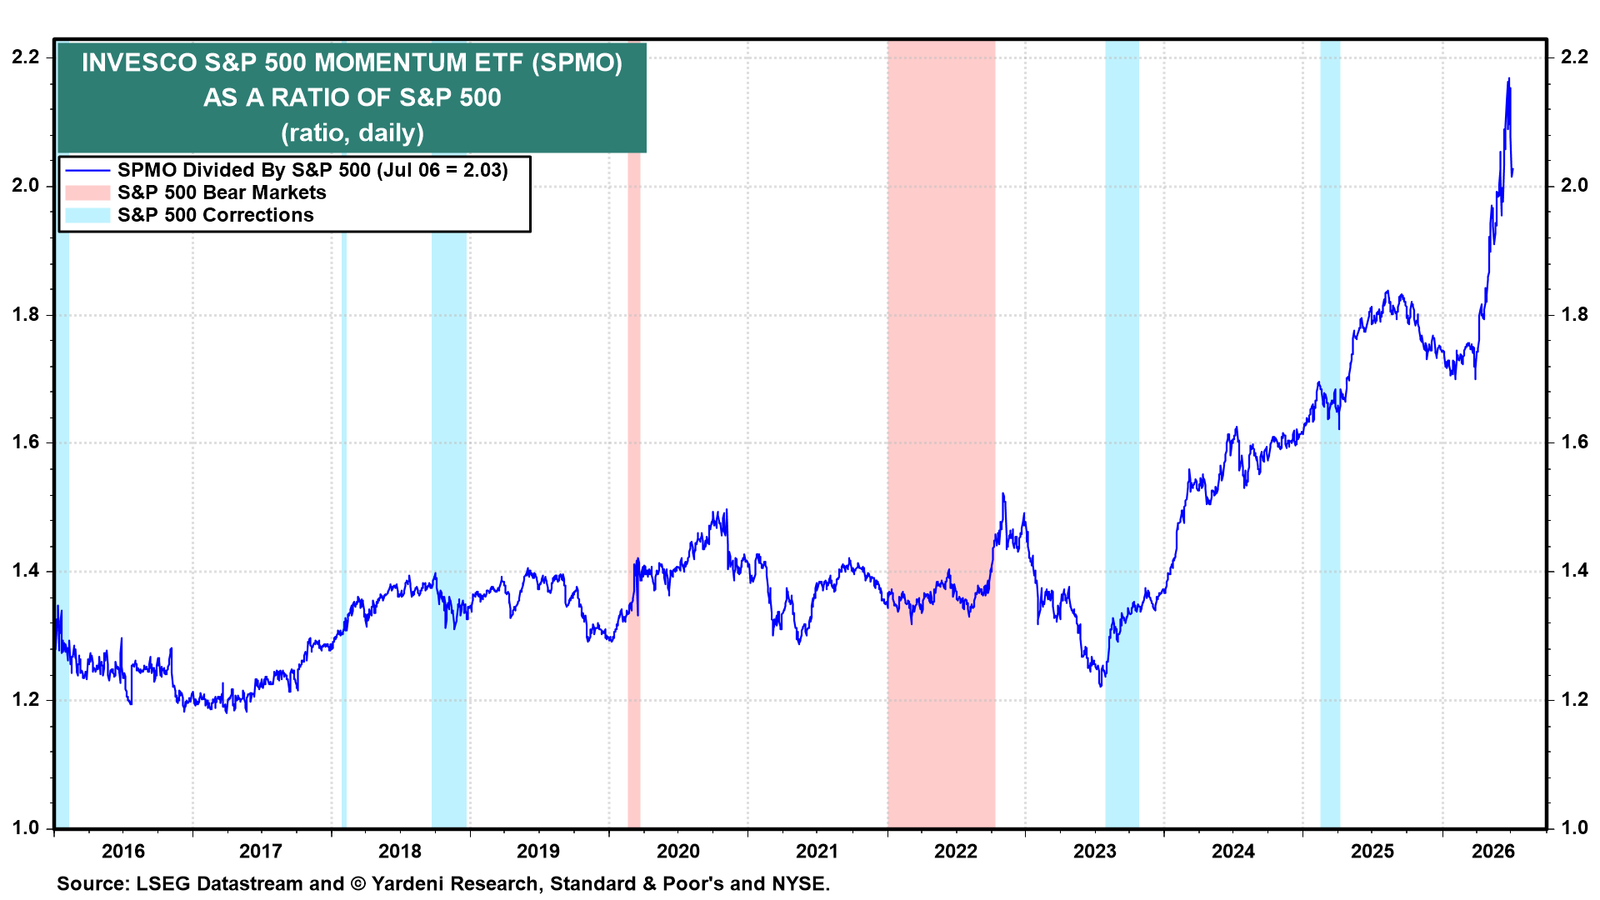
(4) Rotation more likely than correction. The stock market may be starting to rotate in anticipation of the risks of the upcoming earnings season discussed above. The S&P 500 momentum trade may be peaking (chart). It has been driven by FEMO (fabulous earnings momentum).
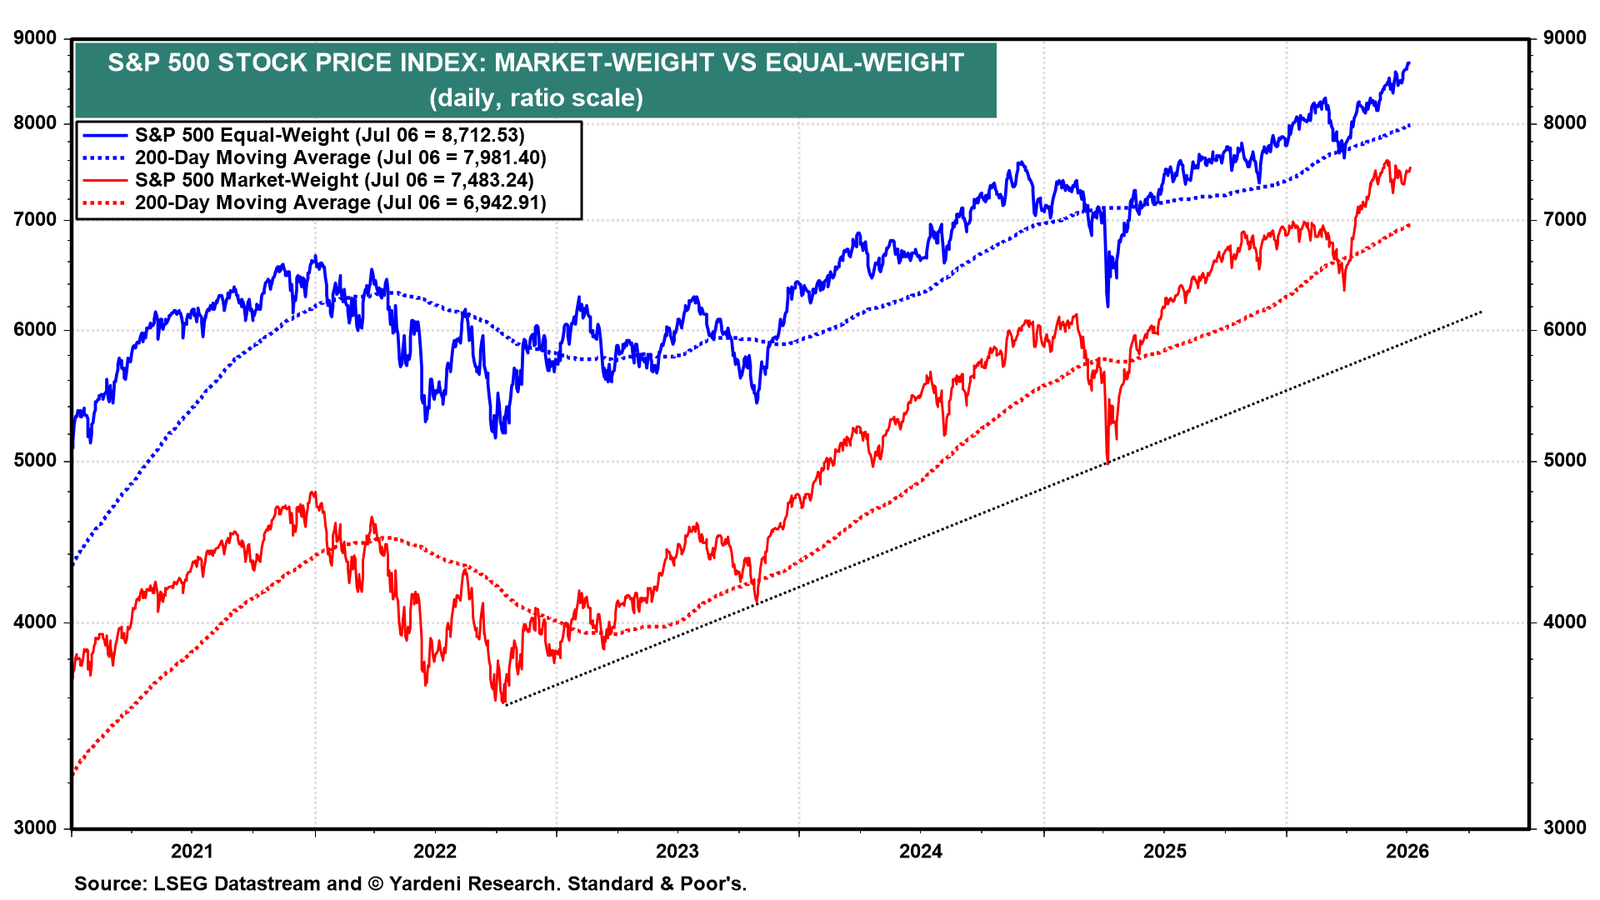
While the S&P 500 market-weight stock price index has stalled in recent weeks, the S&P 500 equal-weight index is making new record highs (chart).
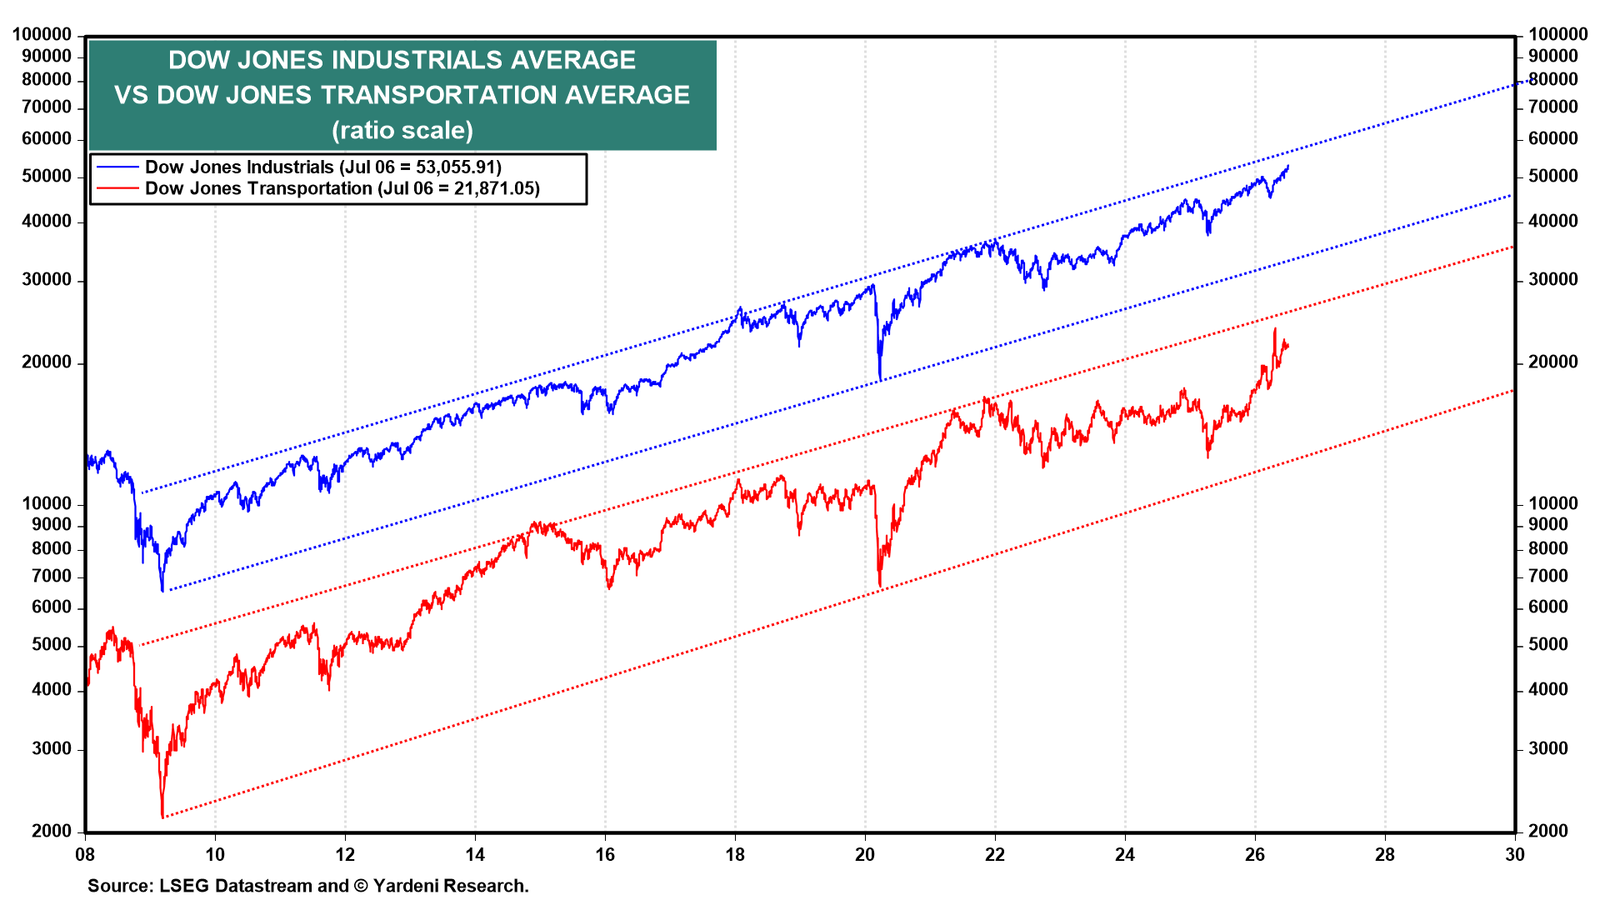
Dow Theory remains bullish as the recent record highs in the DJIA have been confirmed by similar advances in the DJTA (chart).
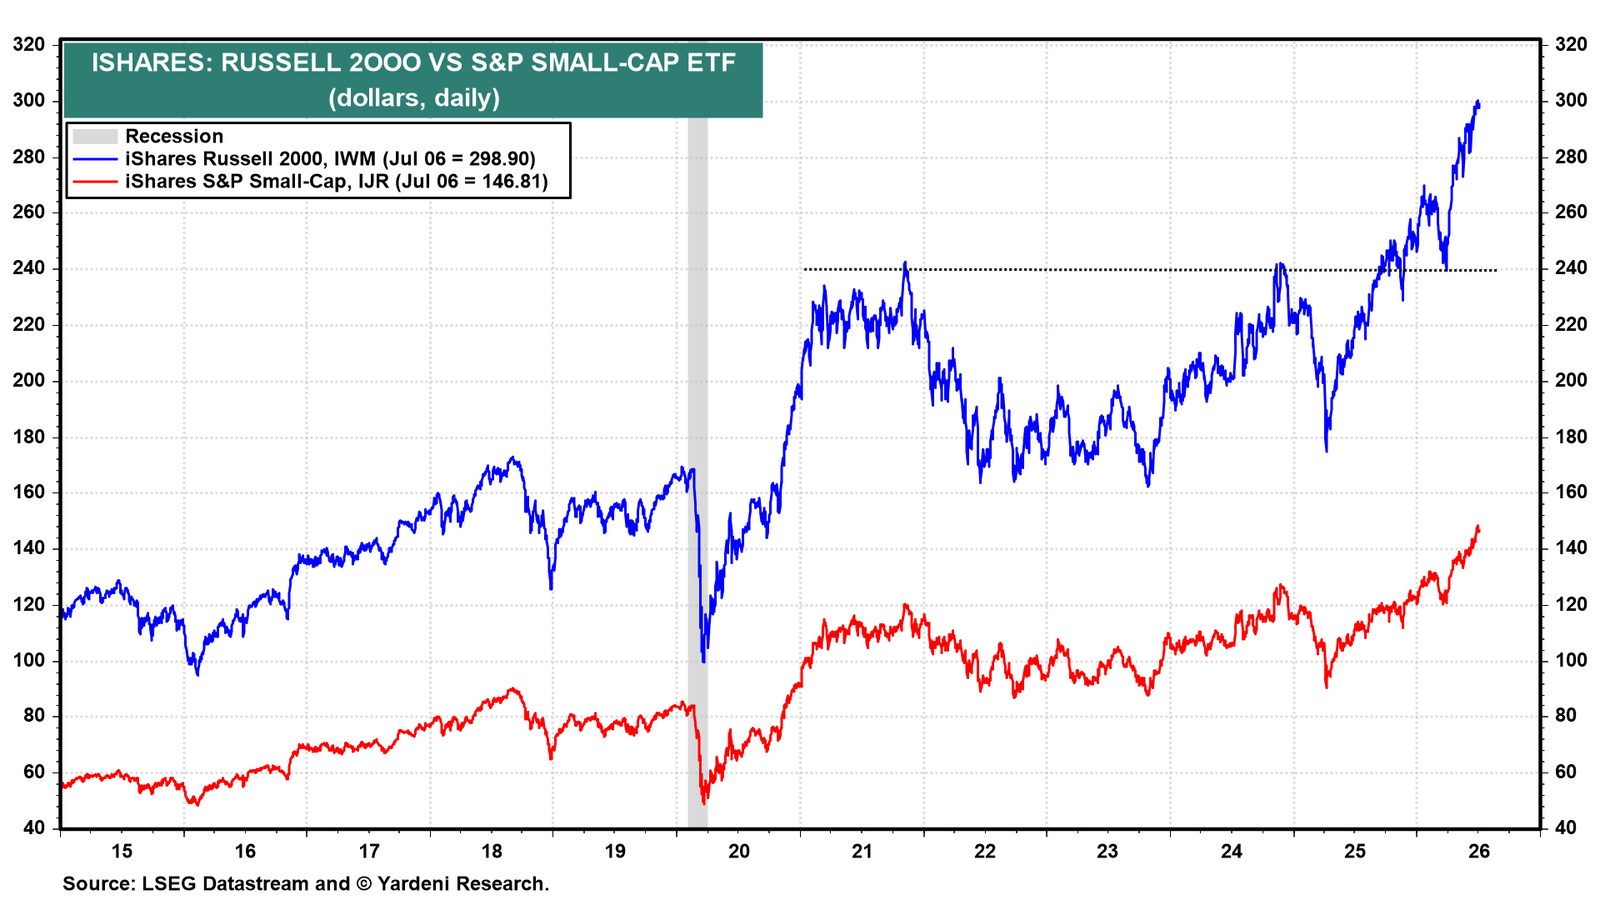
The market has also broadened to include the Russell 2000 (chart).
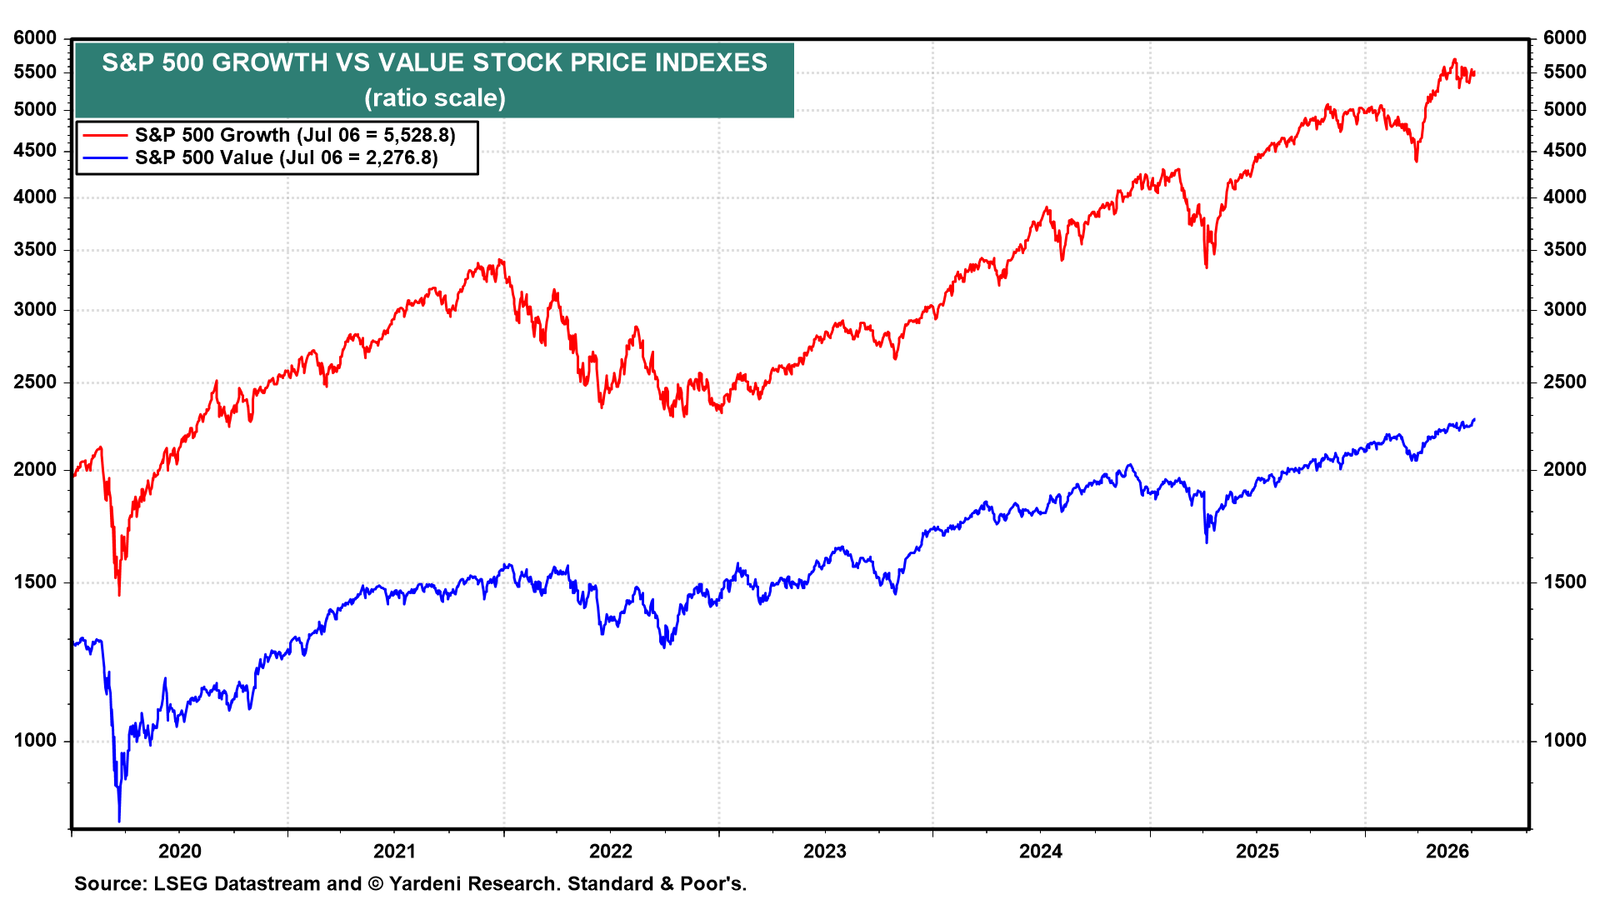
Also significant is that the S&P 500 Value stock price index is breaking out into record territory, while the comparable Growth index has stalled. Investors may be signaling that the latter is a crowded trade that already discounts hard-to-beat earnings expectations.