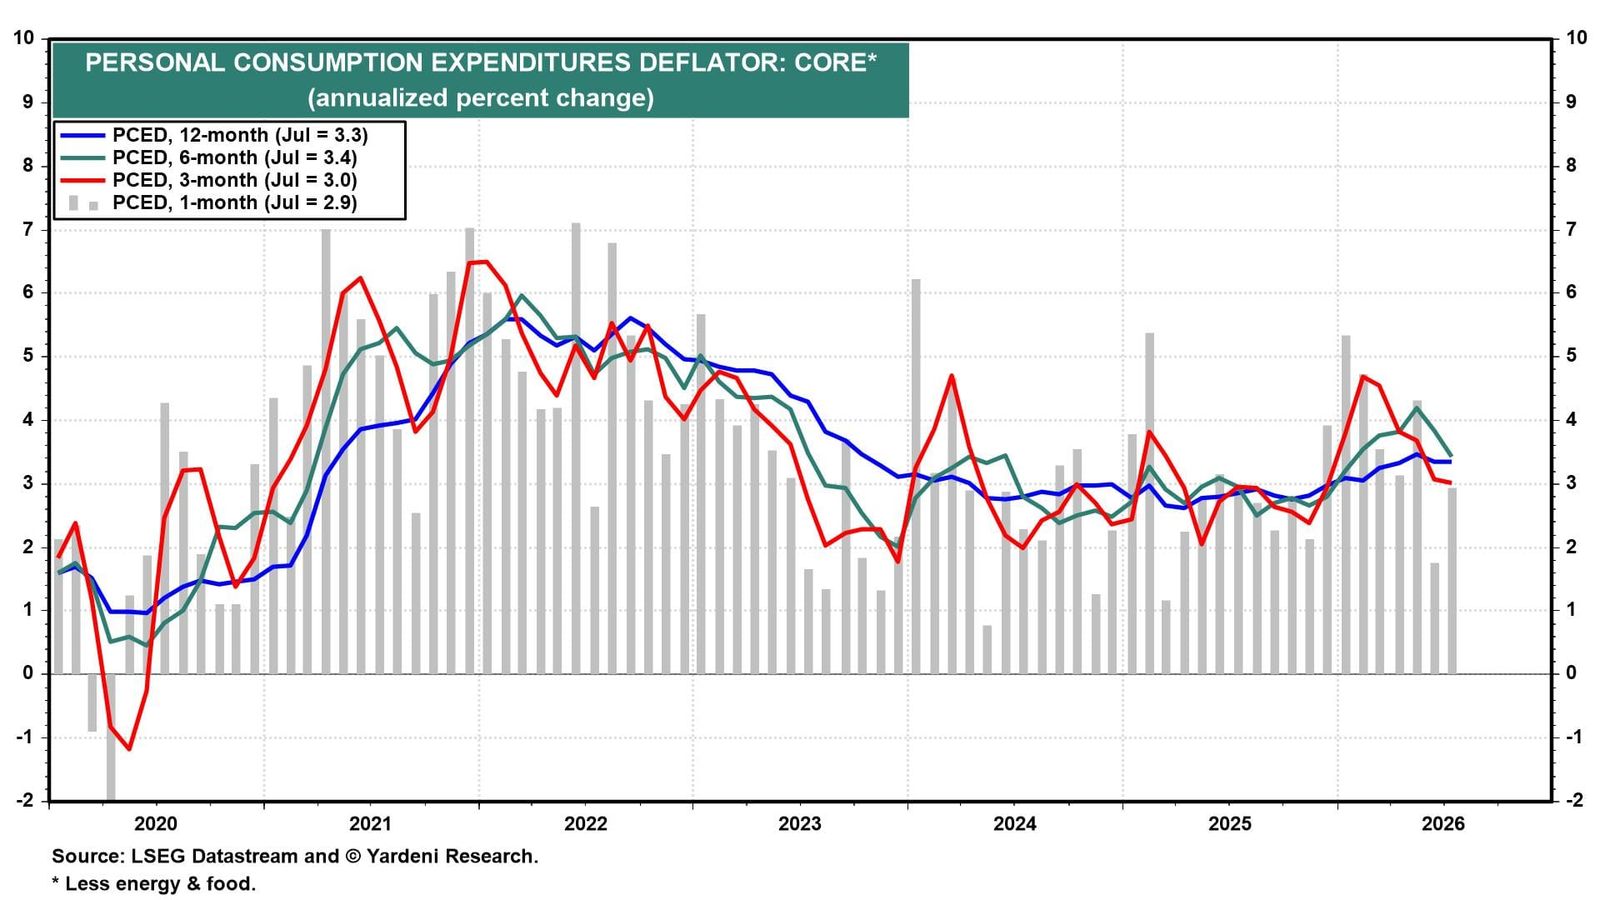
The outcome of the September 16-17 FOMC meeting will likely hinge on this week's August CPI and PPI reports. Fed Governor Christopher Waller recently noted that while inflation remains "meaningfully above" the Fed's 2.0% target, the three-month annualized core PCED inflation rate fell from 4.76% in February to 3.05% in July (chart). If that trend continues, he said he would favor holding the federal funds rate steady. We suspect many Fed officials share a similar view.
The challenge is that August's PCED report will not be released until after the FOMC meeting. Furthermore, the core CPI has not been a reliable guide to the hotter inflation pressures reflected in the core PCED recently. The spread between the two measures is the most negative since the early 1980s, with the core PCED running well above the core CPI (chart). Nevertheless, most Fed policymakers will likely use the CPI and PPI reports to estimate August's core PCED before casting their votes.
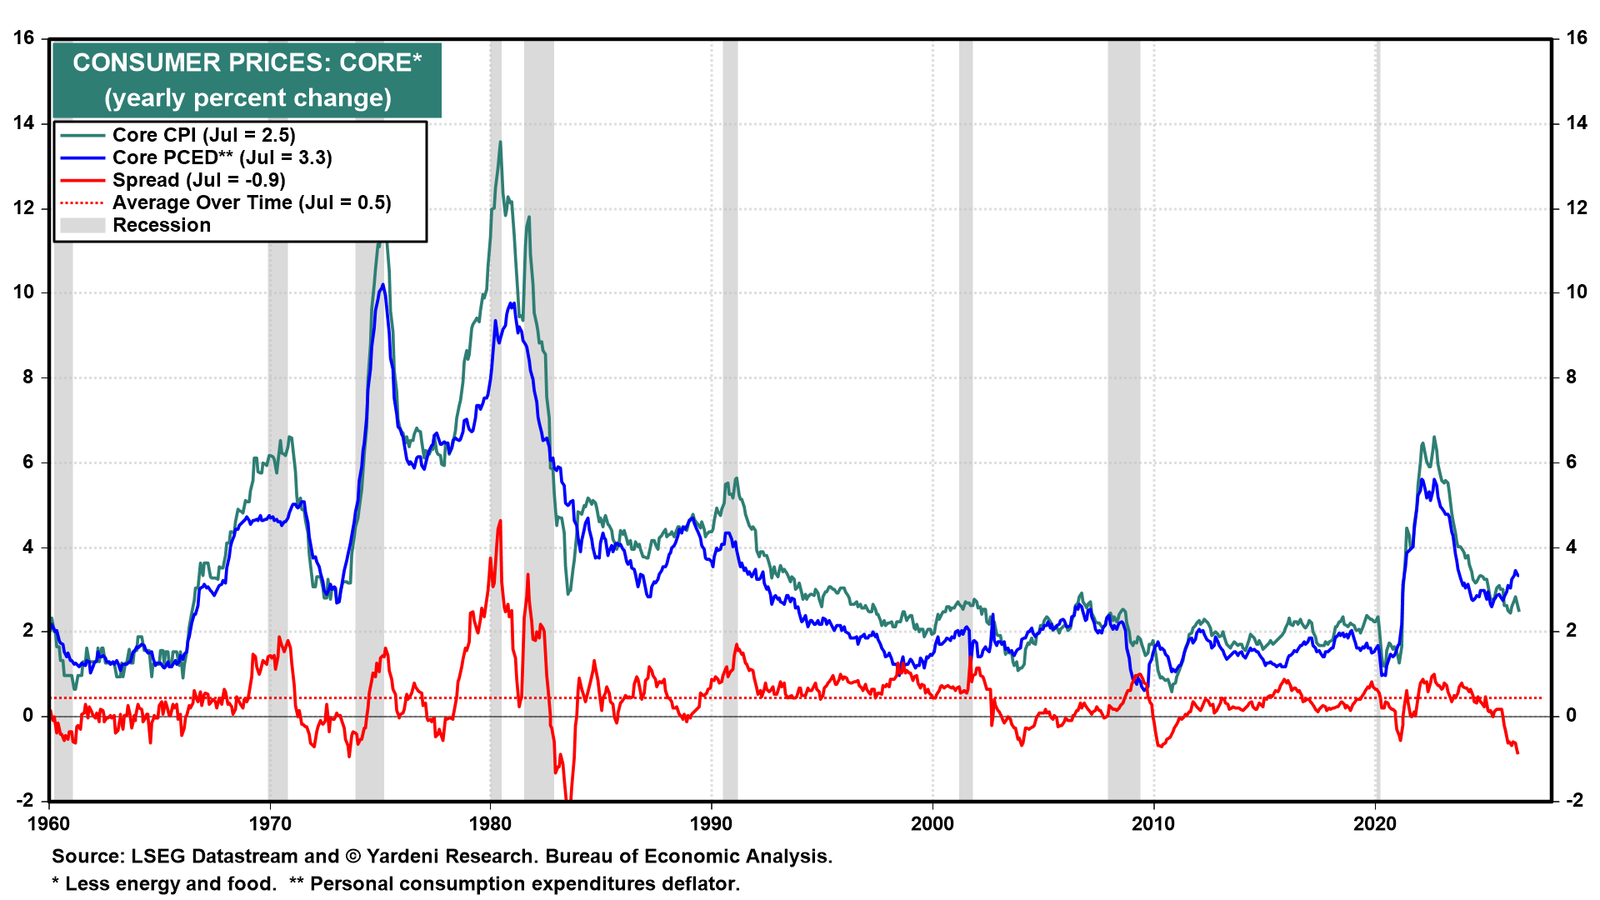
The widening wedge has two sets of drivers: some stem from structural differences between the indexes, and others reflect price dynamics unique to the current environment.
I. Structural Drivers
Three structural differences explain why the measures rarely move in lockstep:
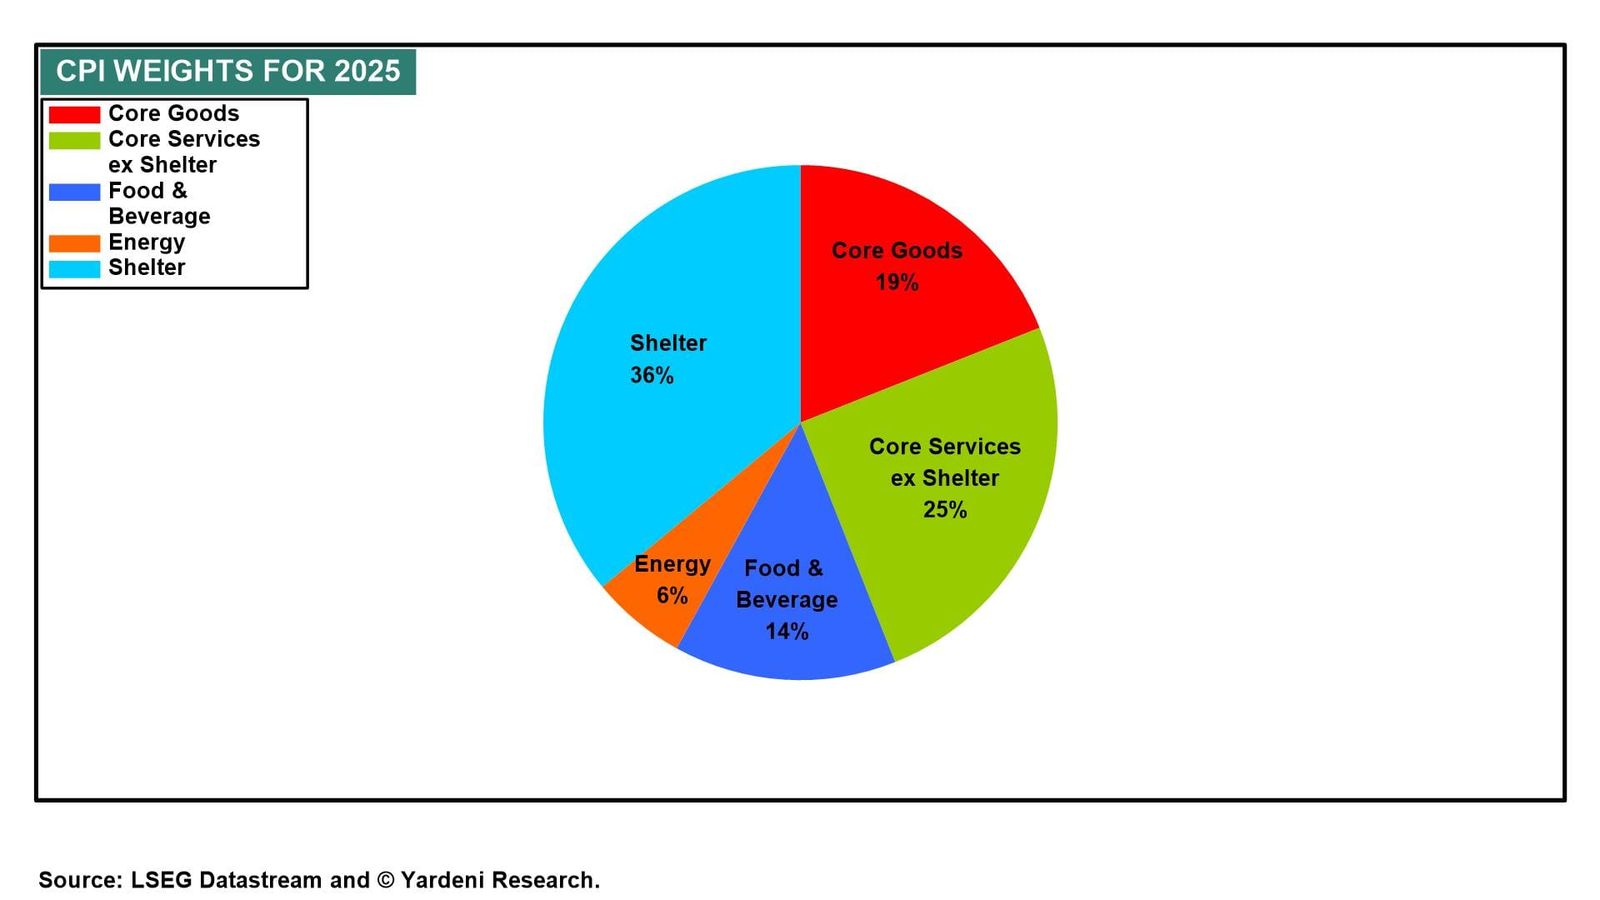
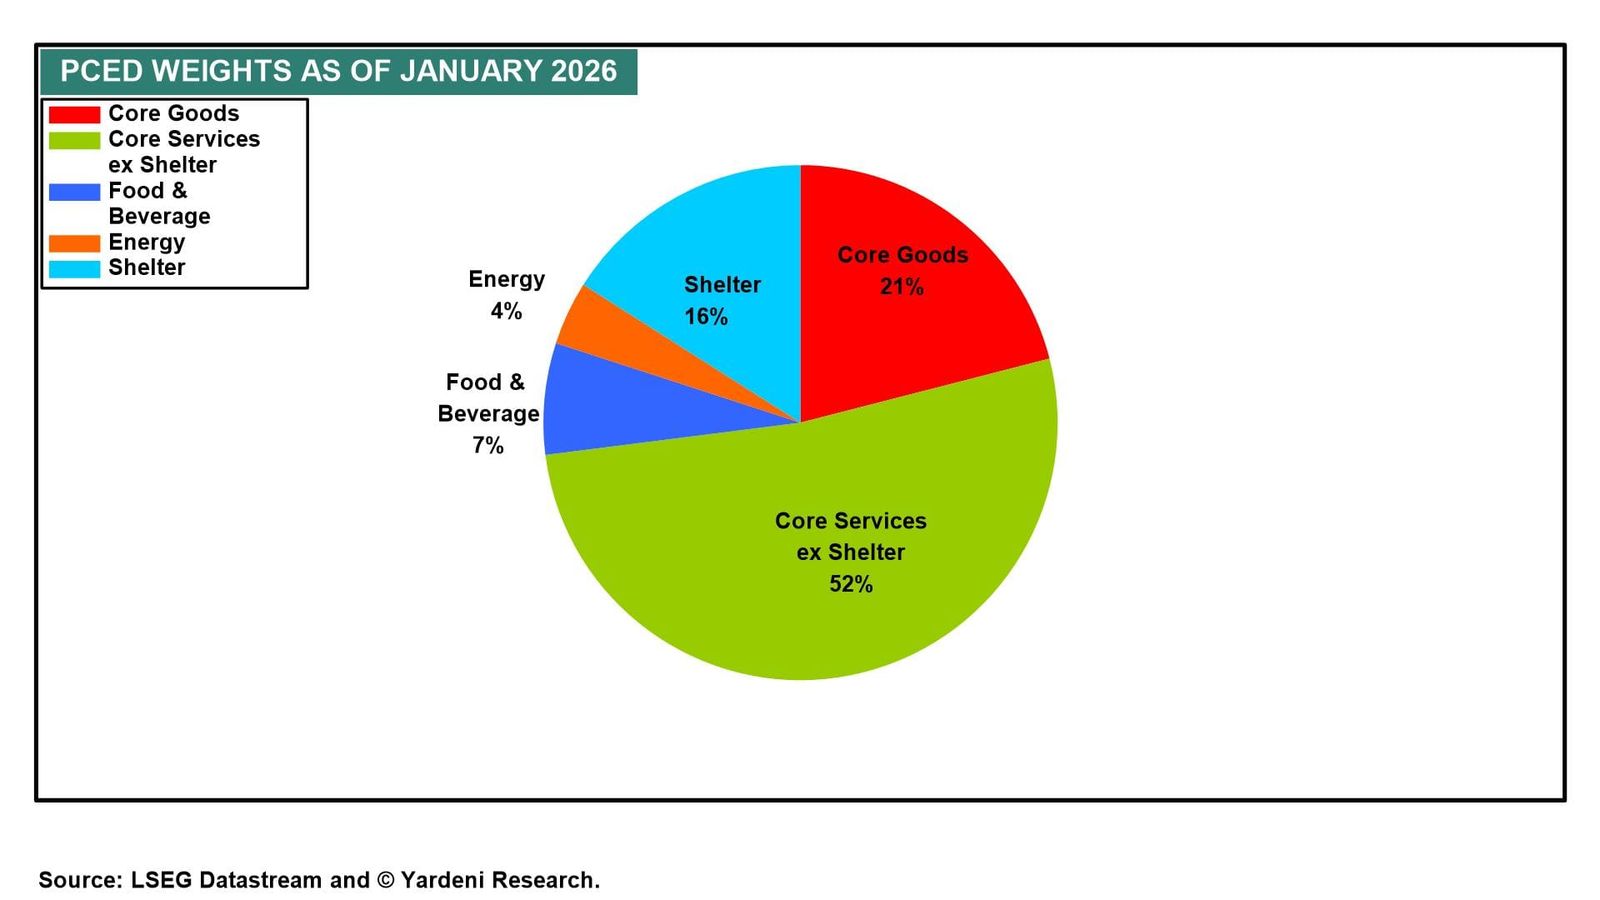
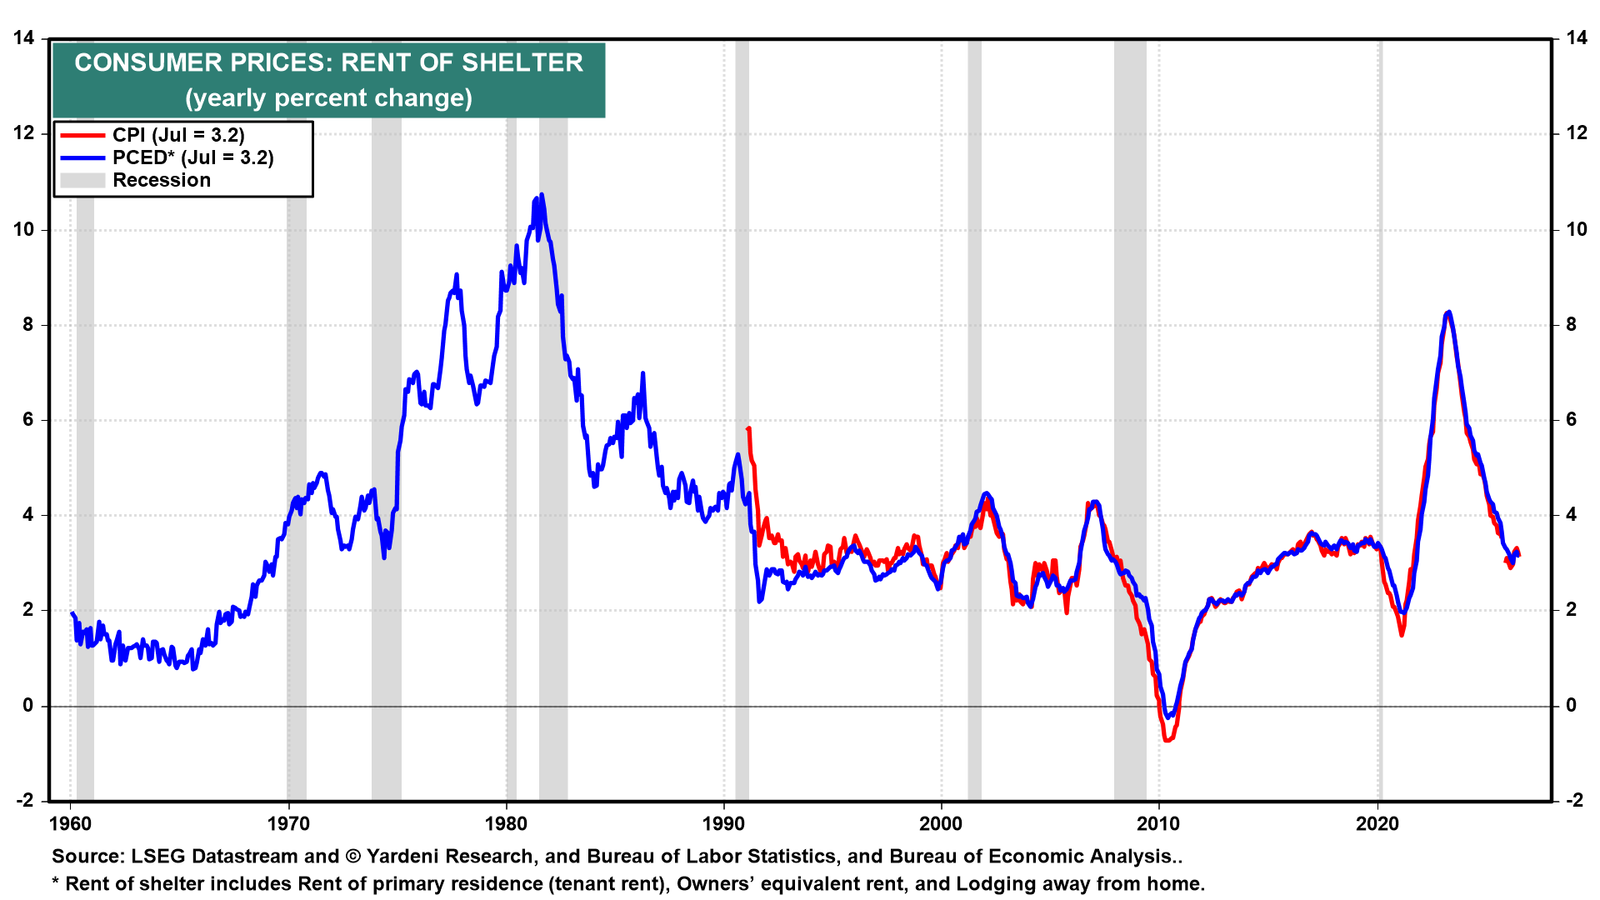
(1) Different weights. Shelter accounts for roughly 36% of the CPI but only about 16% of the PCED (charts). PCED instead places more weight on non-shelter services, including health care and financial services. The same price moves therefore can have very different effects on the two indexes. This weighting gap matters especially when shelter cost inflation moves significantly.
(2) Scope of spending. The CPI measures only out-of-pocket expenses paid directly by consumers, while the PCED measures the full cost of household consumption, including goods and services paid for on consumers' behalf by employers and government programs. As a result, categories such as healthcare carry more weight in the PCED than in the CPI.
(3) Calculation methods. The CPI uses a modified Laspeyres index, while the PCED uses the chain-weighted Fisher-Ideal index. The latter captures substitution more quickly when consumers shift toward relatively cheaper products. For example, if beef prices jump and households buy more chicken as a result, the PCED captures the substitution effect faster.
In the past, these structural differences usually caused the core CPI to run modestly above the core PCED. The average spread between their inflation rates was plus 0.5%.
II. Dynamic 2026 Drivers
Since the indexes' basic construction has not materially changed, recent price developments must explain today's unusually wide wedge. CPI inflation has been running cooler than PCED inflation, with a spread of minus 0.9% in July. We see three explanations:
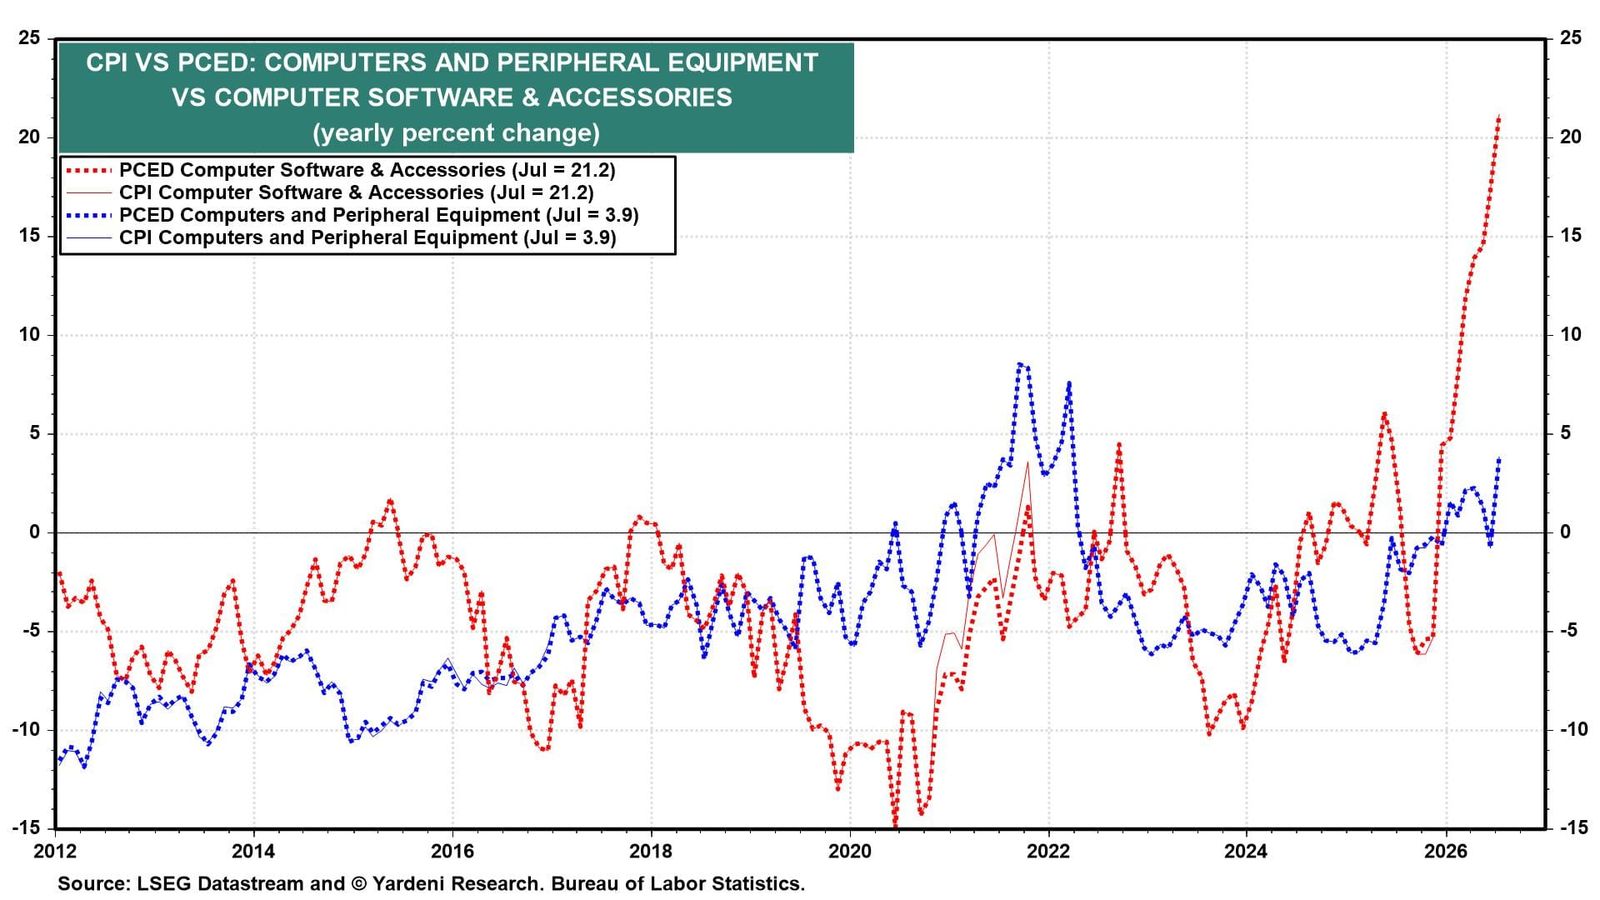
(1) AI infrastructure buildout. One underappreciated difference between the two measures is how they treat software-related spending. Computer software and accessories account for roughly 1.2% of the core PCED, but carry very little weight in the core CPI. AI investment has fueled demand for software, cloud services, and related technology products, causing software inflation to soar 21.1% y/y. That has boosted the core PCED meaningfully while affecting the core CPI much less (chart).
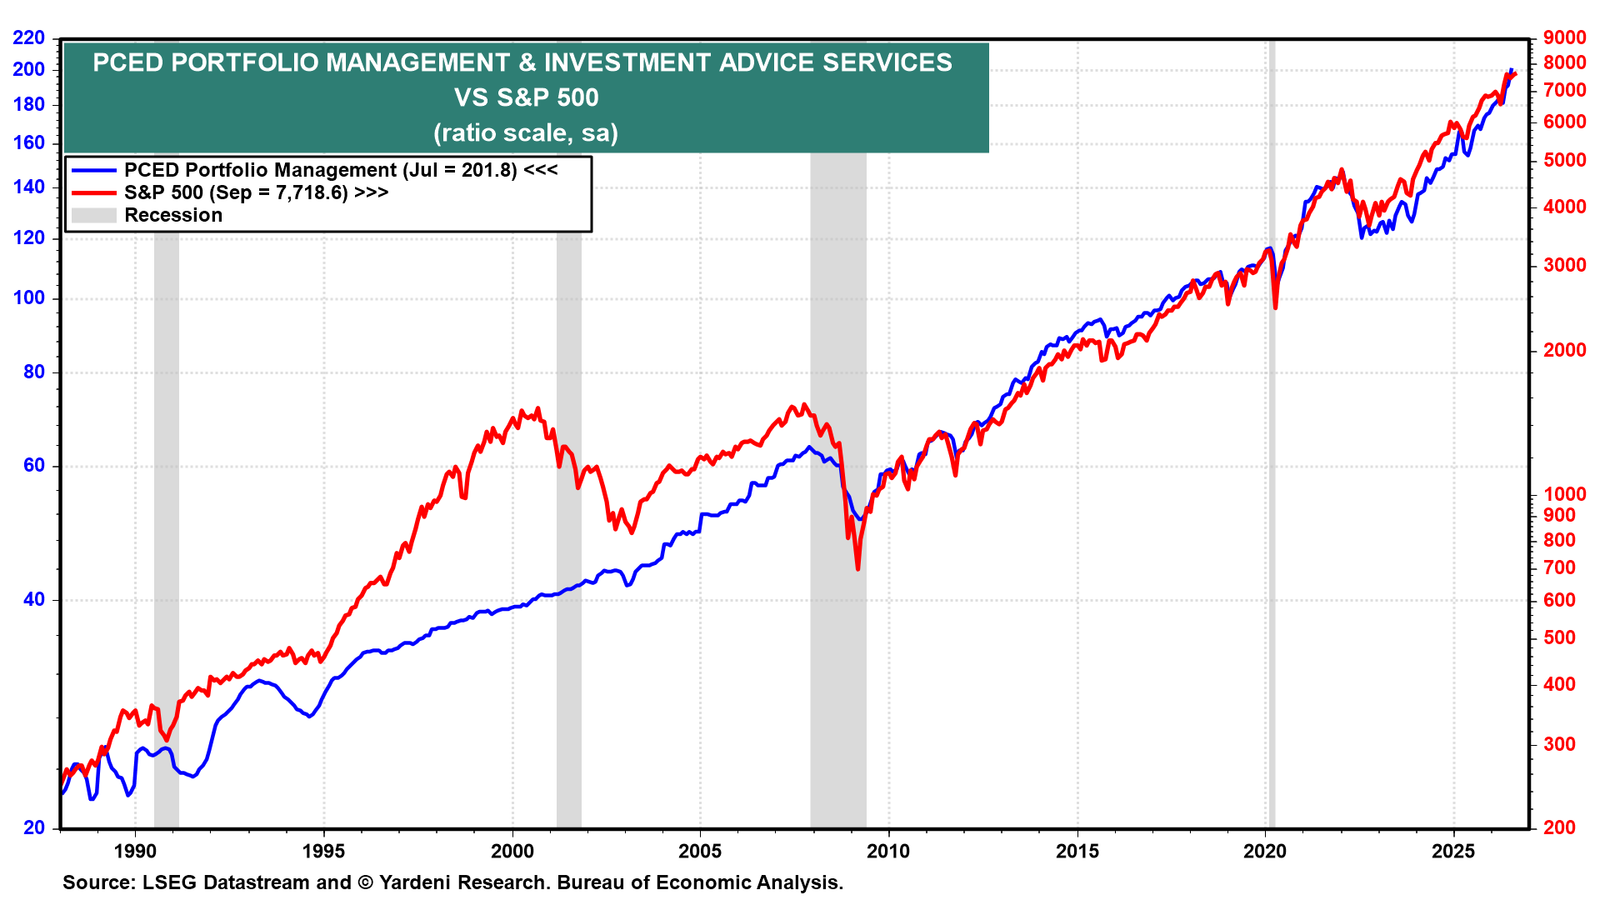
(2) Financial services. The core PCED includes portfolio-management fees, banking services, and other financial services that receive little weight in the CPI. These prices have risen alongside equity values and assets under management, pushing the Fed's preferred inflation gauge higher (chart). In effect, the equity bull market has spilled into measured inflation through categories that the CPI largely misses.
(3) Shelter inflation. Shelter's weight in the core CPI is more than twice its weight in the core PCED. As rent of shelter inflation has cooled, it has pulled the core CPI down more strongly (chart).
III. Outlook for the Wedge
Looking ahead, several factors matter when assessing the likely direction of the wedge between core CPI inflation and core PCED inflation:
(1) AI infrastructure buildout. The AI investment boom should remain a source of inflation pressure until expanding capacity and broader adoption generate more meaningful supply-side benefits, putting greater upward pressure on core PCED inflation than on core CPI inflation.
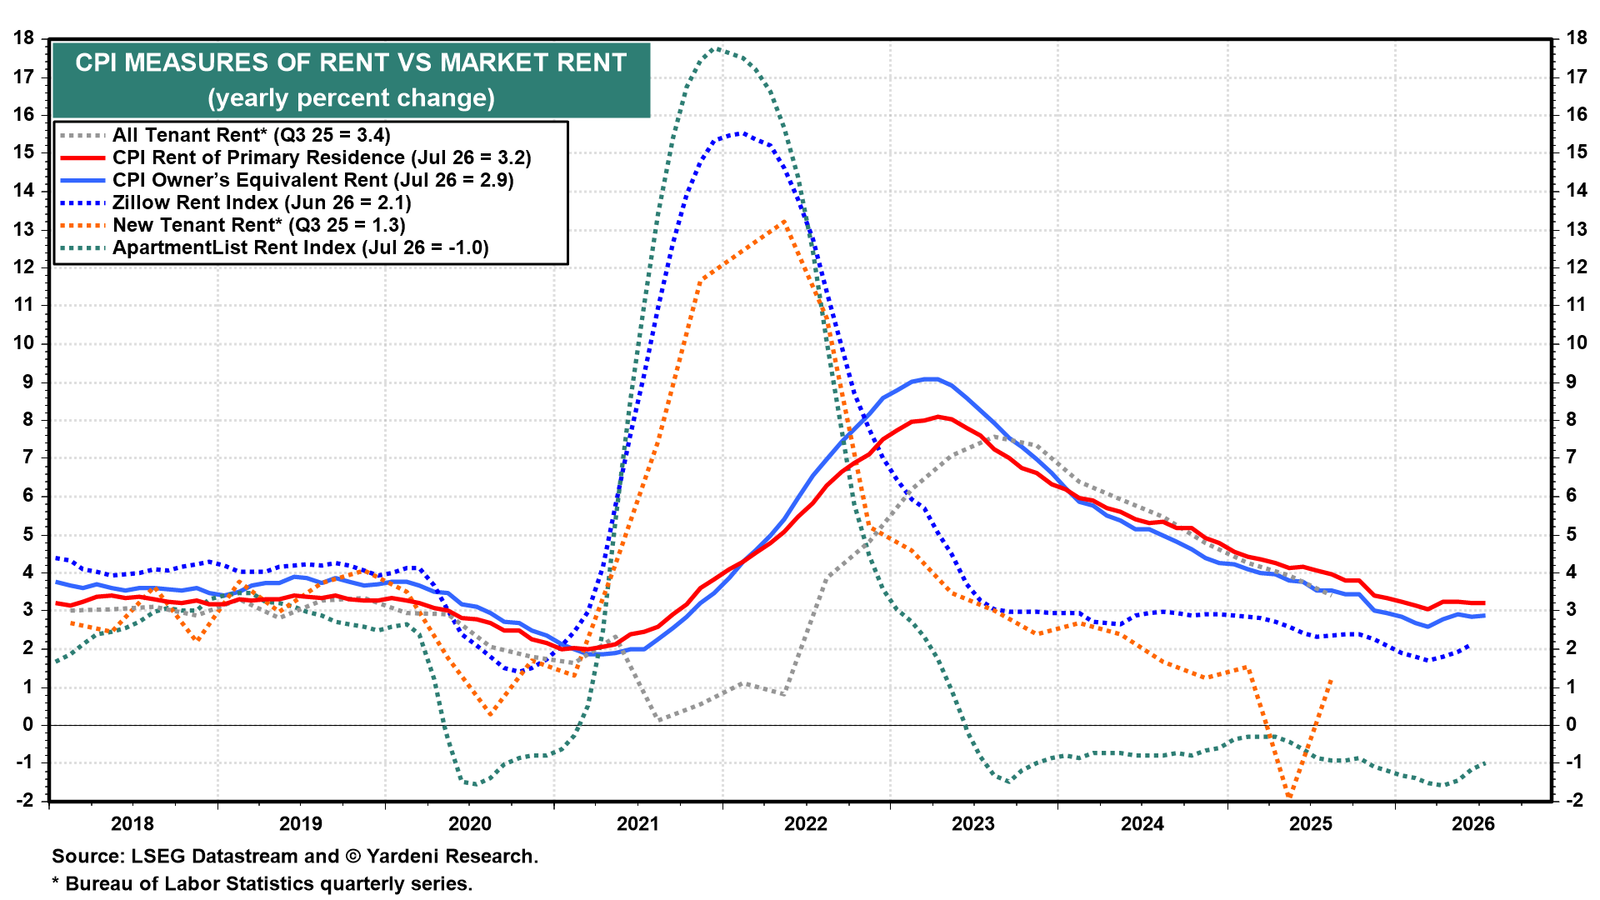
(2) Shelter inflation. The trajectory of market rents suggests that further shelter disinflation is in the pipeline, which should provide a greater disinflationary tailwind to core CPI inflation than to core PCED inflation (chart).
(3) BEA methodology changes. The BEA's planned methodology changes, which will take effect with the September PCED release (in October), are expected to shave roughly 0.1 to 0.3 percentage points off recent y/y core PCED inflation readings. The revisions will reduce the influence of stock-market-driven portfolio-management inflation, soften AI-related pressures on software and IT services prices, and replace volatile CPI-based estimates for legal services with more stable PPI measures.
(4) Bottom line. The Fed remains focused on core PCED inflation. Given the unusually wide gap between the core PCED and the core CPI, the Fed’s September decision will depend less on the headline CPI reading and more on how the underlying CPI and PPI components translate into the core PCED. If they point to persistently elevated inflation, a rate hike is likely. If not, the Fed may hold the federal funds rate steady. Stay tuned.