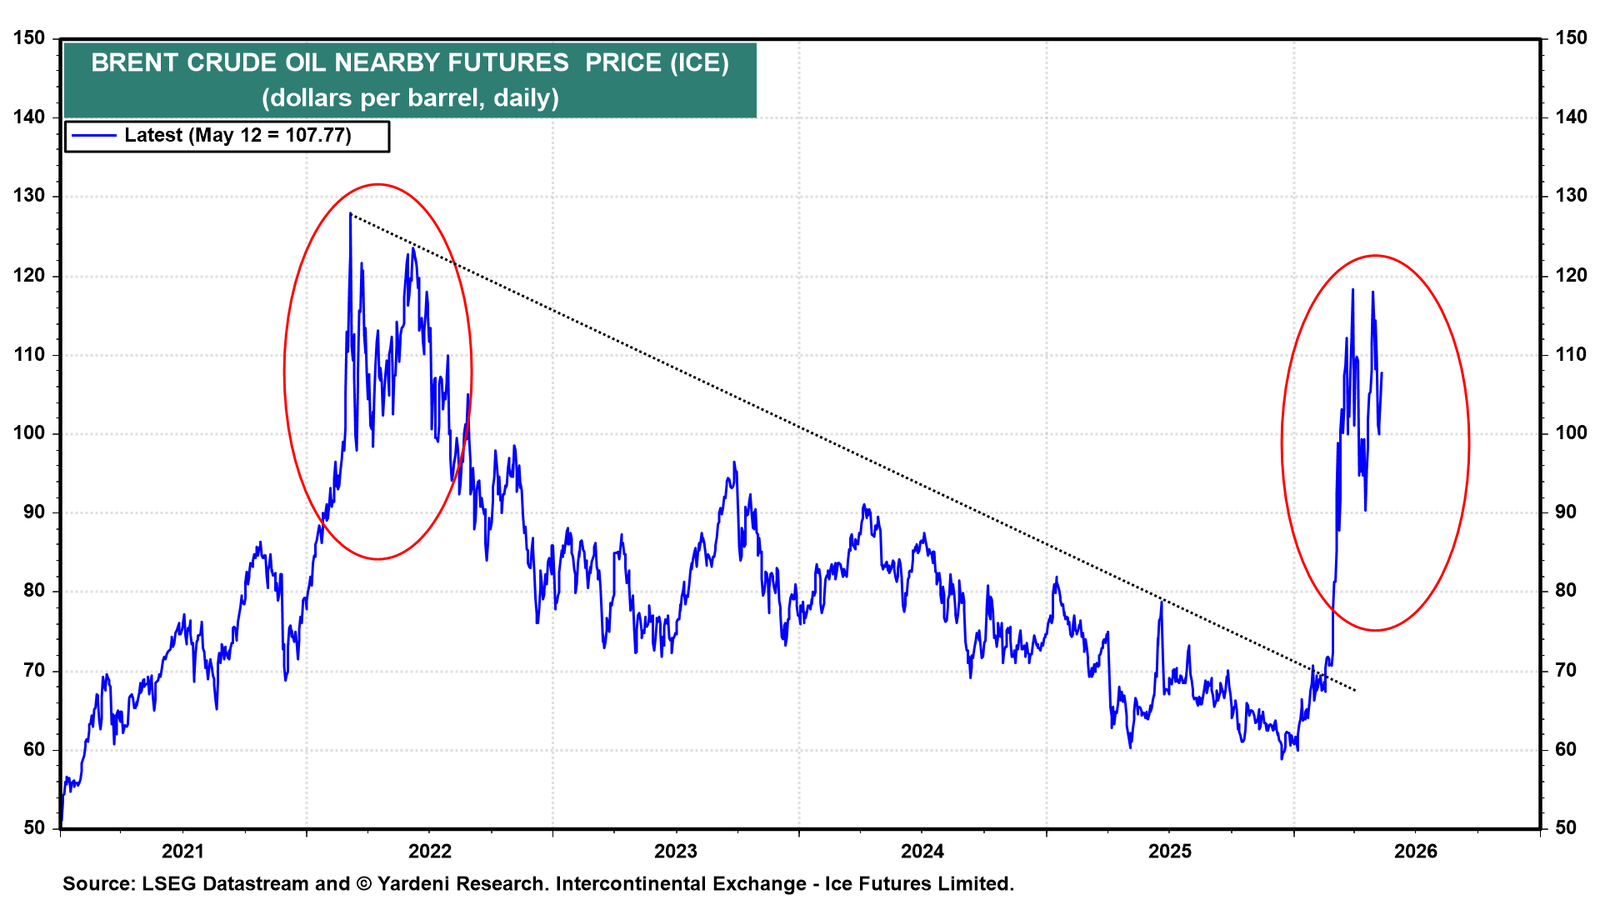
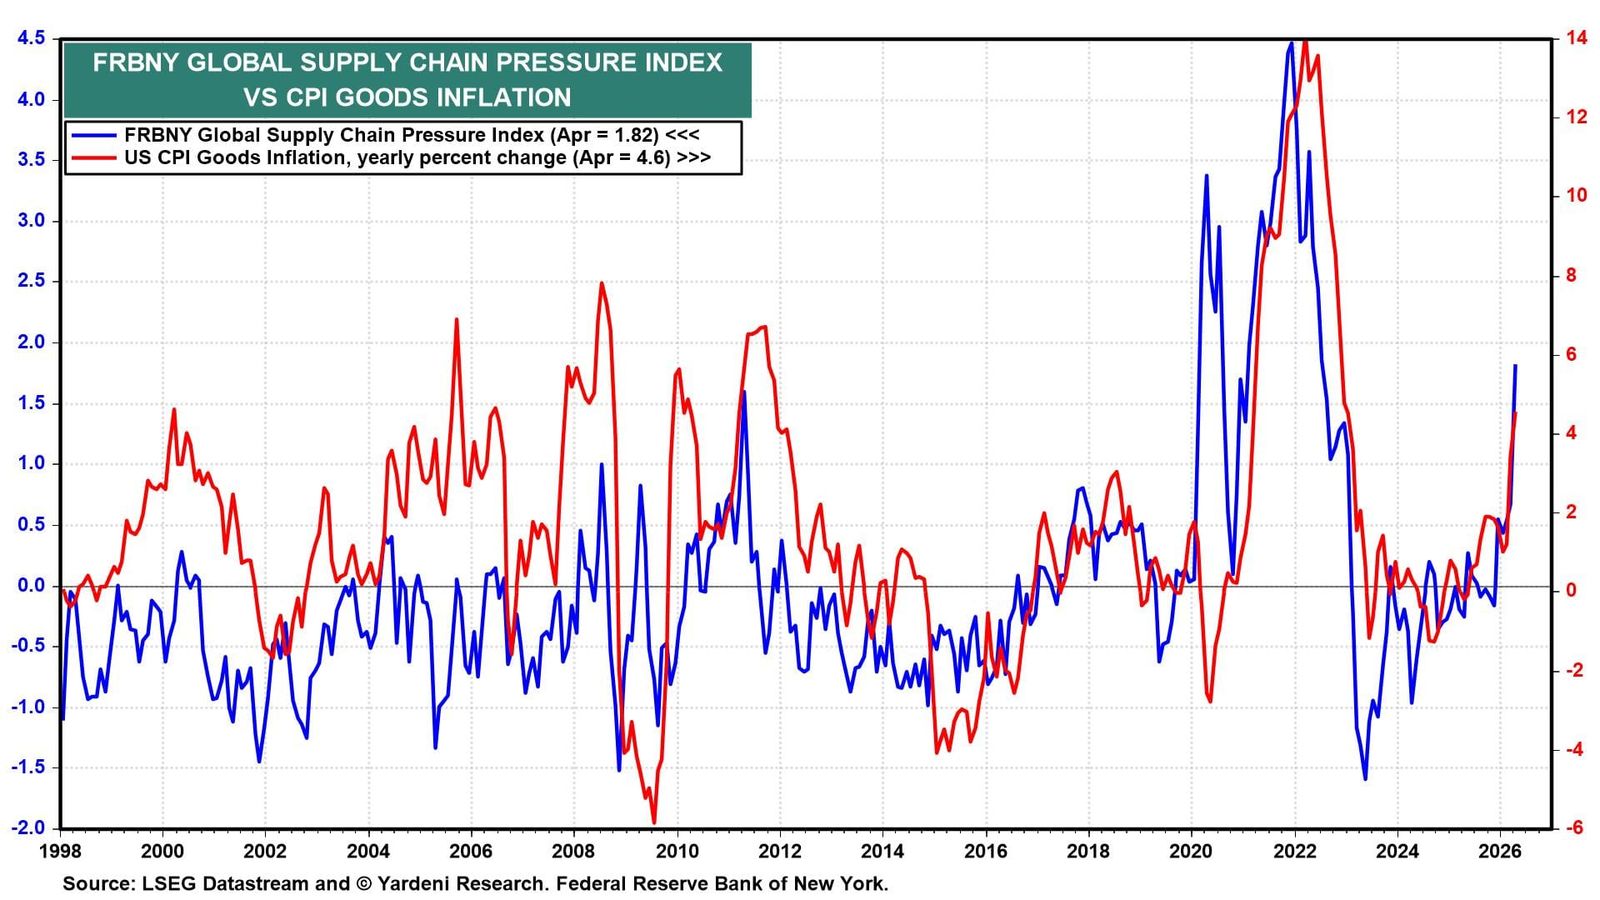
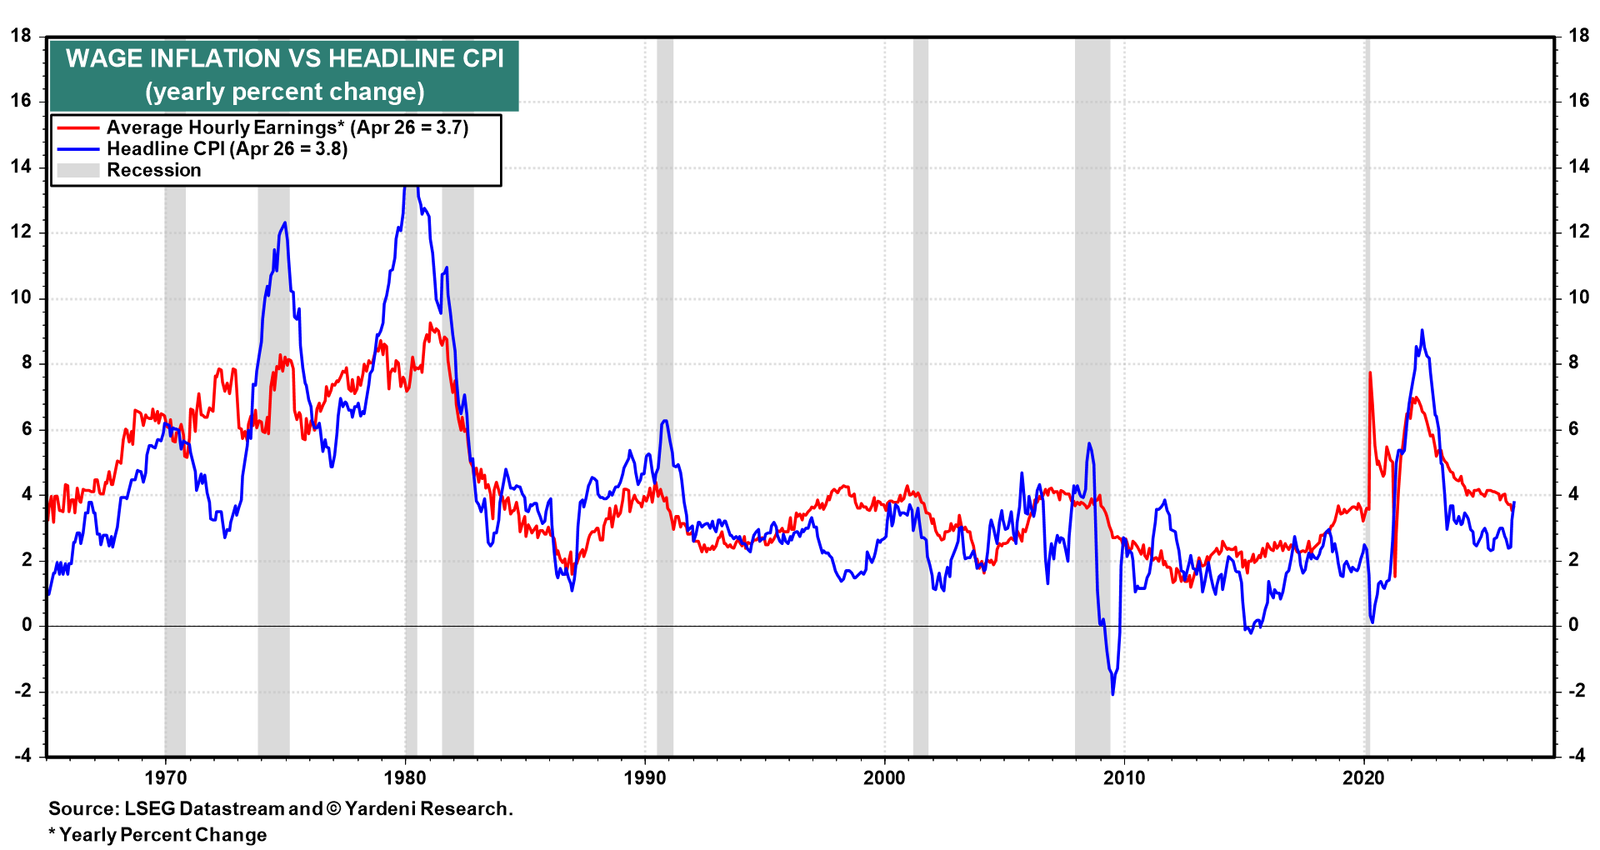
During 2021 and 2022, a wage-price spiral was exacerbated by widespread global supply chain disruptions and a spike in oil prices following Russia's invasion of Ukraine (charts). This time, the war in the Middle East has caused oil prices to spike. Some supply chains have been disrupted. But a wage-price spiral is less likely.
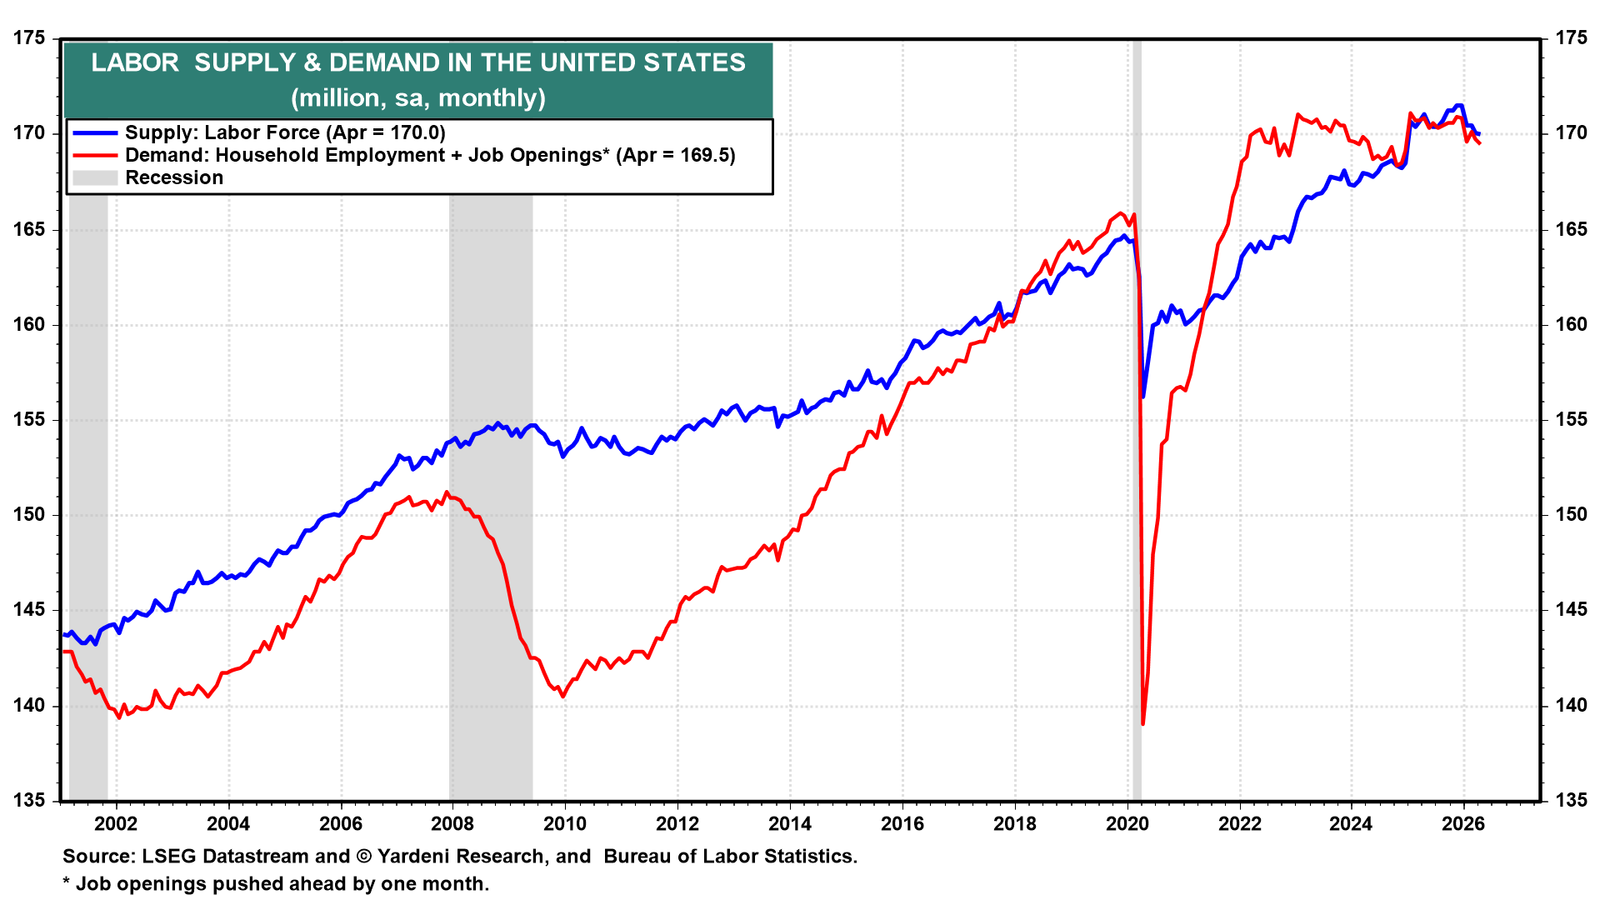
The labor market is in equilibrium this time (chart). In 2021-22, demand for labor significantly exceeded the supply of labor. So, wage inflation should remain much more moderate this time than it was back then (chart).
If so, then a wage-price spiral is unlikely to amplify the inflationary consequences of the supply shock attributable to the Strait of Hormuz blockade (chart).
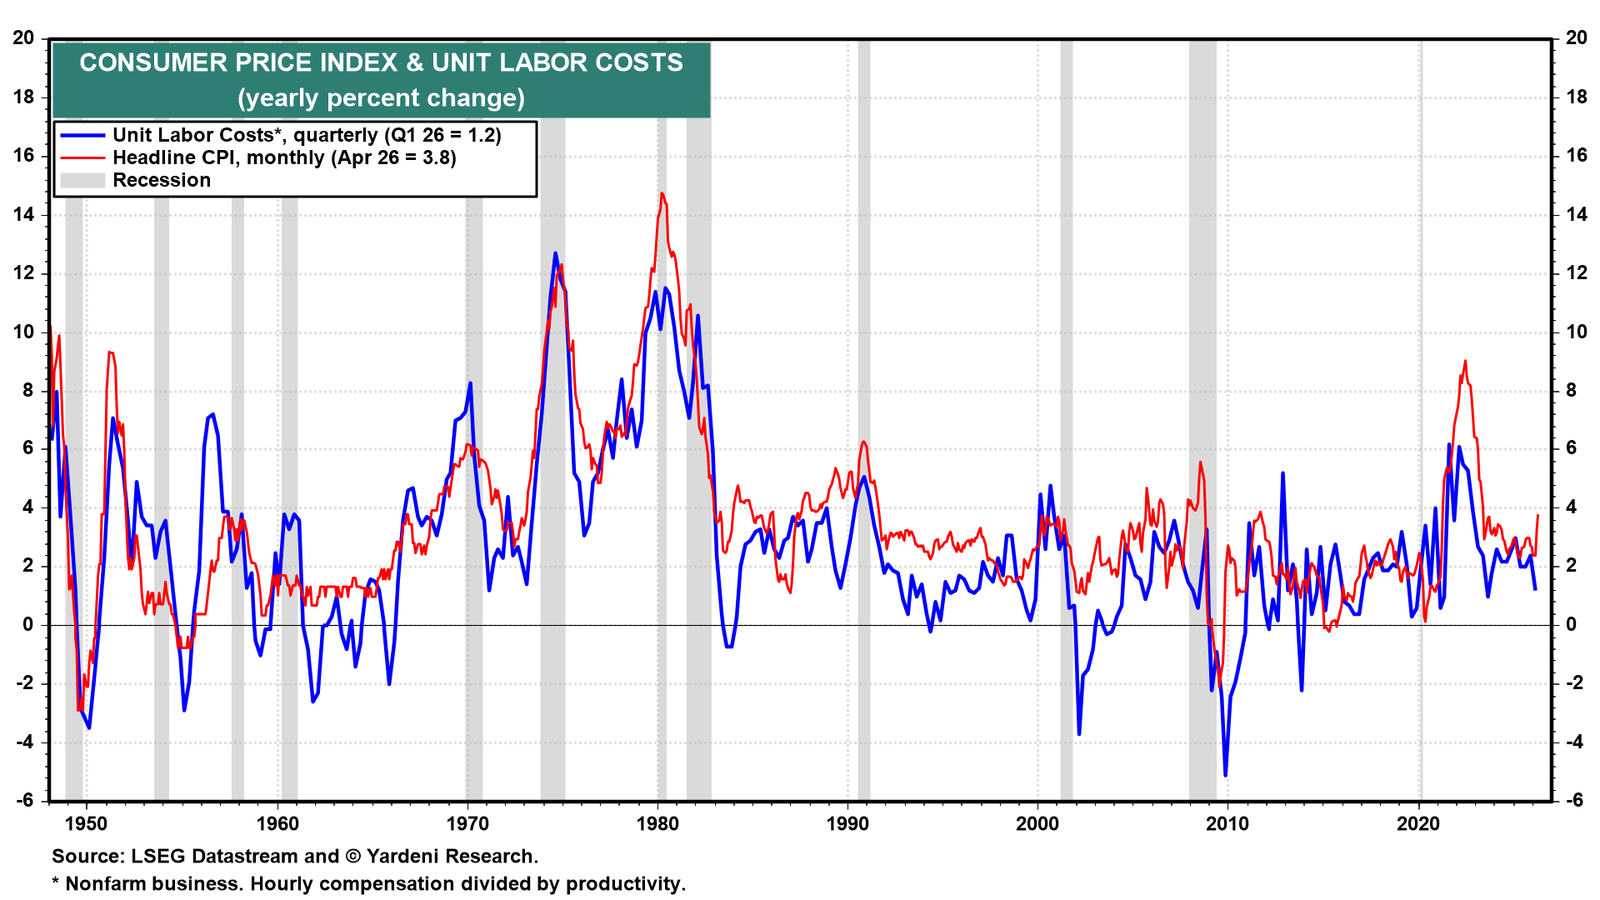
Unit labor cost inflation fell to 1.2% y/y during Q1 as productivity gains offset increases in hourly compensation (chart). In our Roaring 2020s scenario, productivity should remain a powerful disinflationary force, while wage inflation remains moderate.
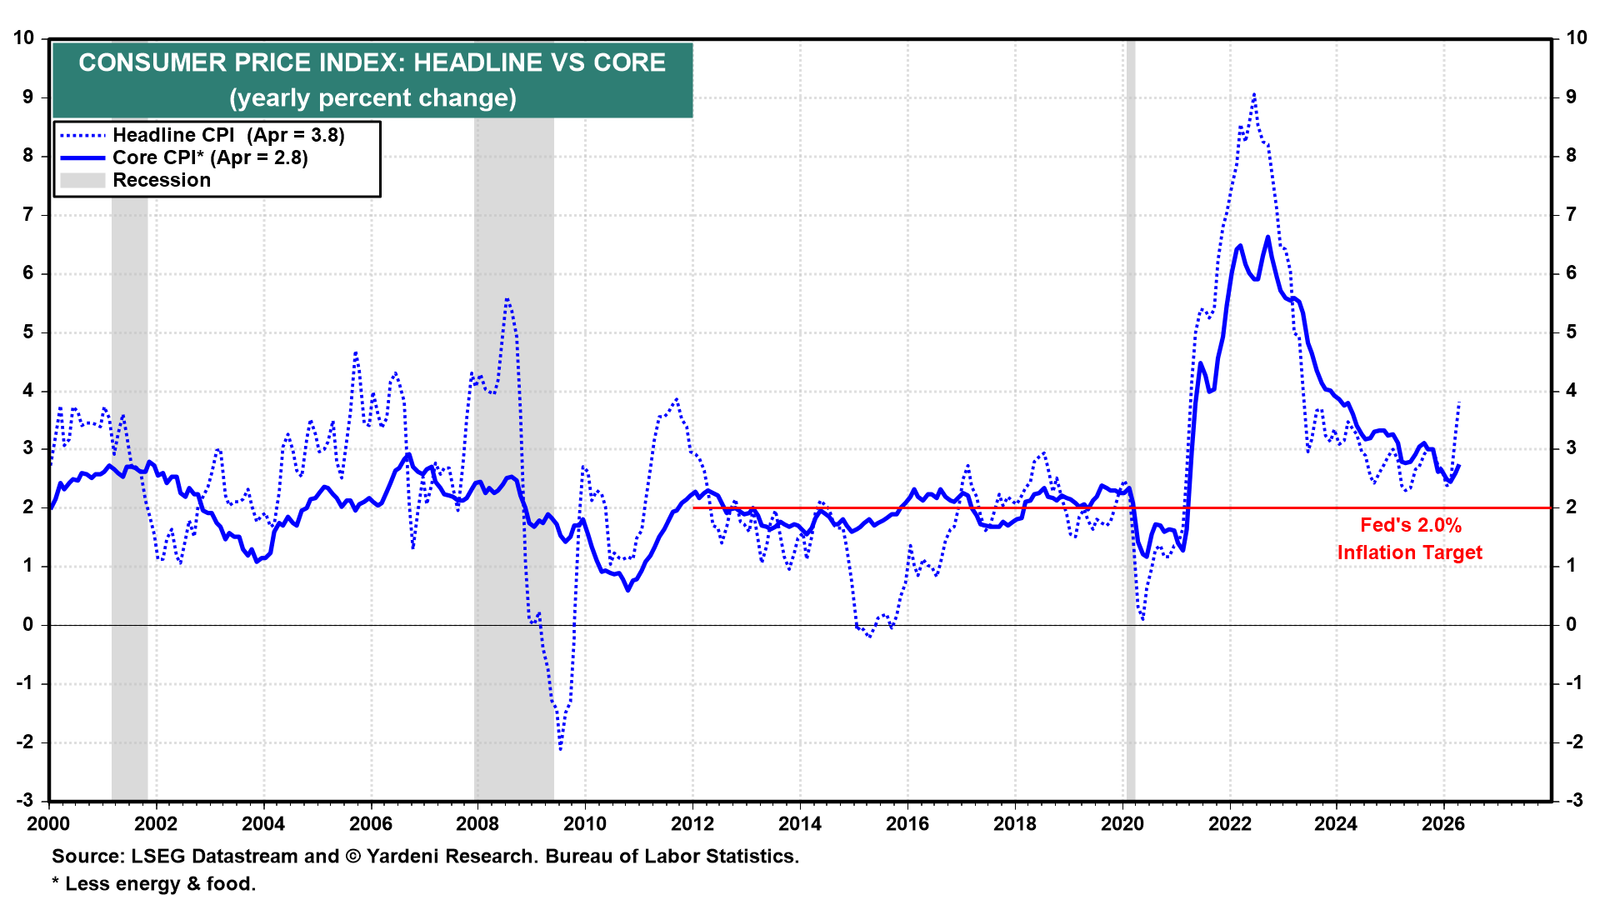
As a result of the latest energy shock, the headline and core CPI inflation rates rose to 3.8% and 2.8% y/y during April (chart). The headline inflation rate was the highest since May 2023, and up half a percentage point from March.
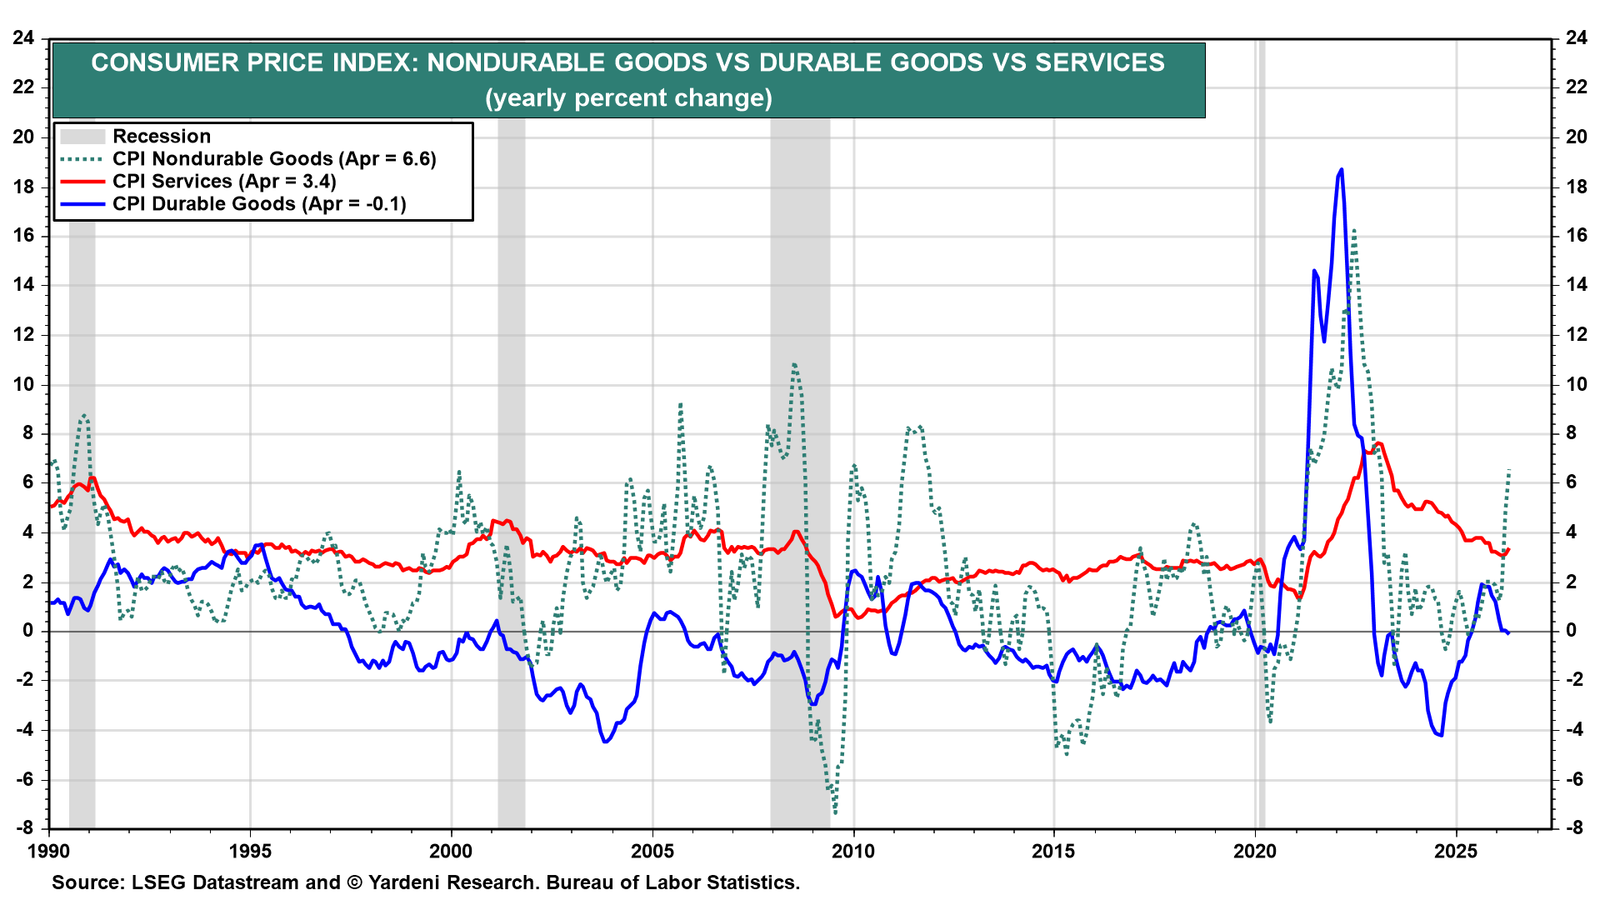
The CPI inflation rate was driven higher by a 6.6% y/y increase in nondurable goods prices, as energy prices rose 17.9% y/y (chart). Durable goods inflation continued to moderate to -0.1% y/y, indicating that the impact of tariffs is diminishing. The services inflation rate edged higher to 3.4%.
Let's have a closer look at the CPI data:
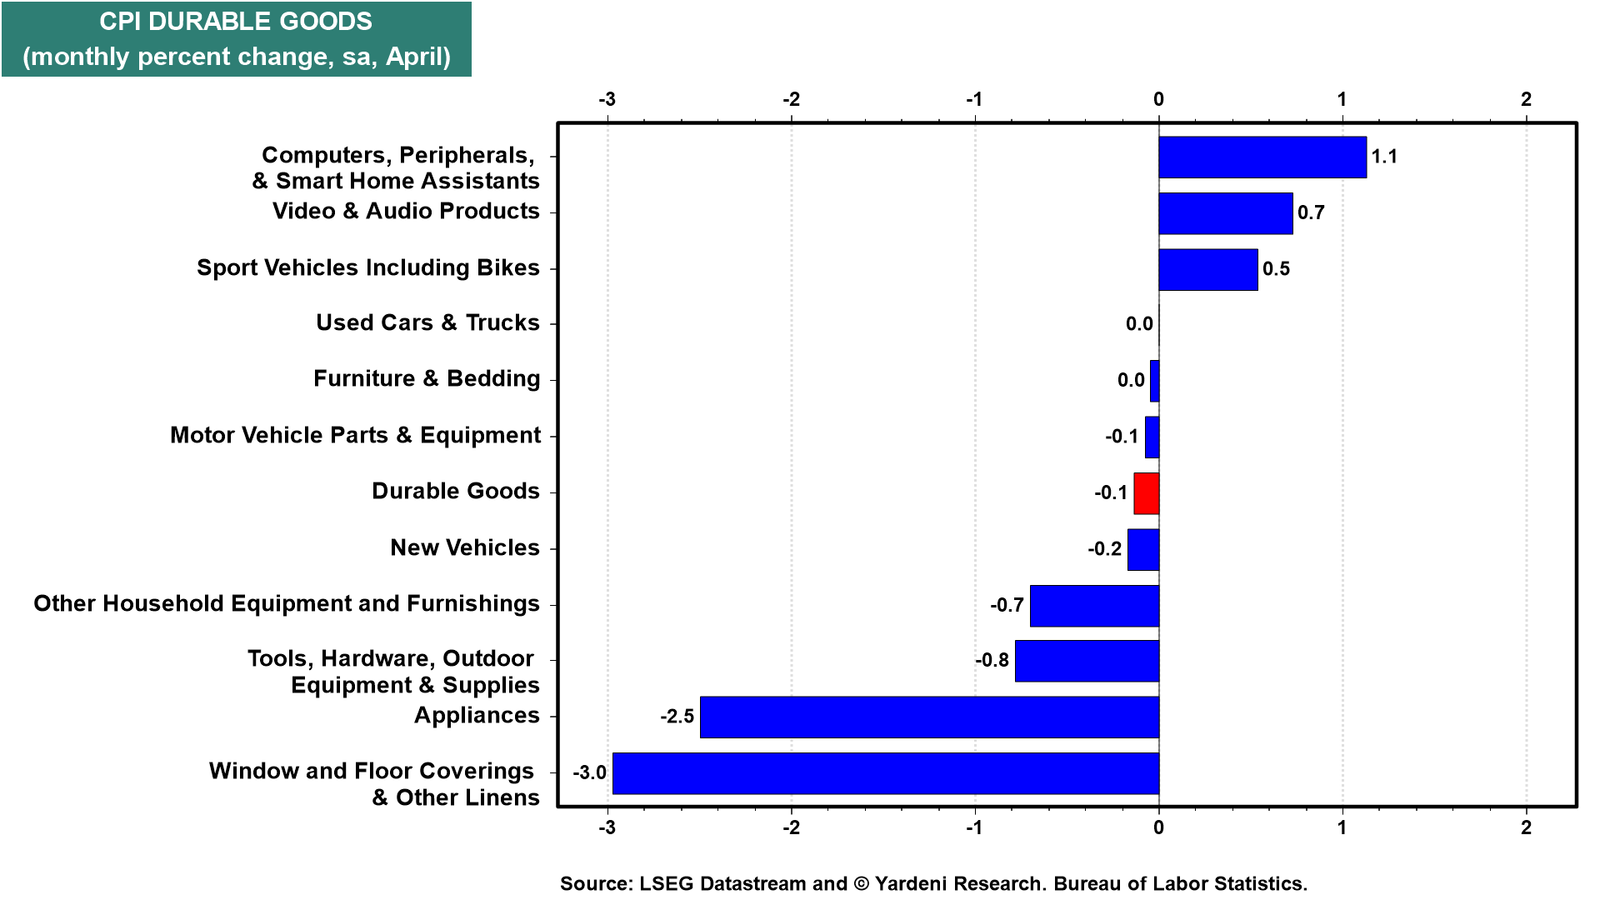
(1) Durable Goods. On a m/m basis, the CPI durable goods component fell 0.1%. While prices in most categories moderated, home electronics prices are showing upward price pressures.
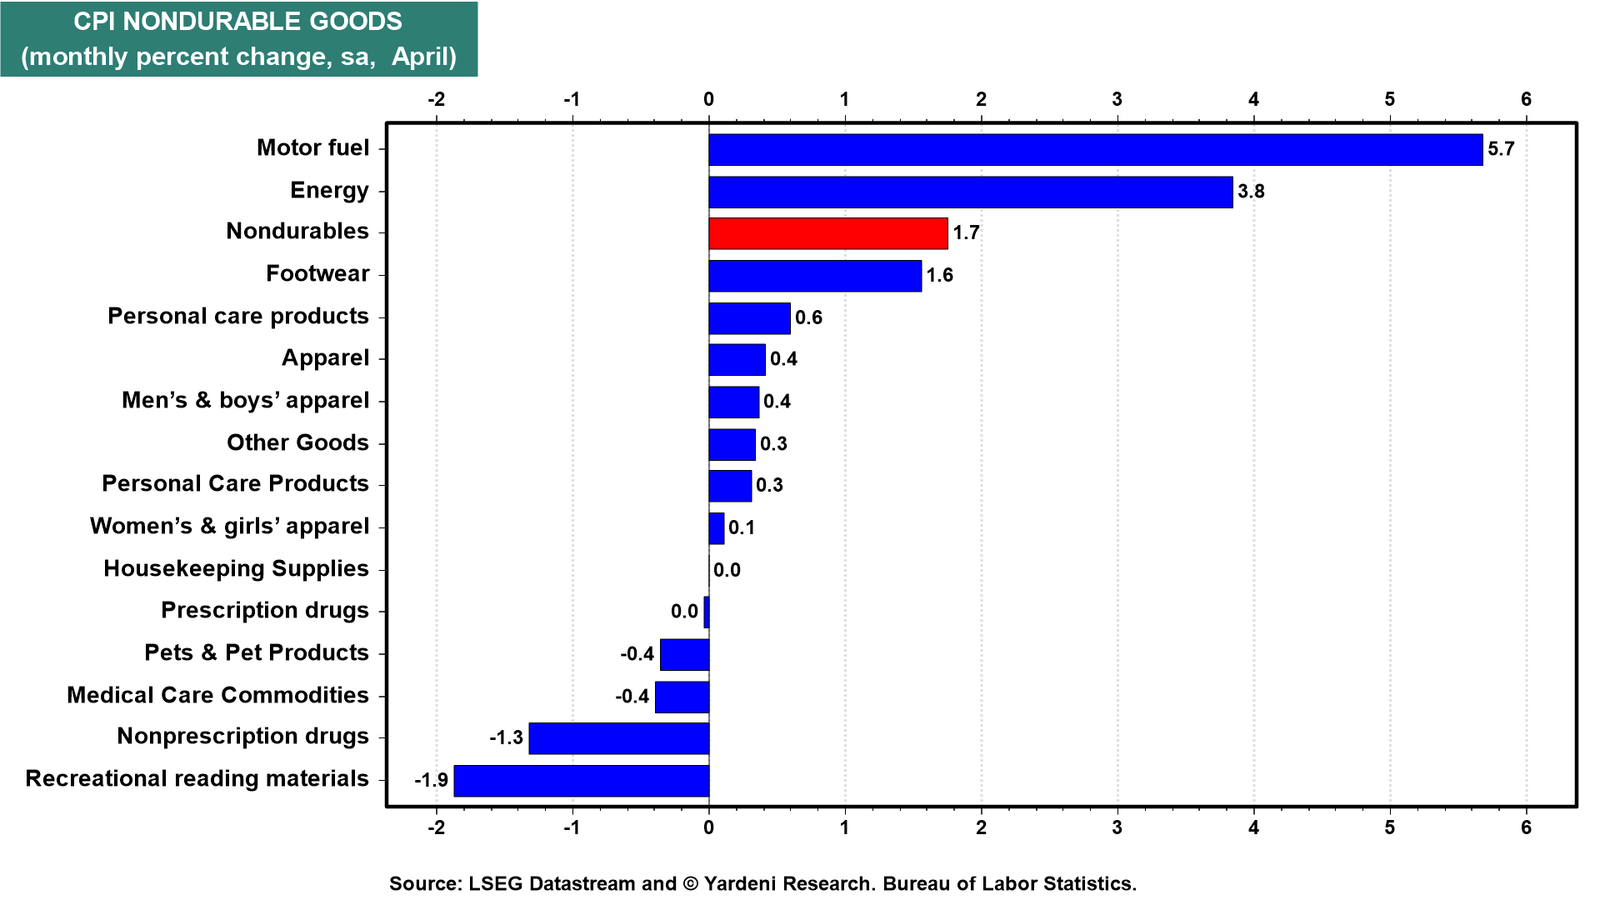
(2) Nondurable goods. The CPI for nondurable goods rose 1.7% m/m. The increase was mostly driven by price pressures in energy-related categories.
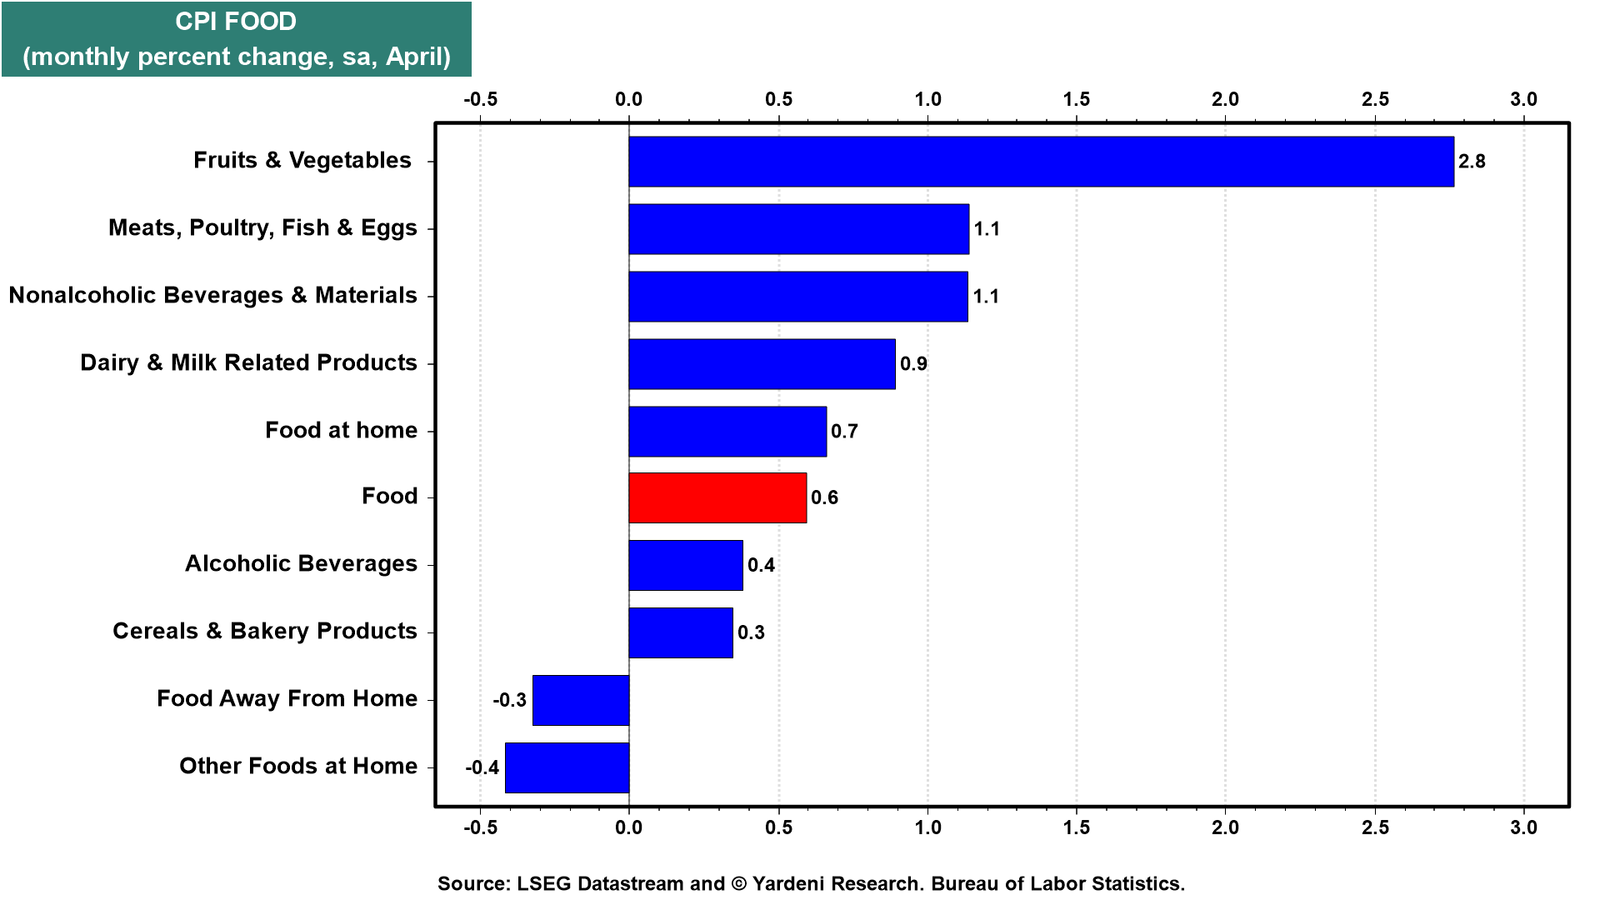
The CPI for food rose at a strong 0.6% m/m pace. The increase reflects a 0.7% m/m jump in food-at-home prices. That rise was driven mostly by a 2.8% m/m increase in fruit and vegetable prices, with tomato prices surging 15.1% m/m due to a perfect storm of weather shocks, trade policy, and rising transportation costs. The CPI for food away from home edged down 0.3%.
(3) Services. Services prices rose 0.6% m/m in April (chart). The gain was broad-based. Postage and delivery prices spiked 4.6% m/m, reflecting rising transportation costs. Airline fares rose 2.4% m/m to offset rapidly rising jet fuel costs.
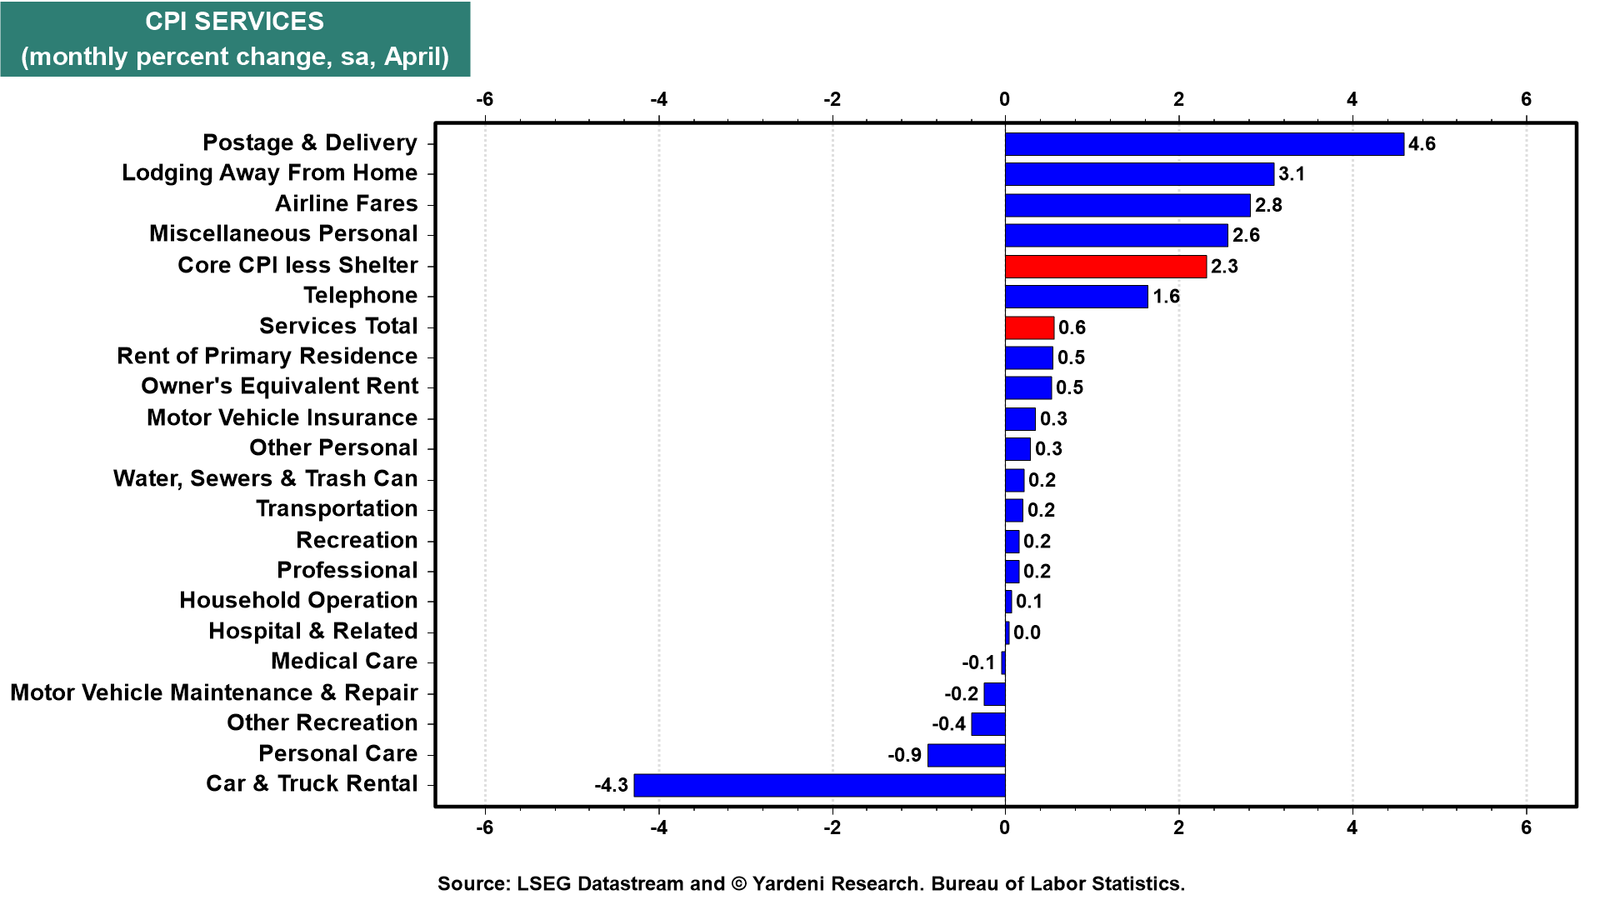
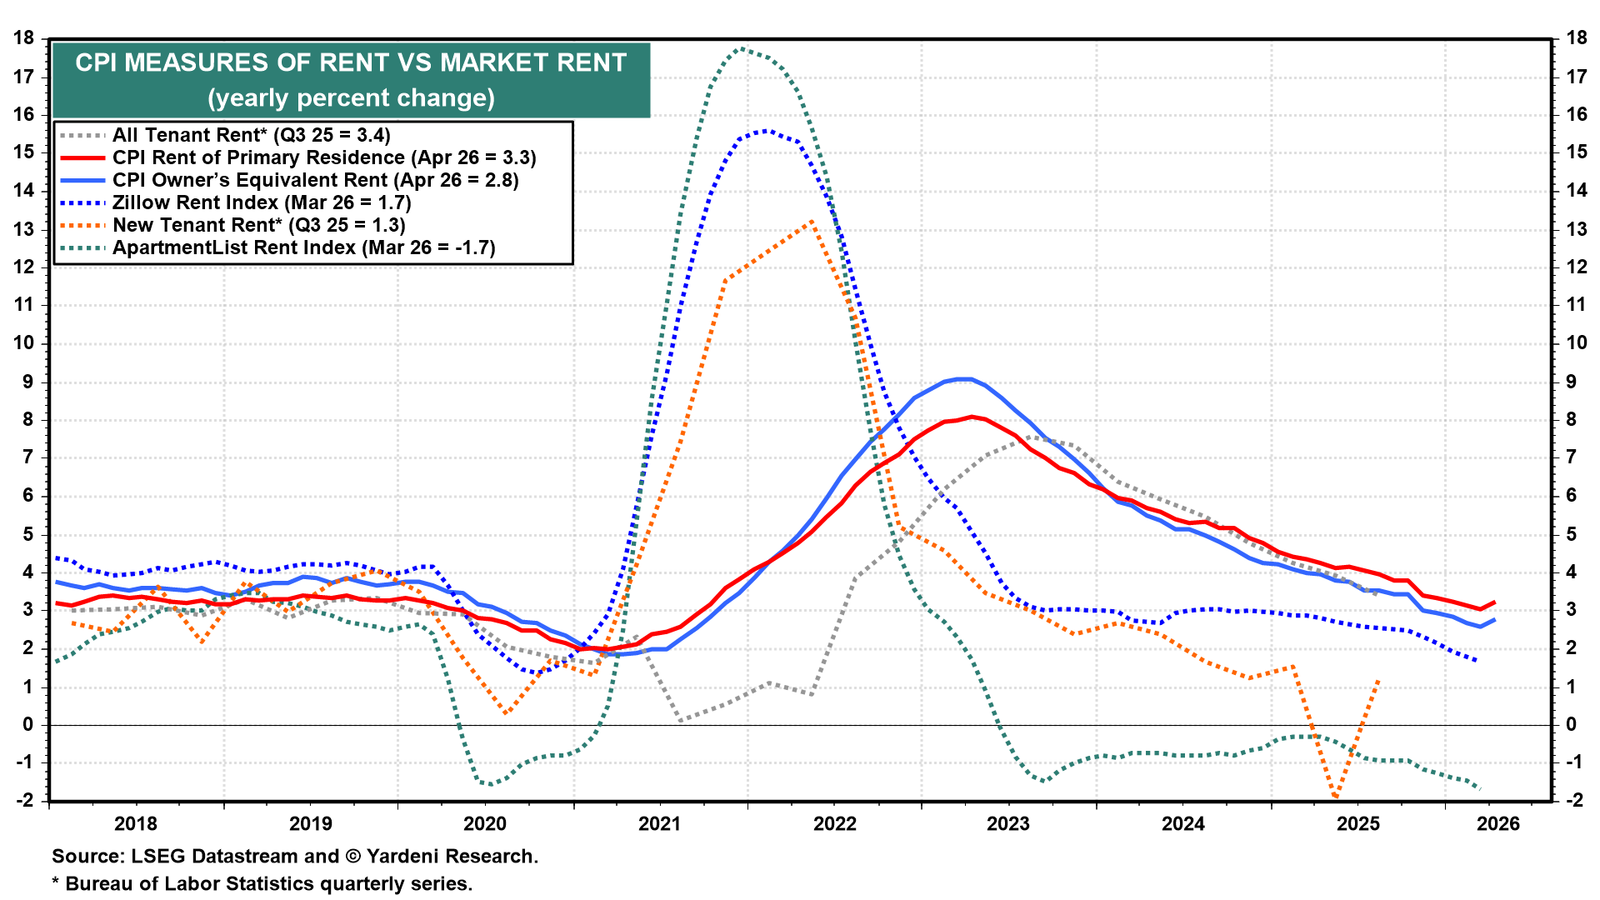
The April rent jump was likely a one-shot anomaly. During the 47-day government shutdown, the Bureau of Labor Statistics (BLS) didn't collect rent data and assumed zero shelter inflation for October. Since the BLS resurveys the same units every six months, the missing data was reconciled in April, producing a one-time catch-up spike. The effect is expected to reverse in the coming months, with market rents indicating continued moderation (chart).
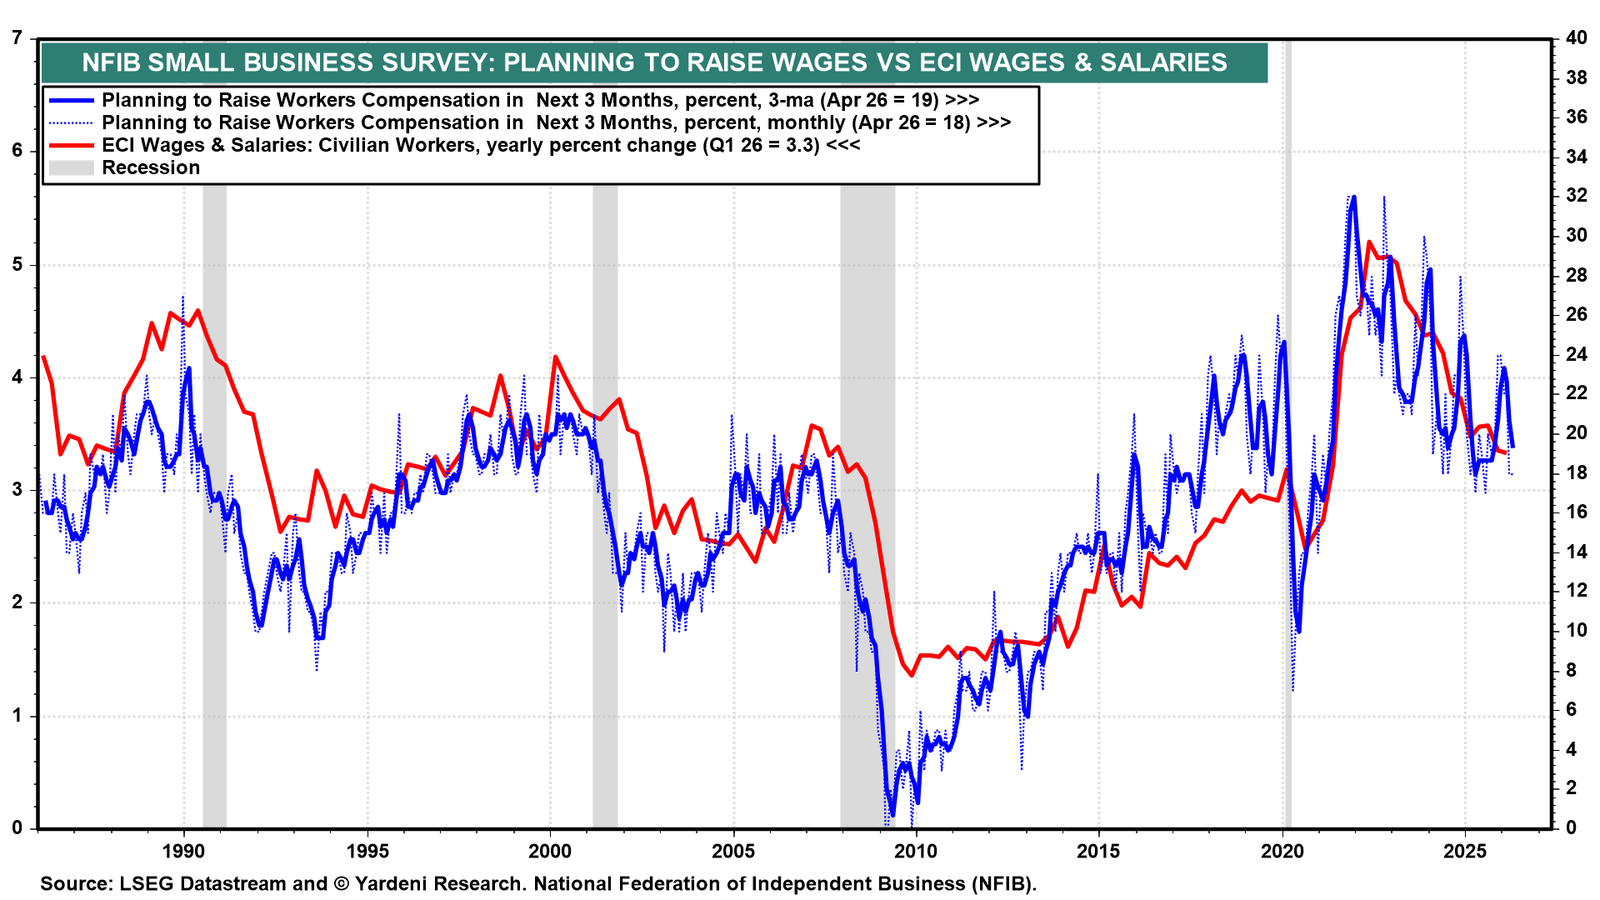
(4) Wages. The latest NFIB survey confirms that pressures to raise wages remain low. The percentage of small business owners planning to raise workers' compensation eased to 19% on a three-month average basis in April, well below the 2022 peak of around 32% (chart). The Employment Cost Index for wages and salaries decelerated to 3.3% y/y in Q1-2026 and is likely to remain subdued.
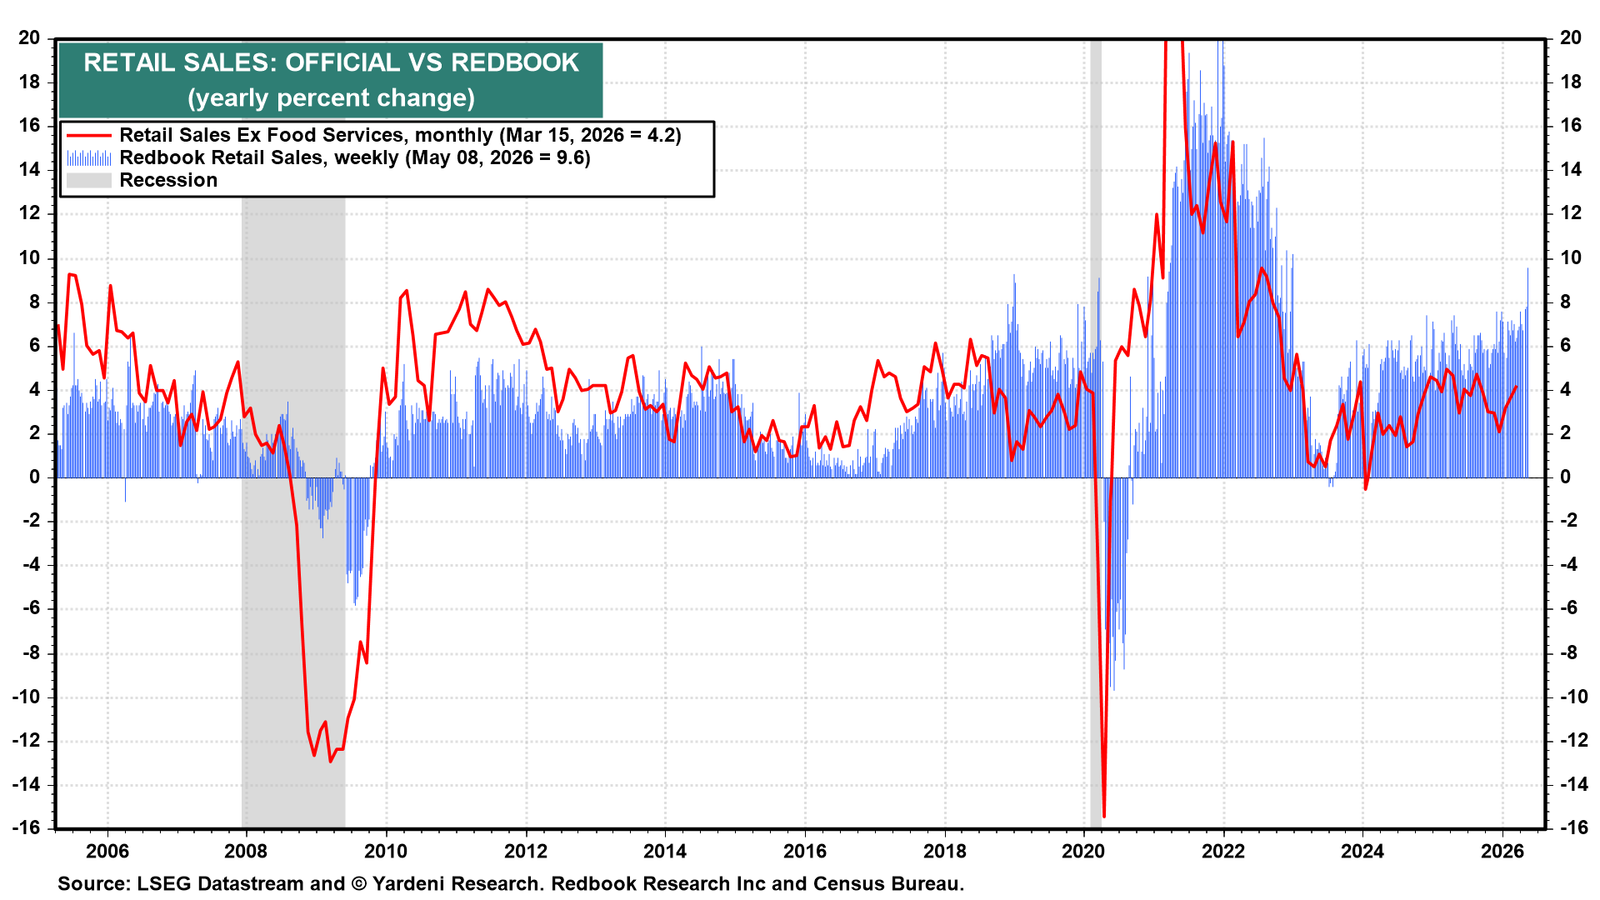
(5) Real wages. Real wages have been falling over the past couple of months as energy prices soared. Average hourly earnings rose by 3.6% y/y in April, and headline CPI inflation increased by 3.8% that month. Yet, consumer spending remains resilient. The Redbook same-store retail sales index rose 9.6% y/y in the week ending May 9. That is the strongest growth rate since late 2021 and a sharp jump from the 7.8% increase the previous week (chart). The Redbook measure excludes gas station sales.
We see three forces driving consumer spending: Retired Baby Boomers drawing down their net worth, young adults receiving financial support from their parents, and an unusually strong tax refund season.