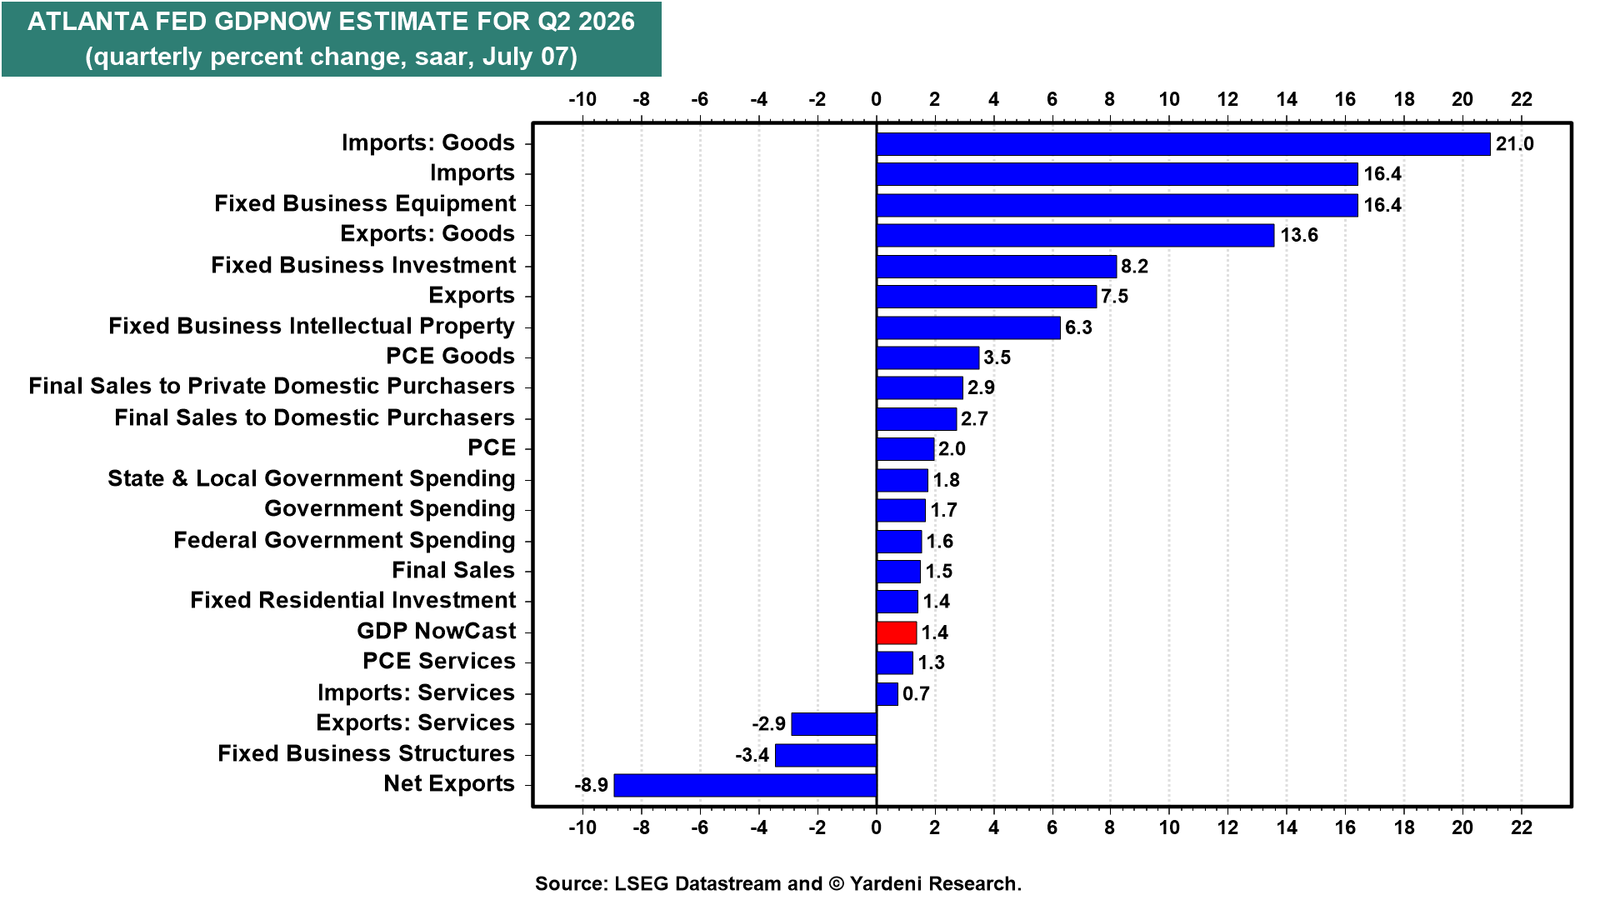
The Atlanta Fed's GDPNow model estimates Q2-2026 real GDP growth at just 1.4% (saar). That's because net exports (i.e., exports minus imports) dragged it down by 1.3 ppt. During the quarter, AI-related imports increased sharply, outpacing the large increase in US exports of crude oil and petroleum products.
The picture is brighter below the headline number. Real final sales to private domestic purchasers, which strips out volatile trade and inventory swings, is tracking at 2.9%, up from 1.7% in Q1-2026 (chart). Consumer spending growth is projected at 2.0%, a sharp rebound from 0.5% in Q1, and business fixed investment is running at 8.2%, up from 6.5%.
A closer look at the recent economic data reveals what is driving the Q2 GDP estimate and hiding the underlying strength of the economy:
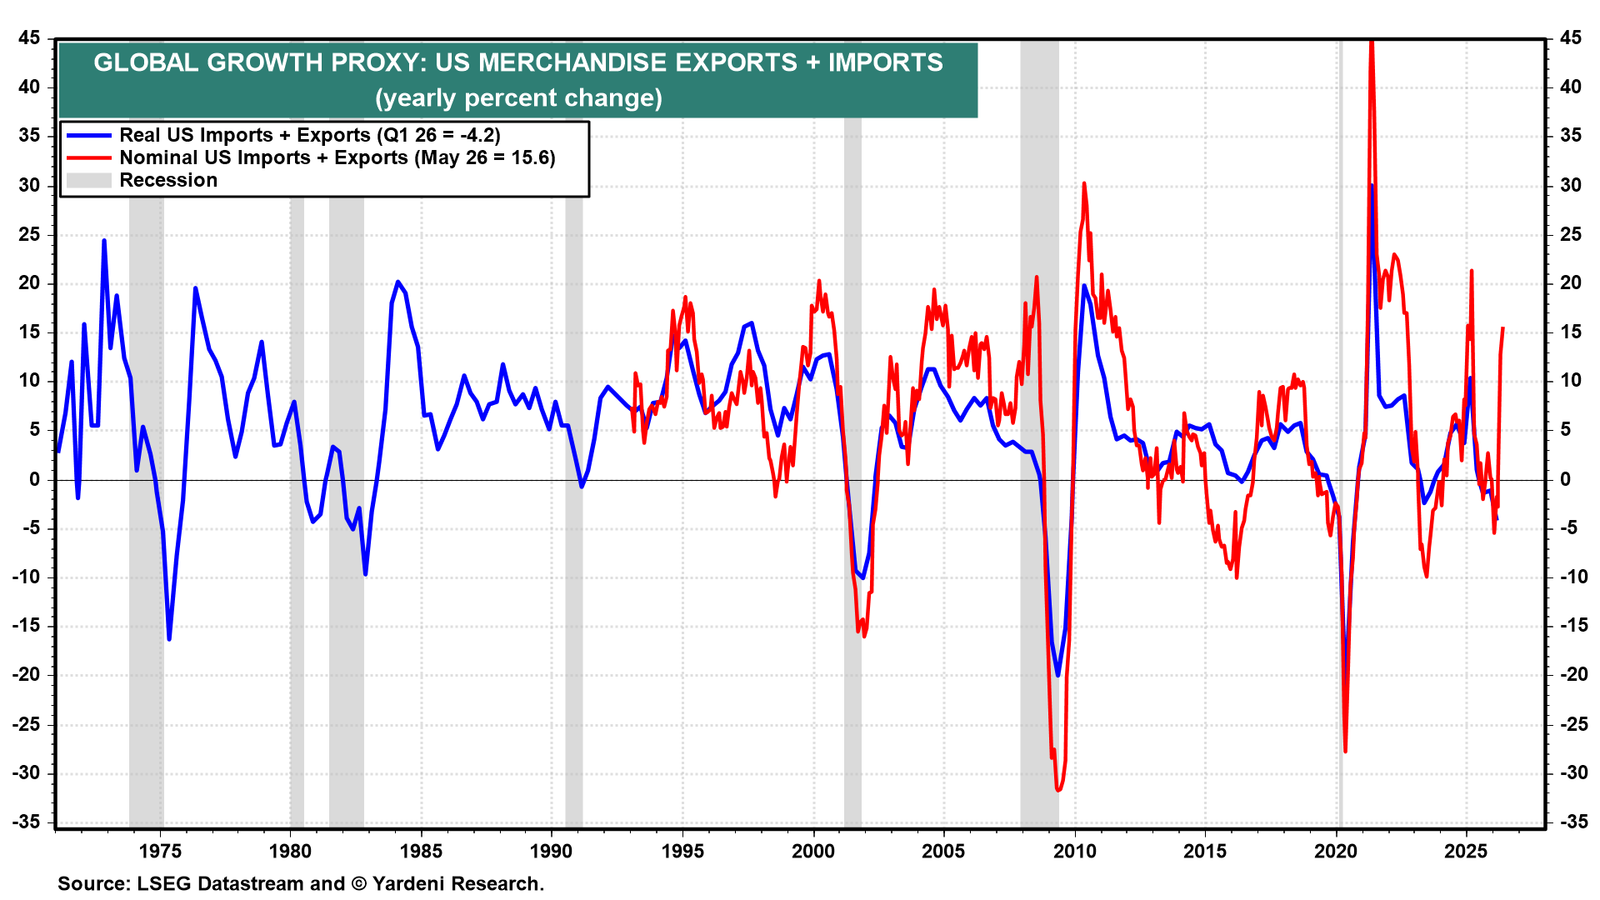
(1) US Merchandise Trade. The sum of US merchandise imports and exports is a good proxy for global economic activity because the US is the world's largest importer and a major exporter. At an increase of 15.6% y/y in May, our proxy is flashing a positive signal for the global economy (chart).
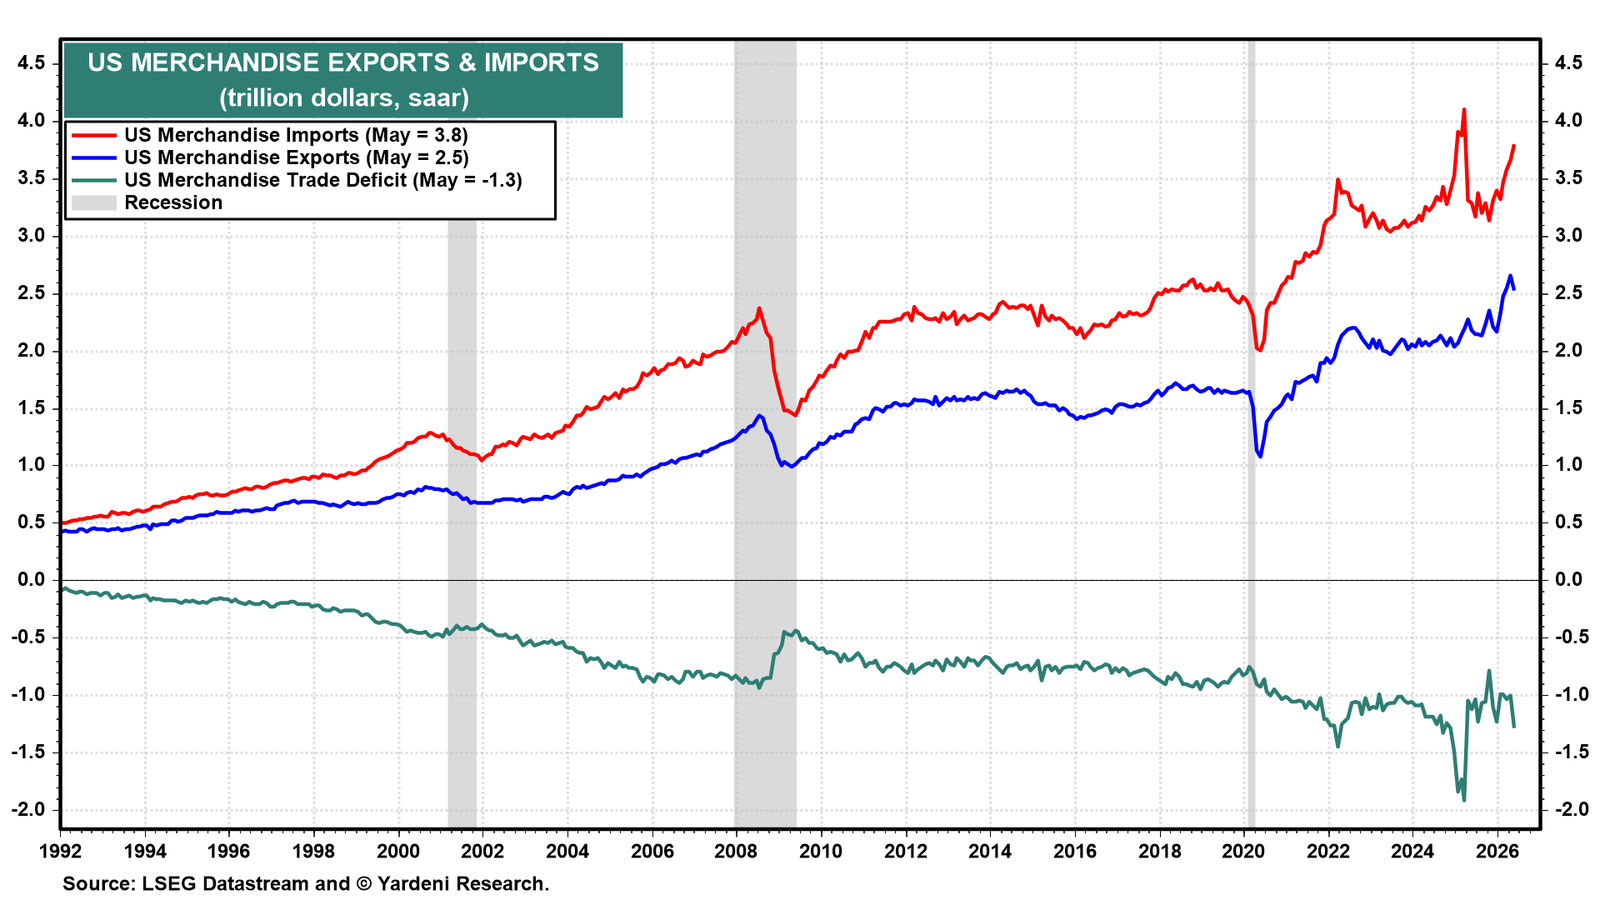
US merchandise imports have been soaring in recent months, reflecting the AI-driven demand for technology capital goods (chart). They have outpaced surging US merchandise exports, which have been led by exports of crude oil and other petroleum products.
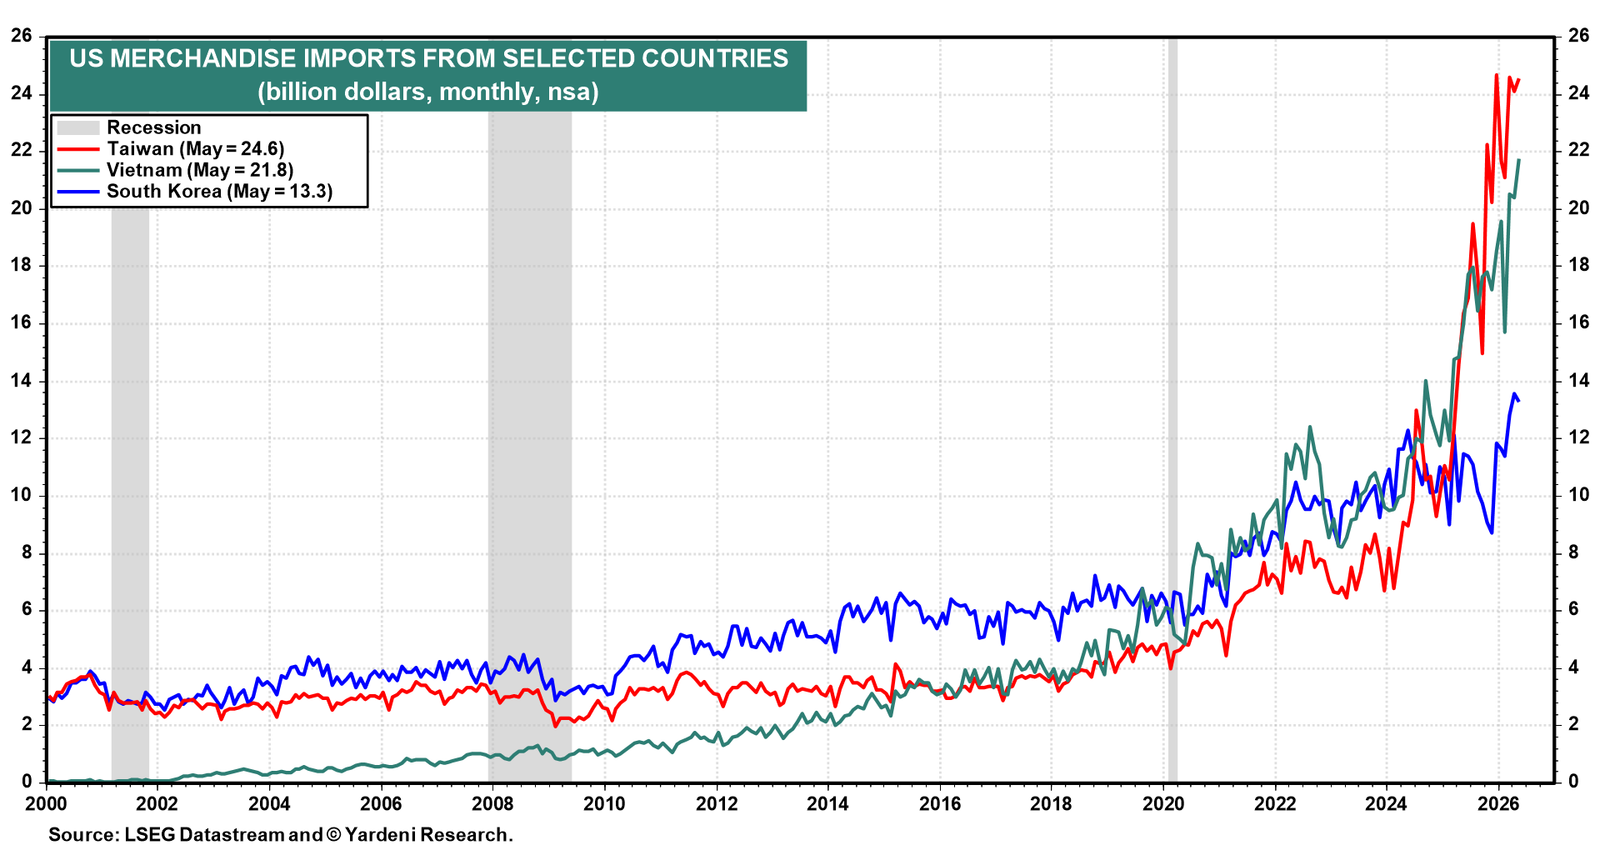
The import surge is concentrated in the three Asian countries at the heart of the global AI supply chain. Taiwan supplies the advanced semiconductors that power AI chips, South Korea dominates memory chip production, and Vietnam has emerged as a critical assembly hub for AI servers, computers, and smartphones as US tech companies have diversified supply chains away from China (chart).
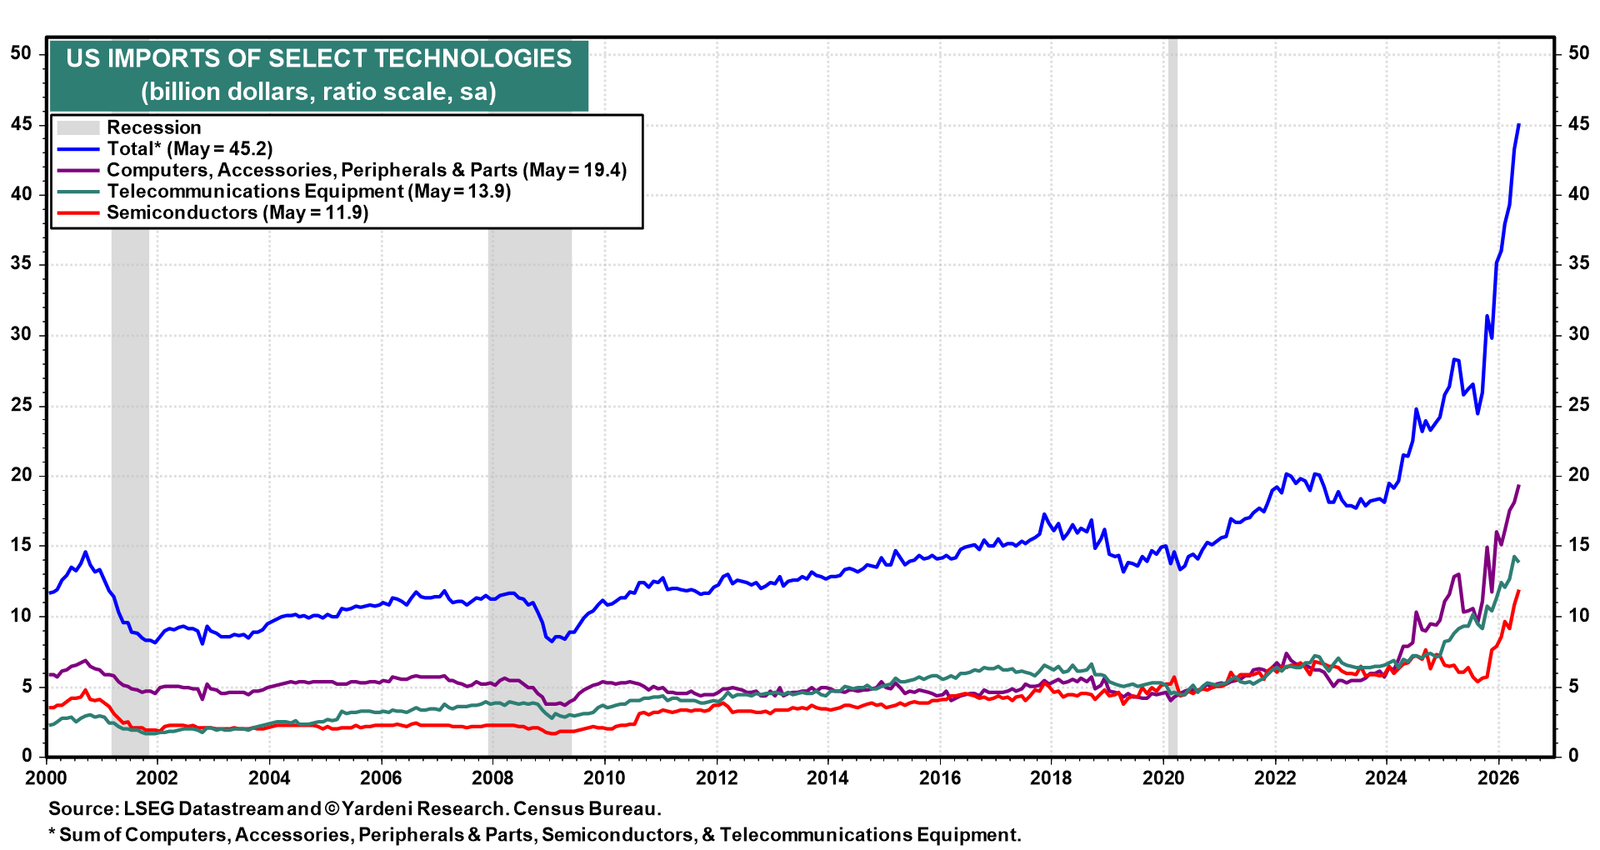
US high-tech imports have more than doubled since early 2024 (chart).
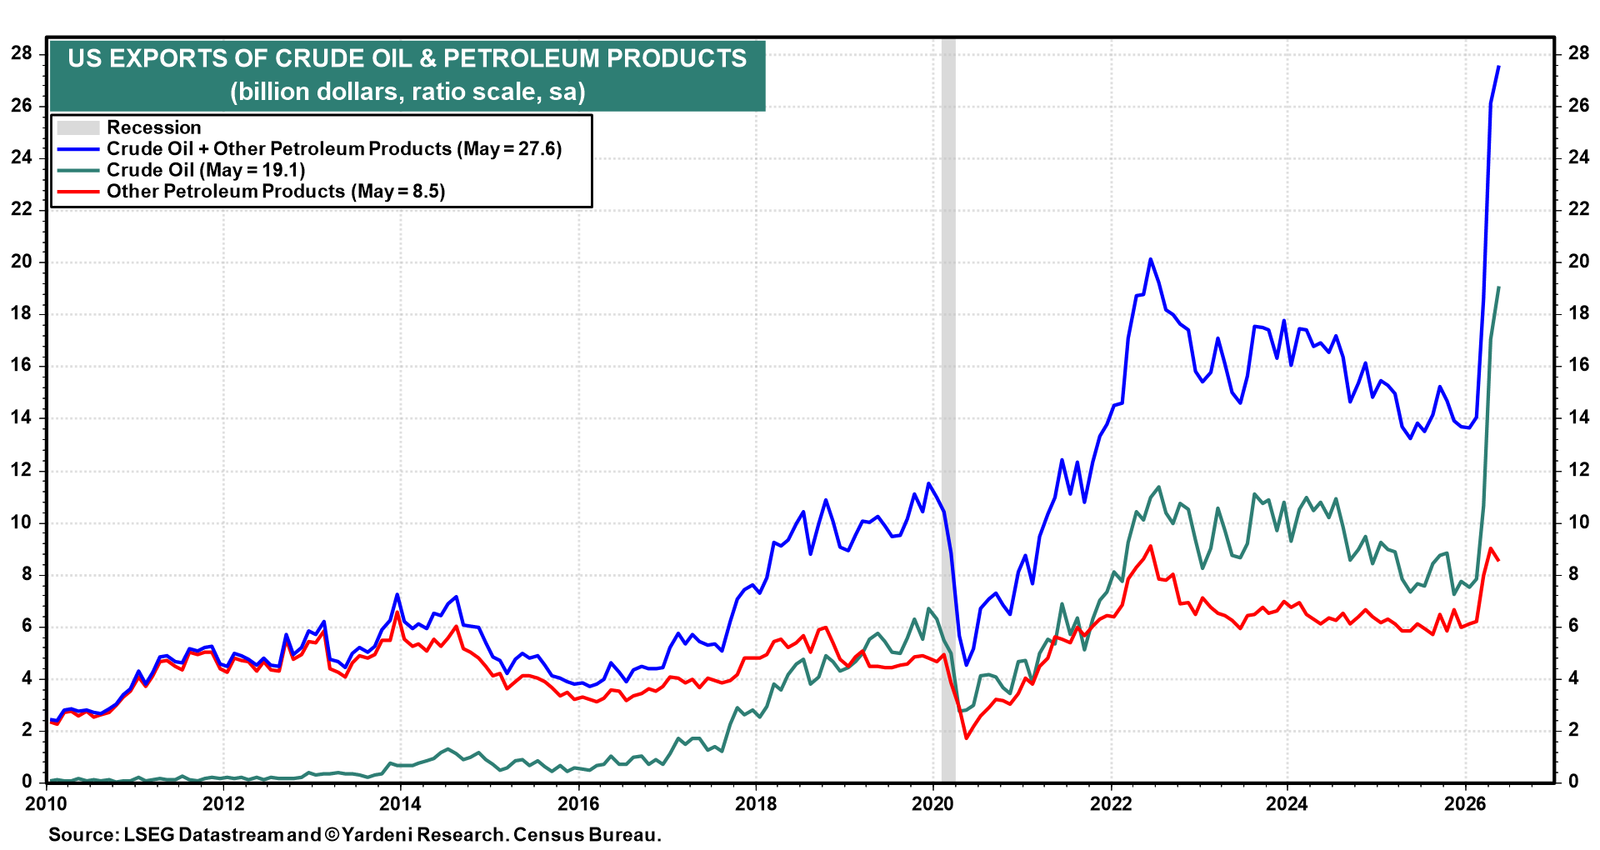
US crude oil and petroleum exports hit a record $27.8 billion in May as Middle East supply disruptions pushed global buyers toward reliable US oil exporters, providing a recent offset to the AI-driven import surge.
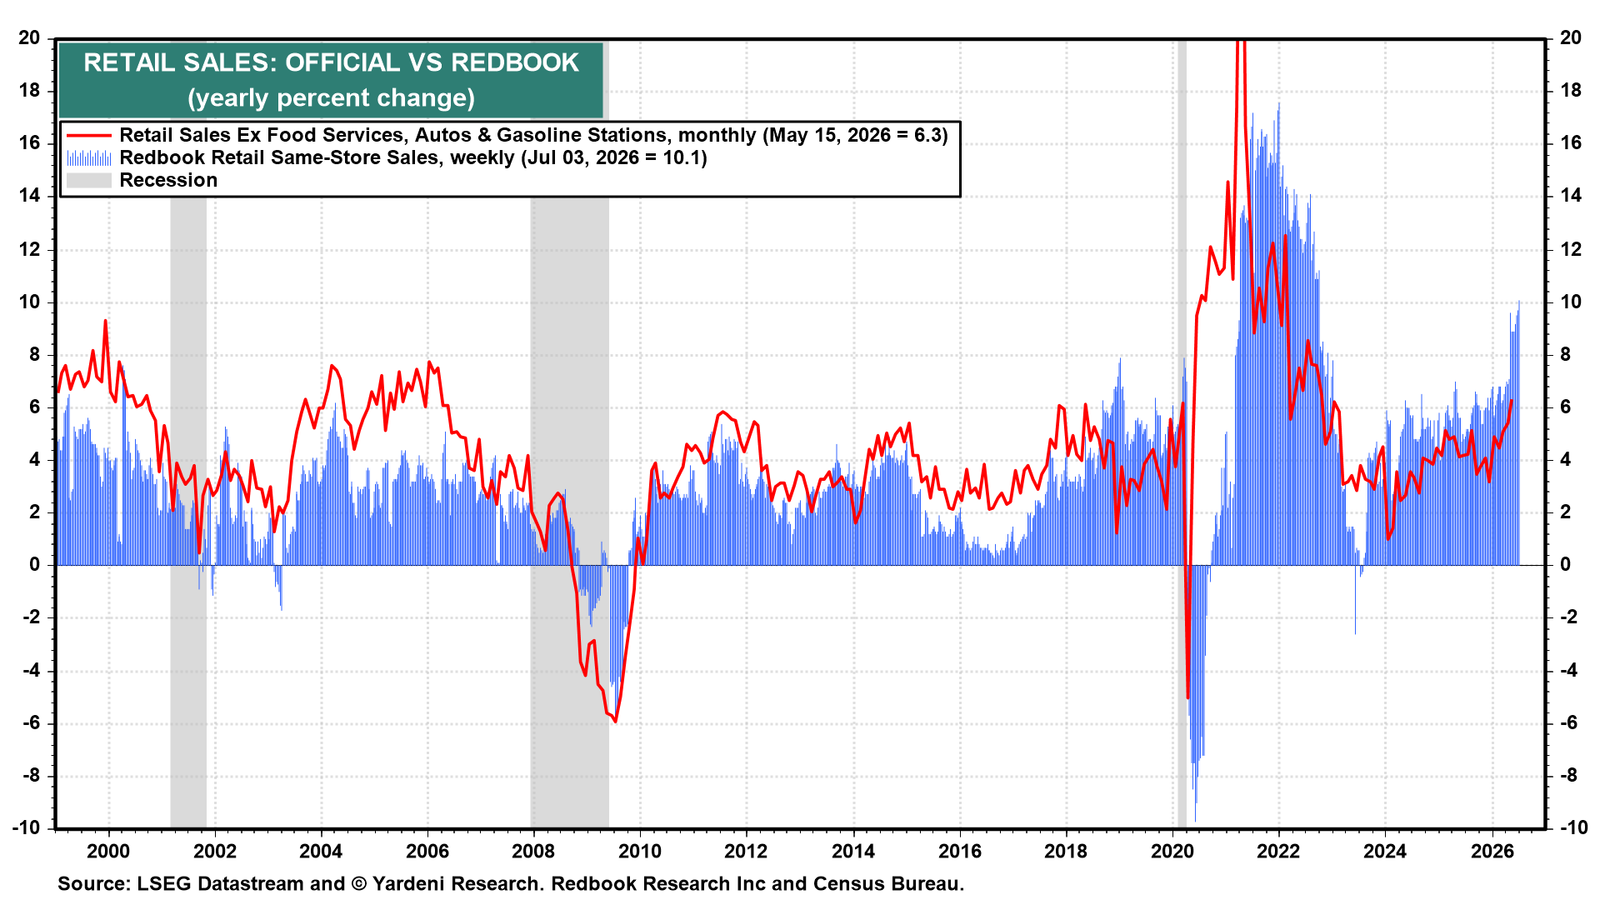
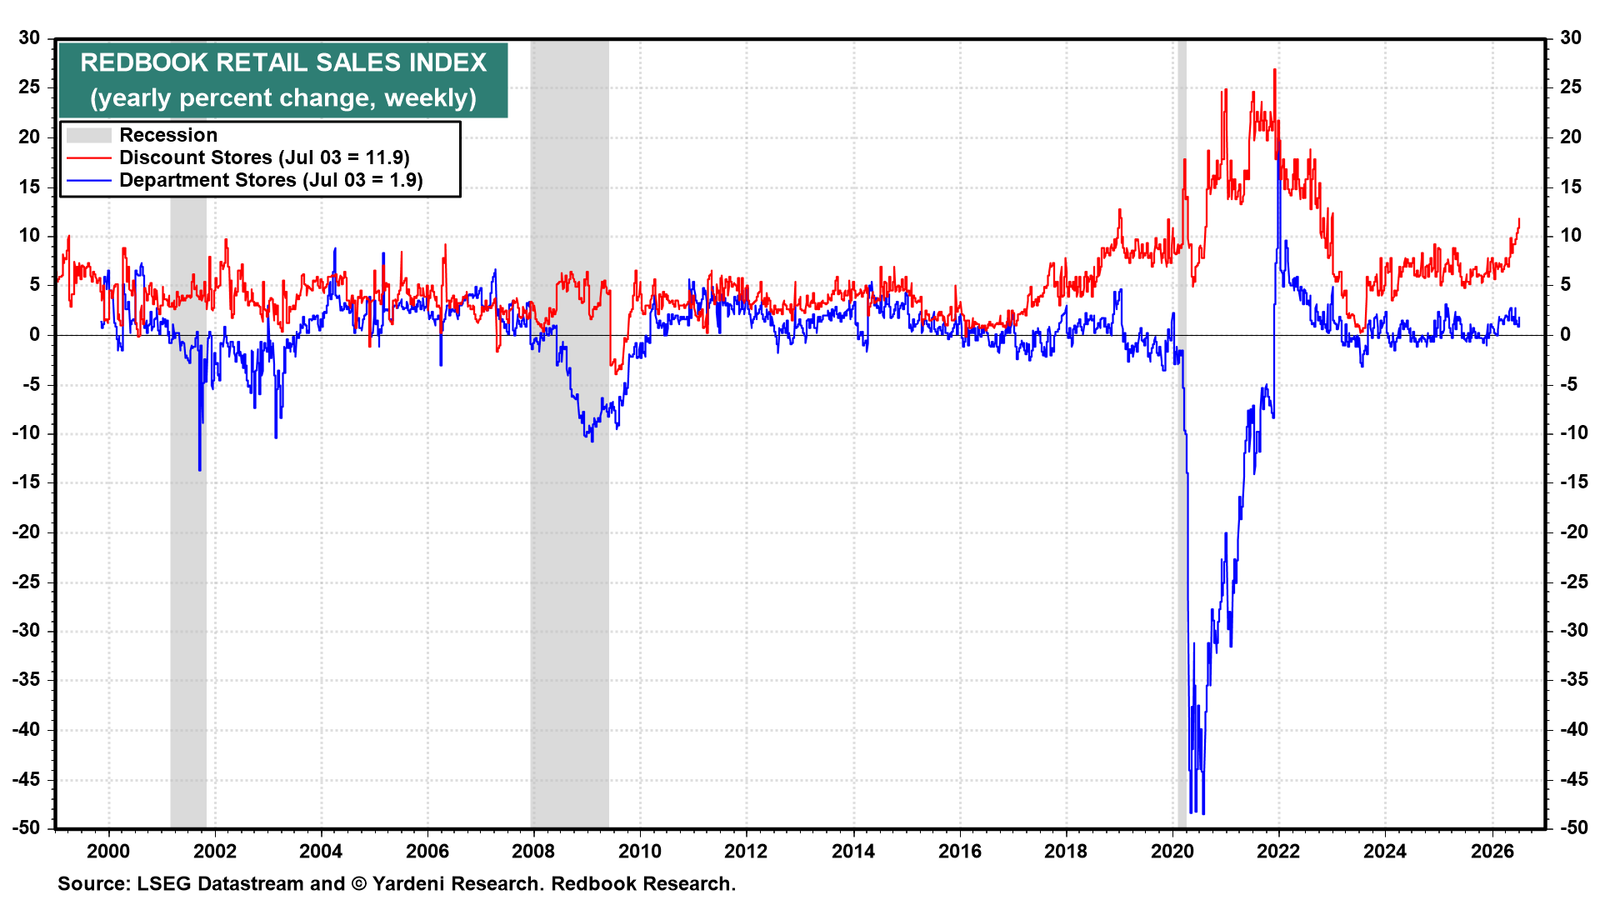
(2) US Consumer. Consumer spending remains remarkably robust. The Redbook Same-Store Retail Sales Index rose 10.1% y/y for the week of June 26, the highest growth rate since September 2022 (chart). June and July retail sales reports are likely to be very strong! The World Cup might have contributed to this strength.
Sales at discount stores rose 11.9% y/y (chart). These retailers should report very strong sales for both Q2 and Q3.
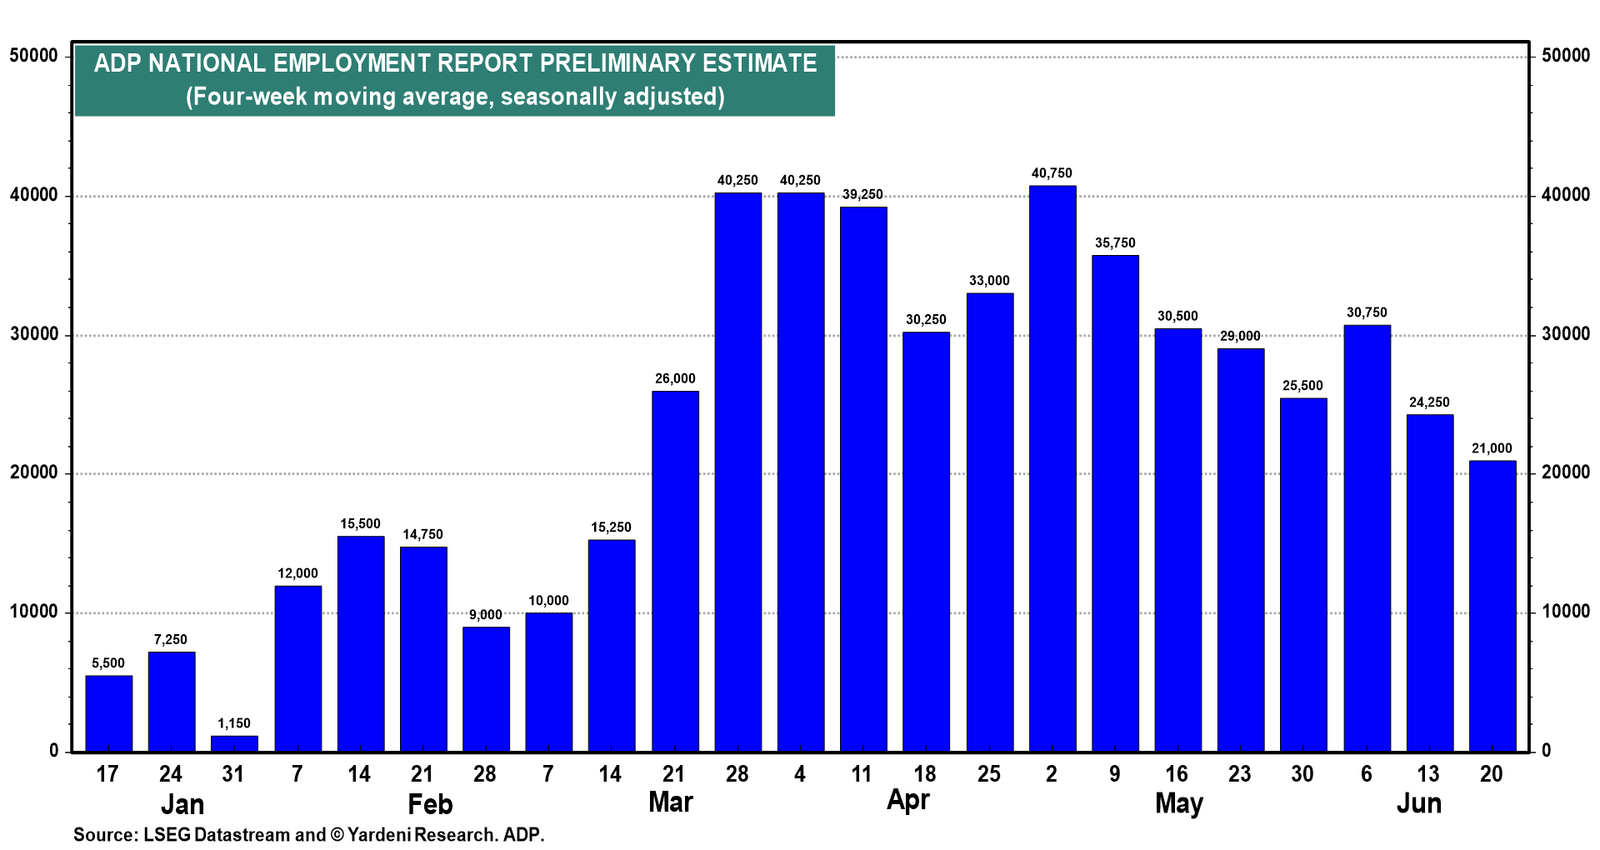
A key support for consumer spending is the labor market. ADP data show US private-sector employers added an average of 21,000 jobs per week in the four weeks ending June 20, slightly below the prior period’s 24,250 but consistent with a solid monthly pace of around 84,000 (chart).
June's preliminary NFIB small business survey corroborates this. Hiring demand rebounded after a soft patch in May, with 32% of owners reporting unfilled openings (up 3 percentage points) and a net 11% planning to add jobs over the next three months, in line with the long-term average.
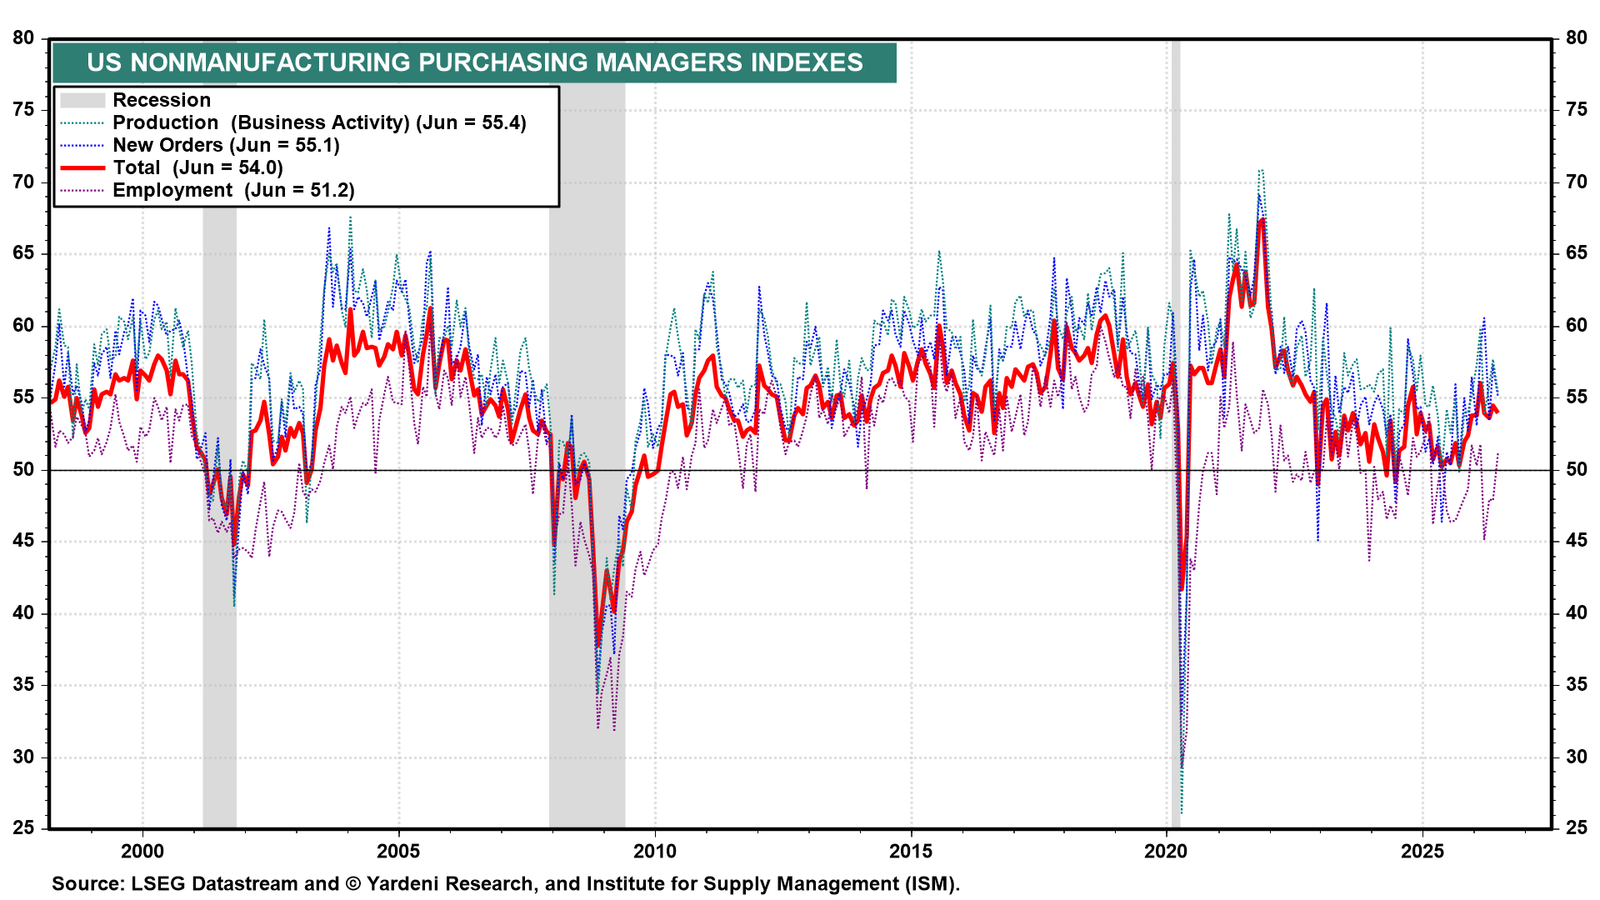
(3) PMIs. The NM-PMI eased slightly to 54.0 in June but remained firmly in expansion territory, with every subcomponent above 50, including employment, new orders, and production (chart).
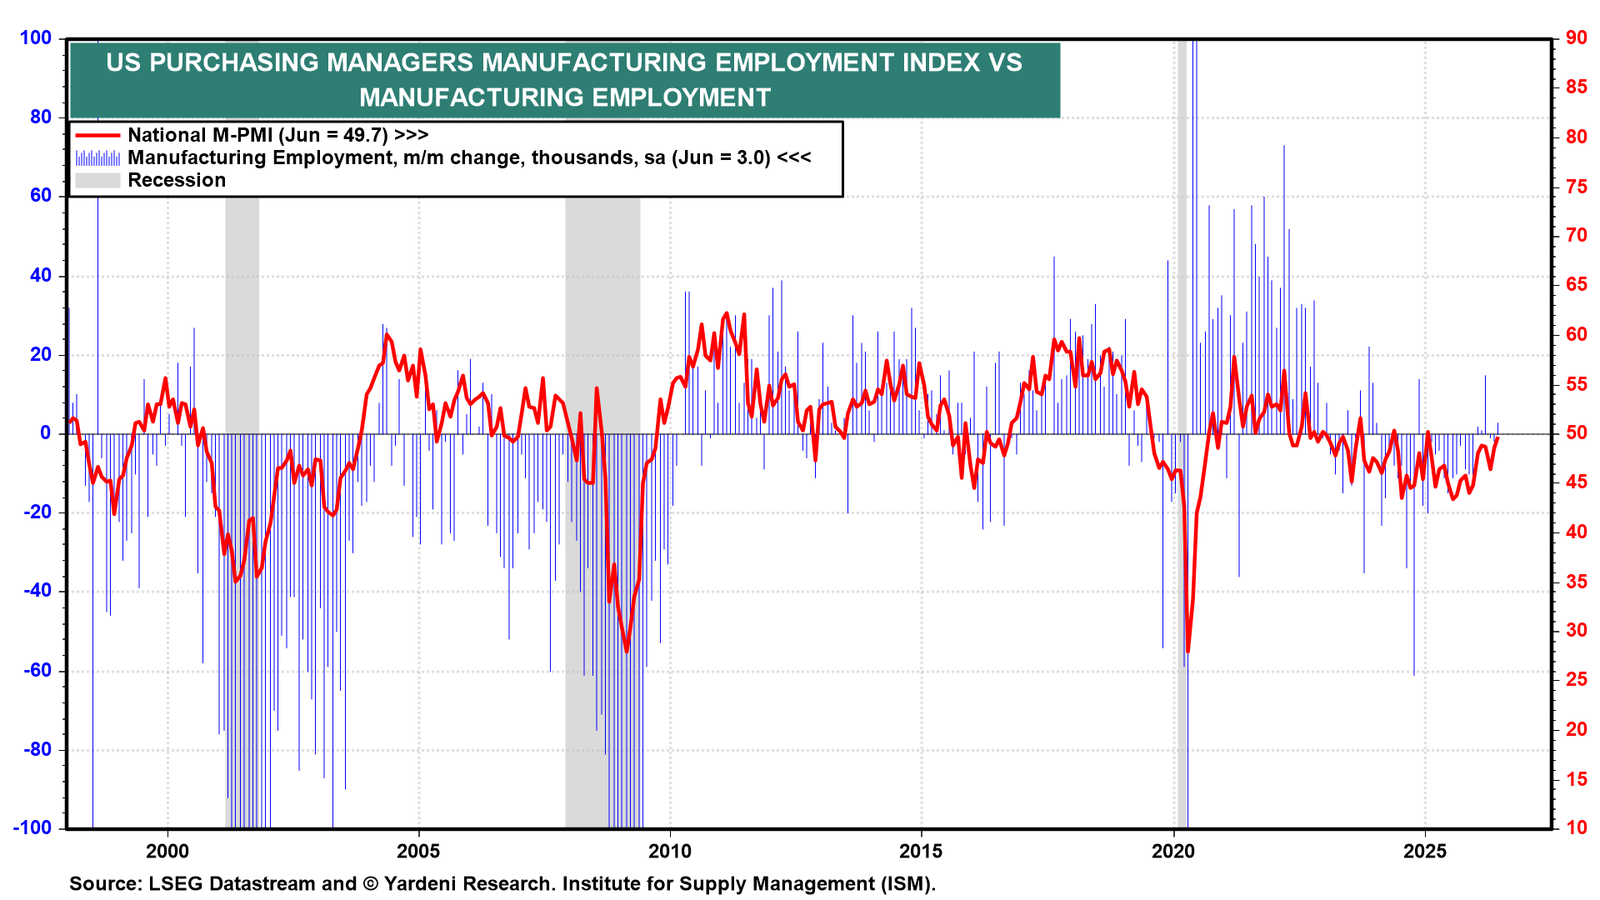
Meanwhile, the employment component of the M-PMI is on an upward trend, rising to 49.7 in June (chart). The measure historically has correlated well with manufacturing payroll growth, which has also improved this year. The AI buildout should keep that trend intact, as data center construction, semiconductor reshoring, and surging demand for power infrastructure require a growing manufacturing workforce.
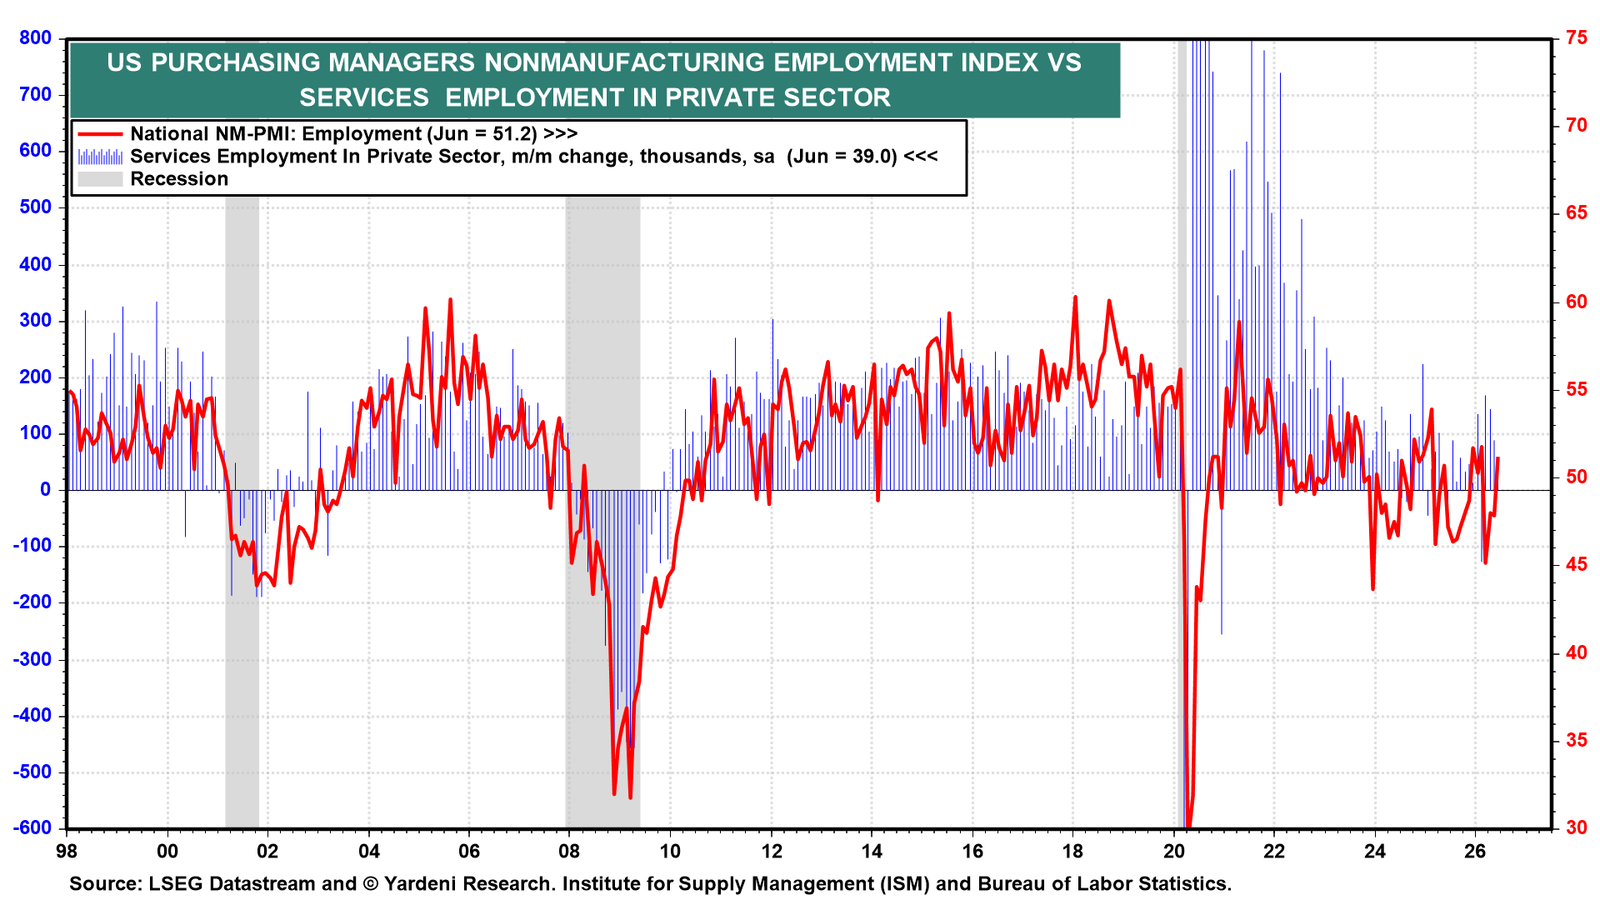
The employment component of the NM-PMI has been less directionally clear but was above 50.0 in June, consistent with gains in services sector payrolls (chart).
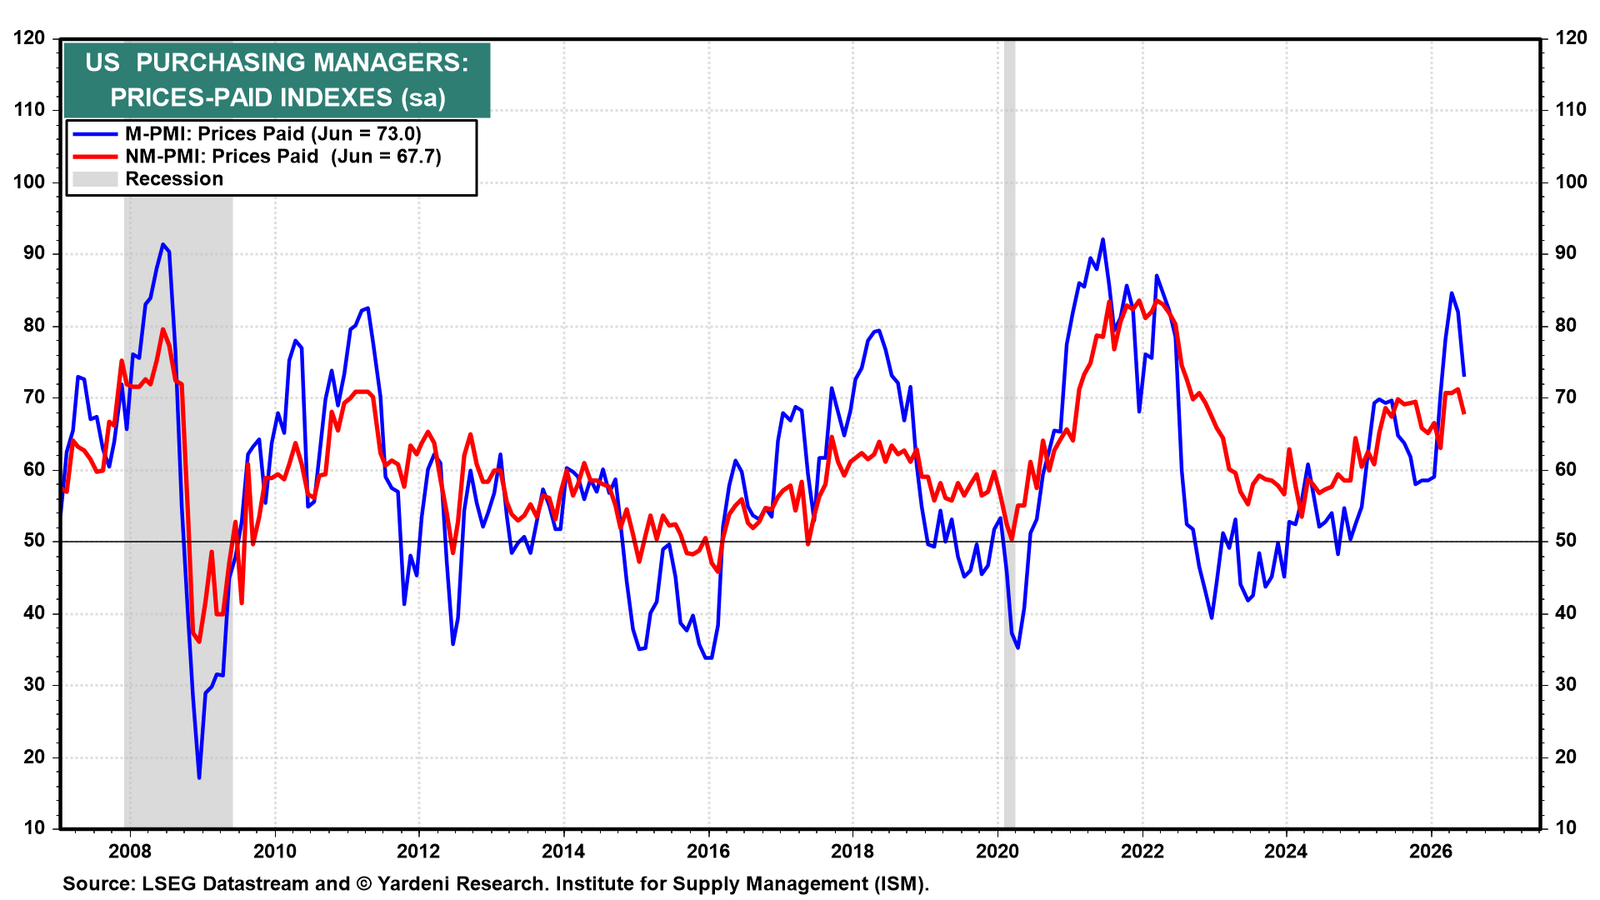
(4) Inflation. Price pressures in both manufacturing and services have moderated as oil prices retreated to pre-conflict levels. Even so, June's prices paid components of both PMIs remain elevated, confirming that pipeline price pressures are far from over (chart).
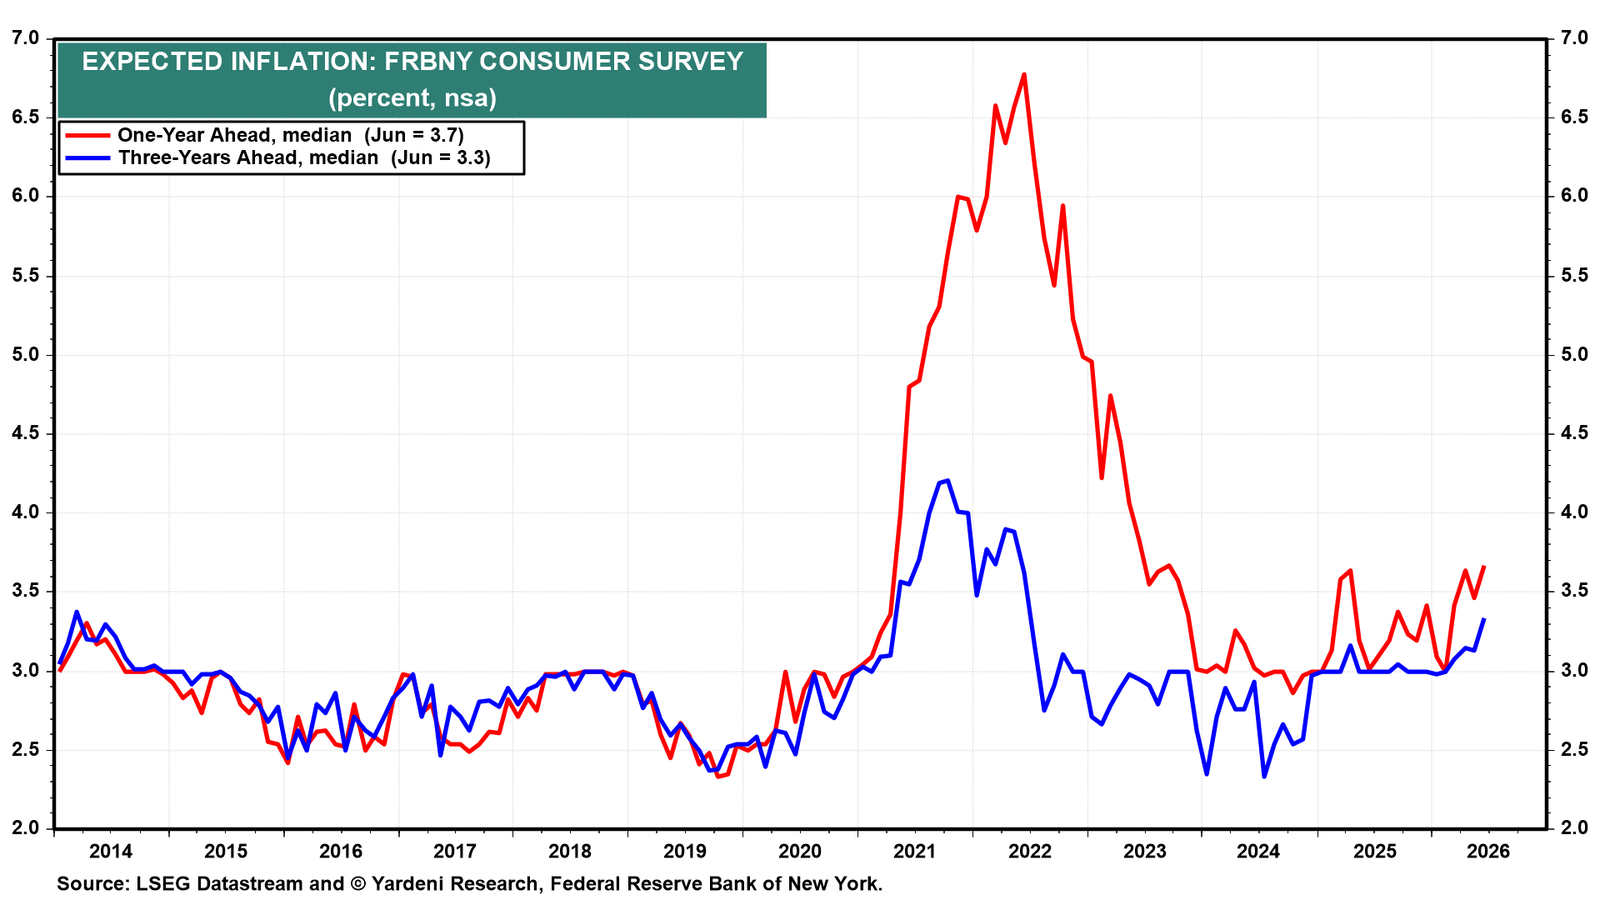
The New York Fed's June Survey of Consumer Expectations showed one-year inflation expectations rising to 3.7%, the highest since September 2023, while three-year expectations climbed to 3.3%, the highest since June 2022 (chart). The drift higher at both time horizons reinforces our conviction that the Fed must maintain a hawkish policy stance, as the upside risks to inflation continue to outweigh the downside risks to the labor market.