During the Napoleonic Wars, British financier Nathan Mayer Rothschild allegedly said: "Buy on the sound of cannons, sell on the sound of trumpets." This has become a legendary contrarian investing maxim. It suggests you should buy stocks when war or panic causes markets to plummet ("cannons"), and sell to lock in profits when peace returns and market euphoria sets in ("trumpets").
The maxim seems to be working again. The latest Gulf War started on February 28. It ended on April 8, when the US and Iran signed a Memorandum of Understanding. The S&P 500 tumbled during March, but bottomed on March 30. That selloff provided lots of great buying opportunities. The index rose to a record high on June 2.
It has been a sea of red across global stock markets since then through Friday's close, despite the opening of the Strait of Hormuz and the plunge in oil prices in June. Consider the following:
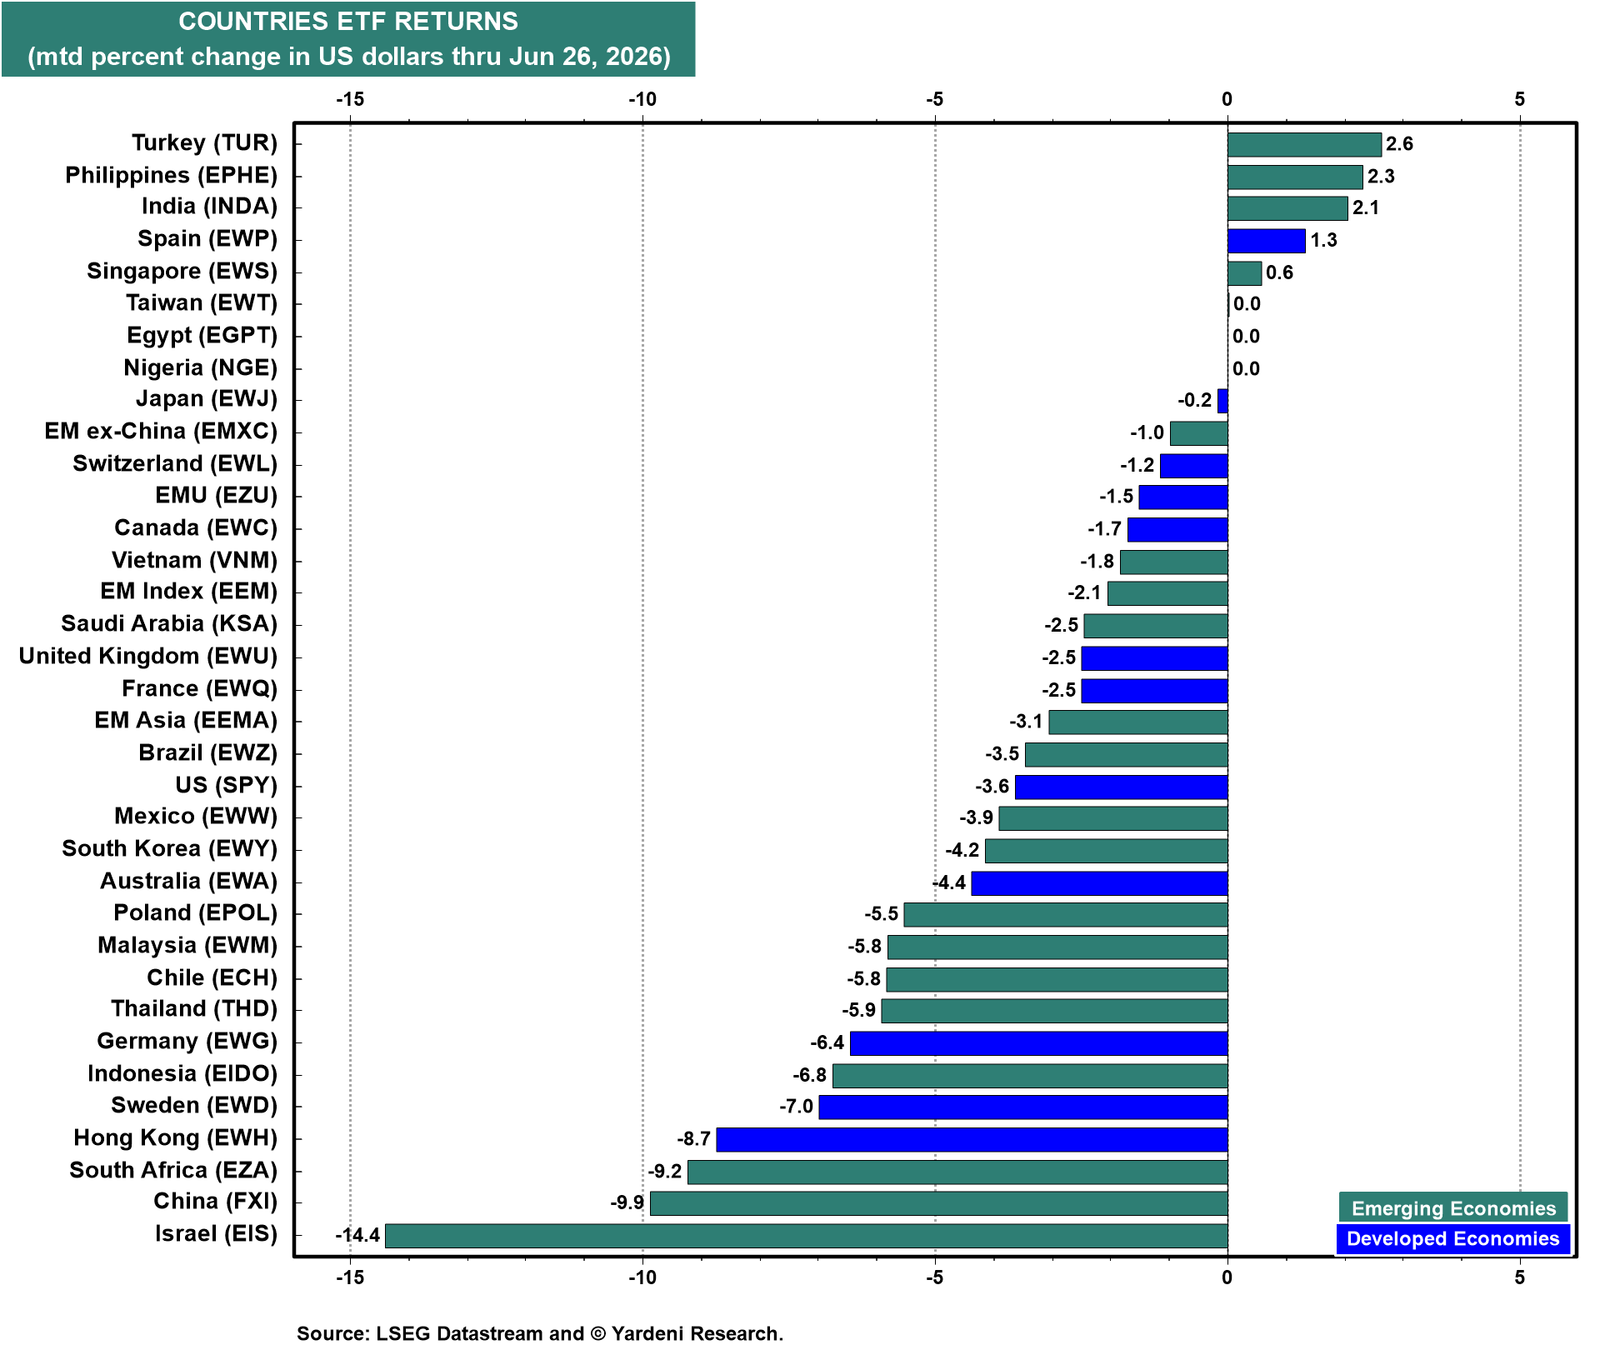
(1) June Swoon. The country ETF panel was a wipeout in June, with only Turkey, the Philippines, India, Spain, and Singapore with gains (chart). China continued to lag, with a 9.9% drop. South Korea gave back 4.2% after May’s surge. EMXC was down 1.0%, while EEM fell 2.1%. Both beat the US SPY, which fell 3.6%.
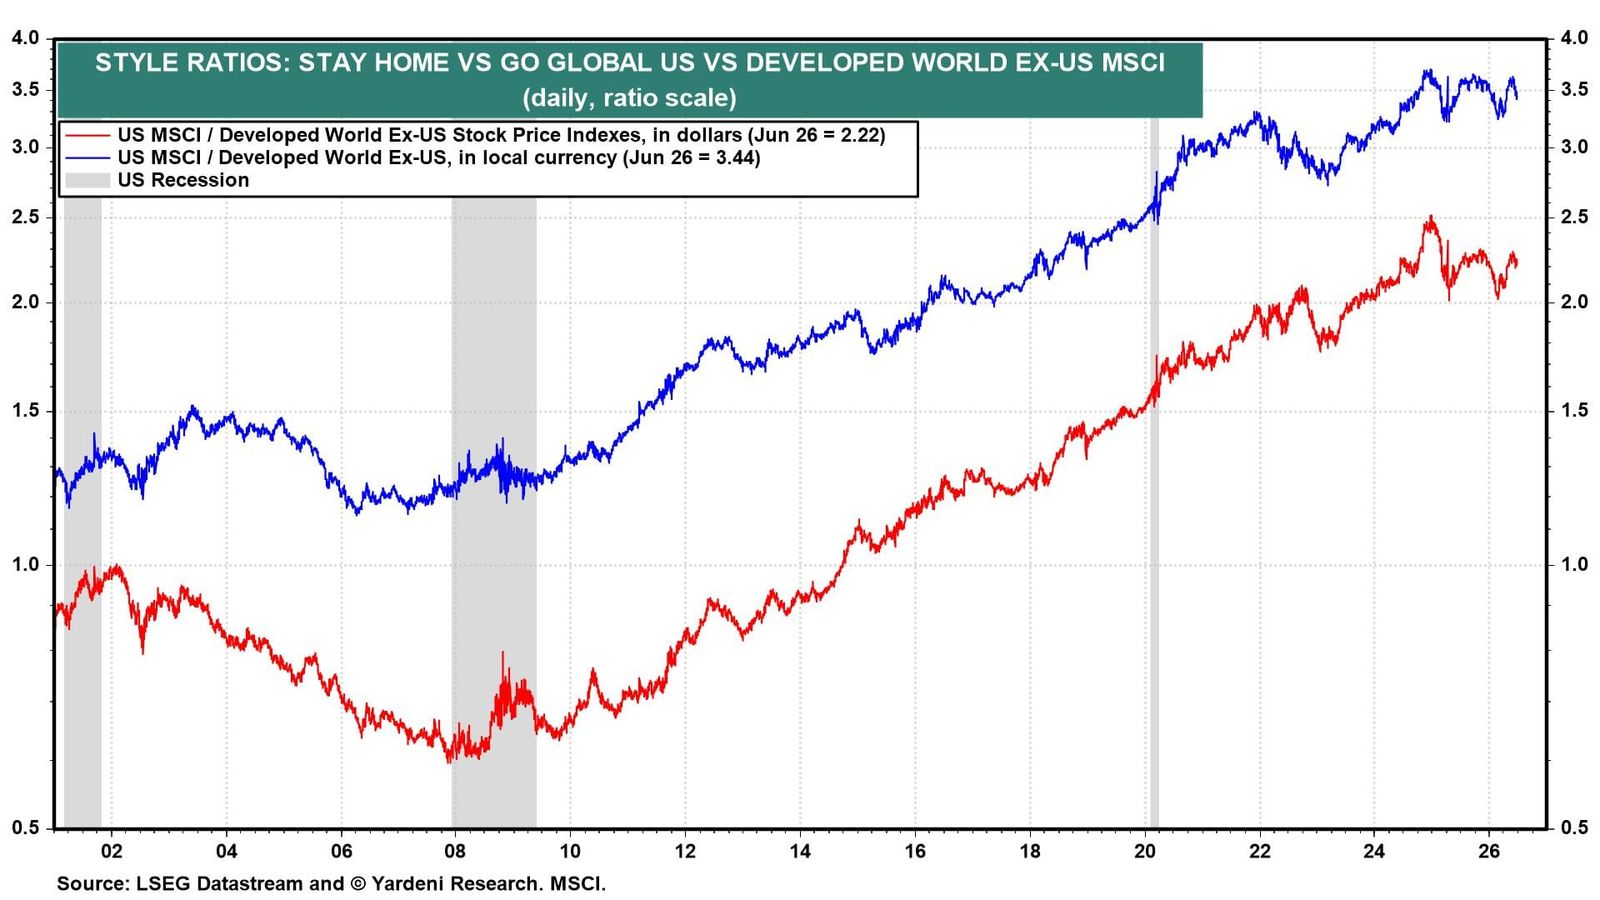
(2) Stay Home vs Go Global. The ratios of the US MSCI to the Developed World ex-US MSCI edged down last week (chart). They were on steep uptrends from 2010 through 2024. But they have been stalled since early 2025.
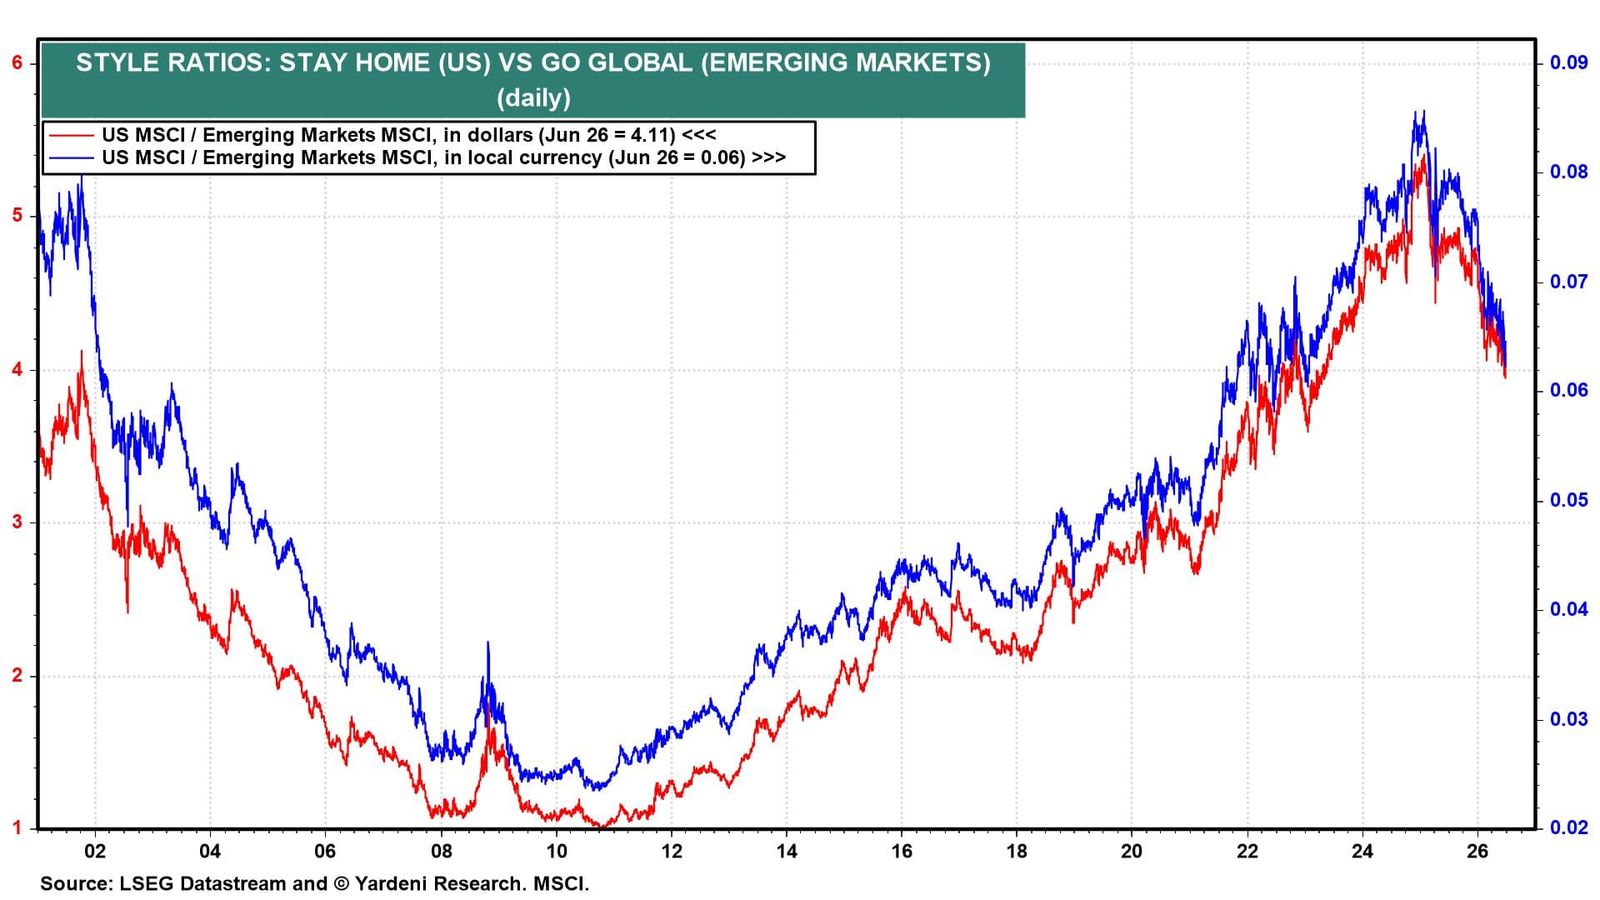
The ratios for the US MSCI to the Emerging Markets MSCI were also on long-term uptrends from 2011 through 2024 (chart). But they have both been falling since then.
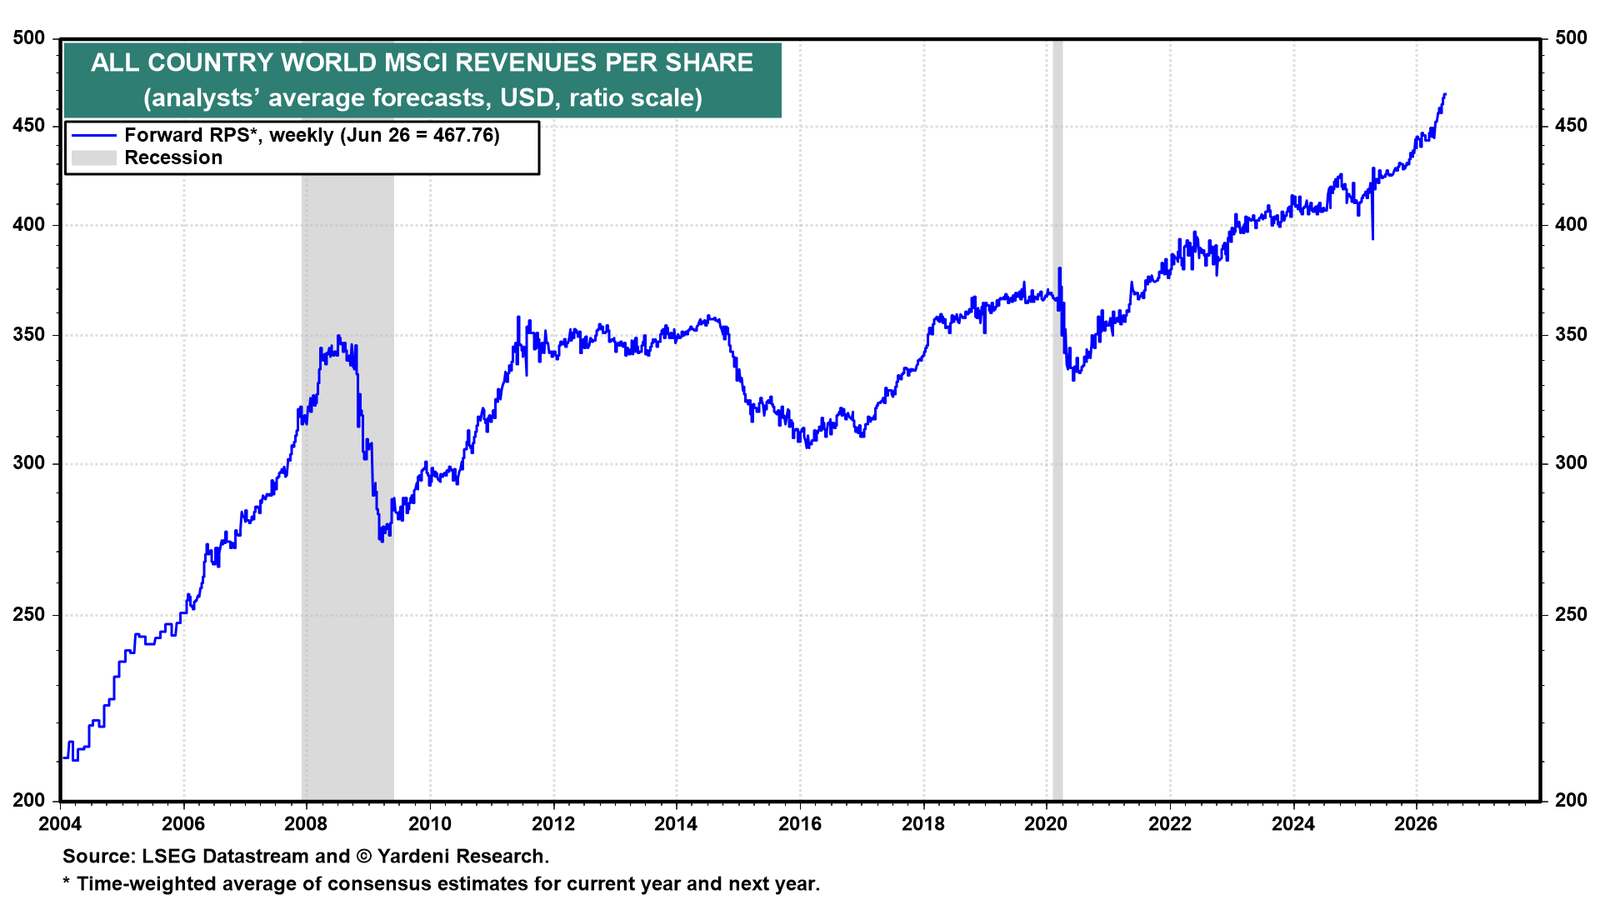
(3) Revenues & earnings. The global economy is growing faster this year, according to the ACW MSCI. Its forward revenues rose to a record high last week (chart). The inflationary consequences of the war might have provided a boost to global revenues, which nonetheless appear resilient.
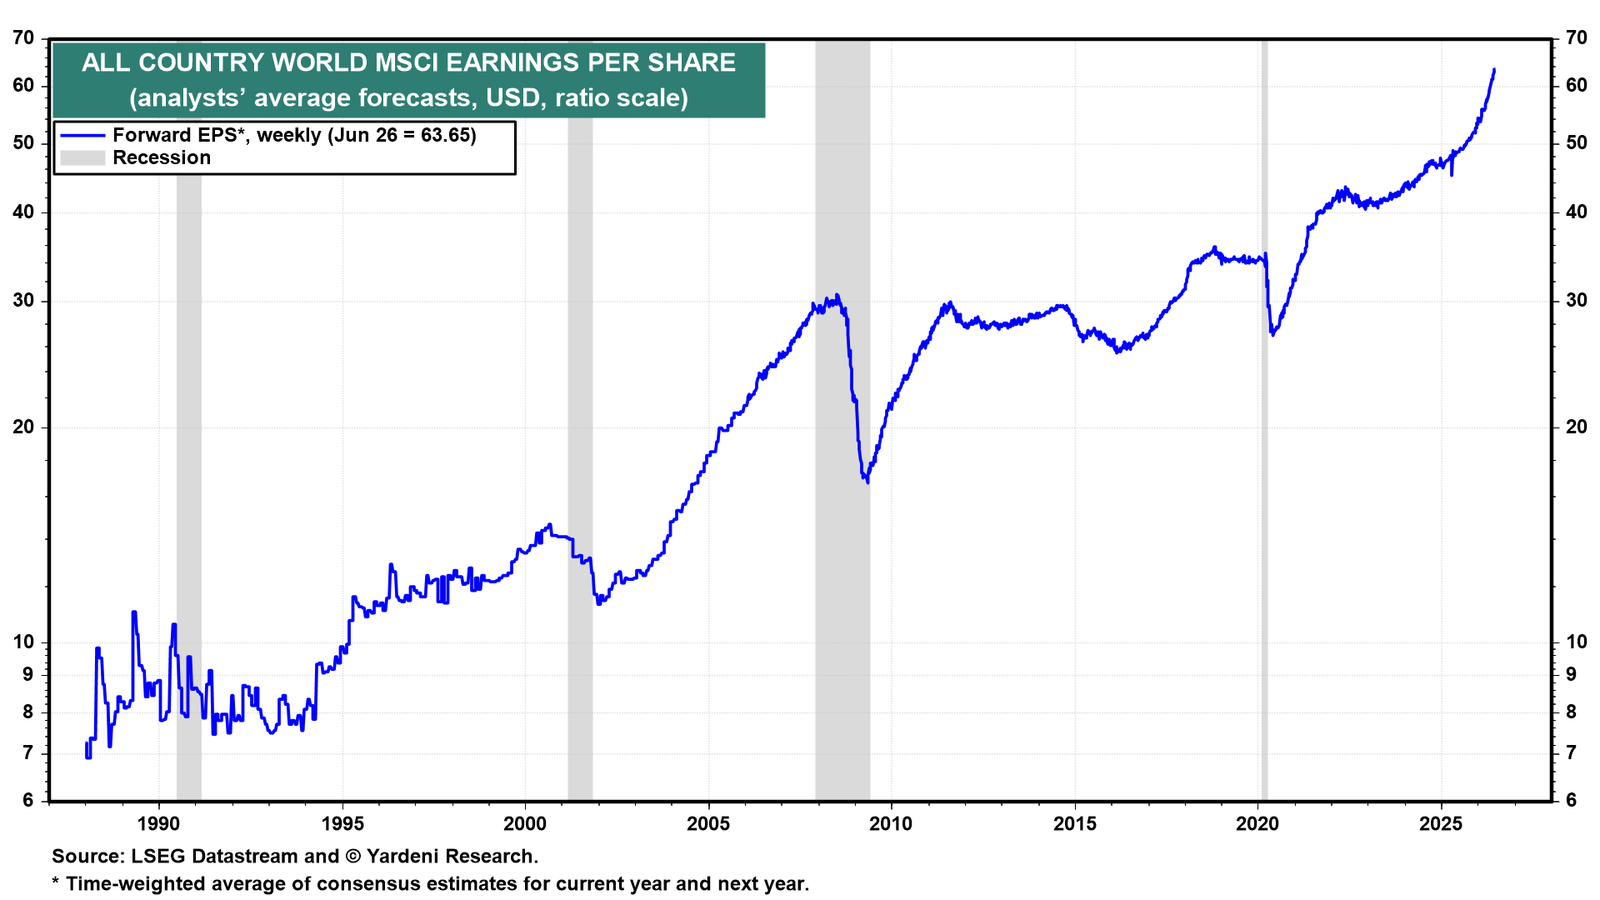
The ACW MSCI's forward earnings per share also reached a new high last week (chart). Information Technology has been leading the charge thanks to the global AI spending boom.
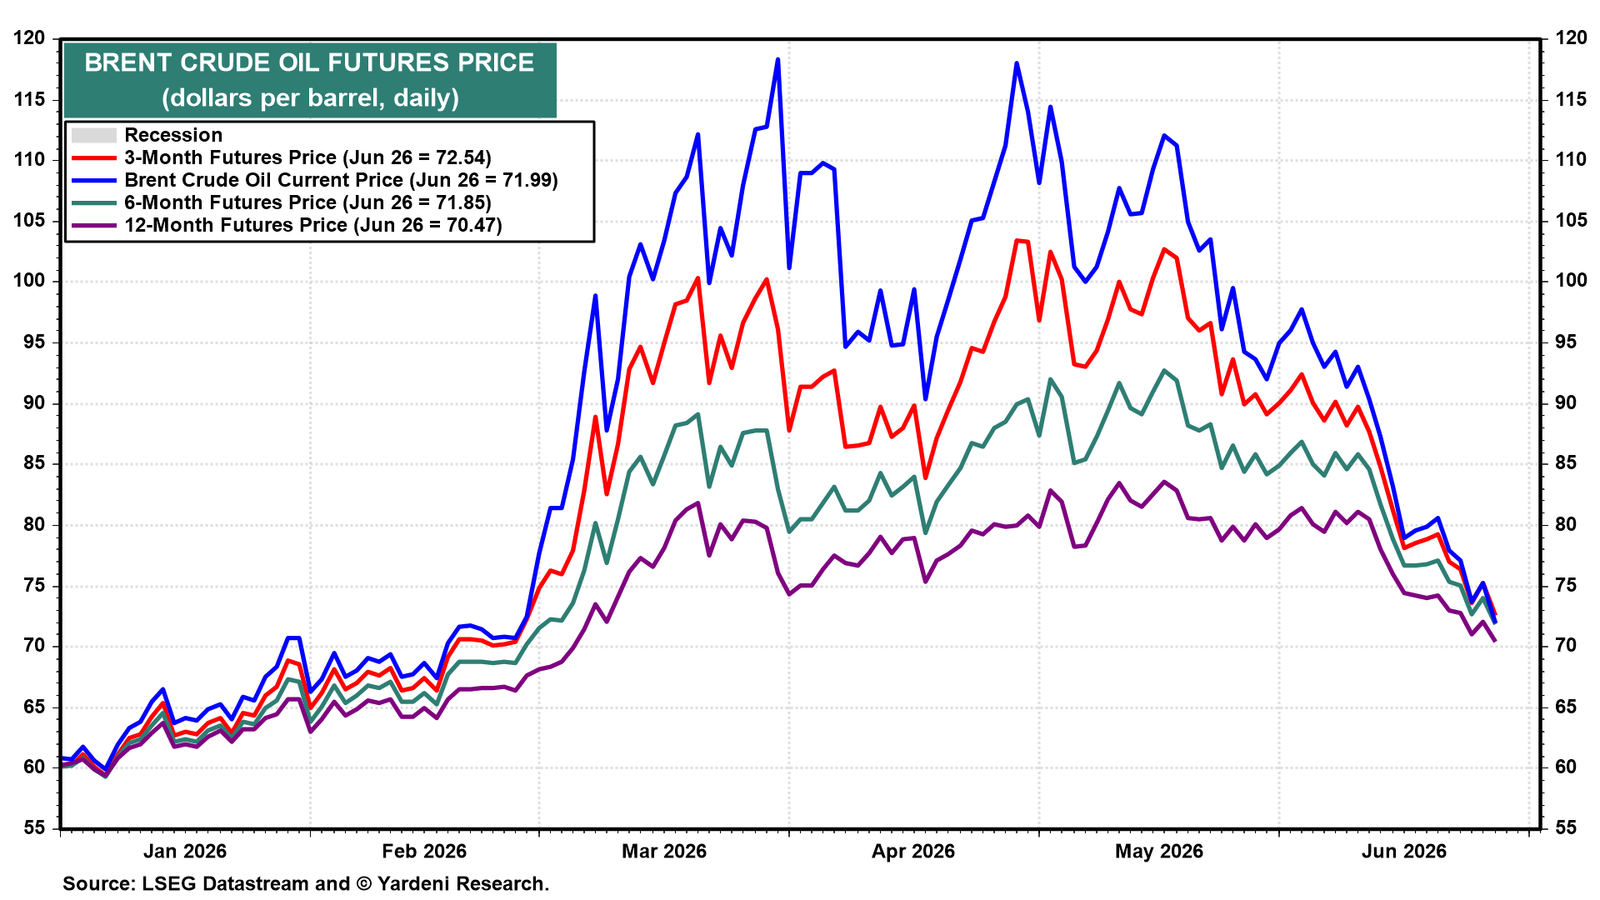
(4) Commodities. Brent crude oil prices have plunged during May and June (chart). They are back to pre-war levels. This should provide a boost to global economic activity. However, as noted below, some of the drop in oil prices may reflect weakness in China's economy.
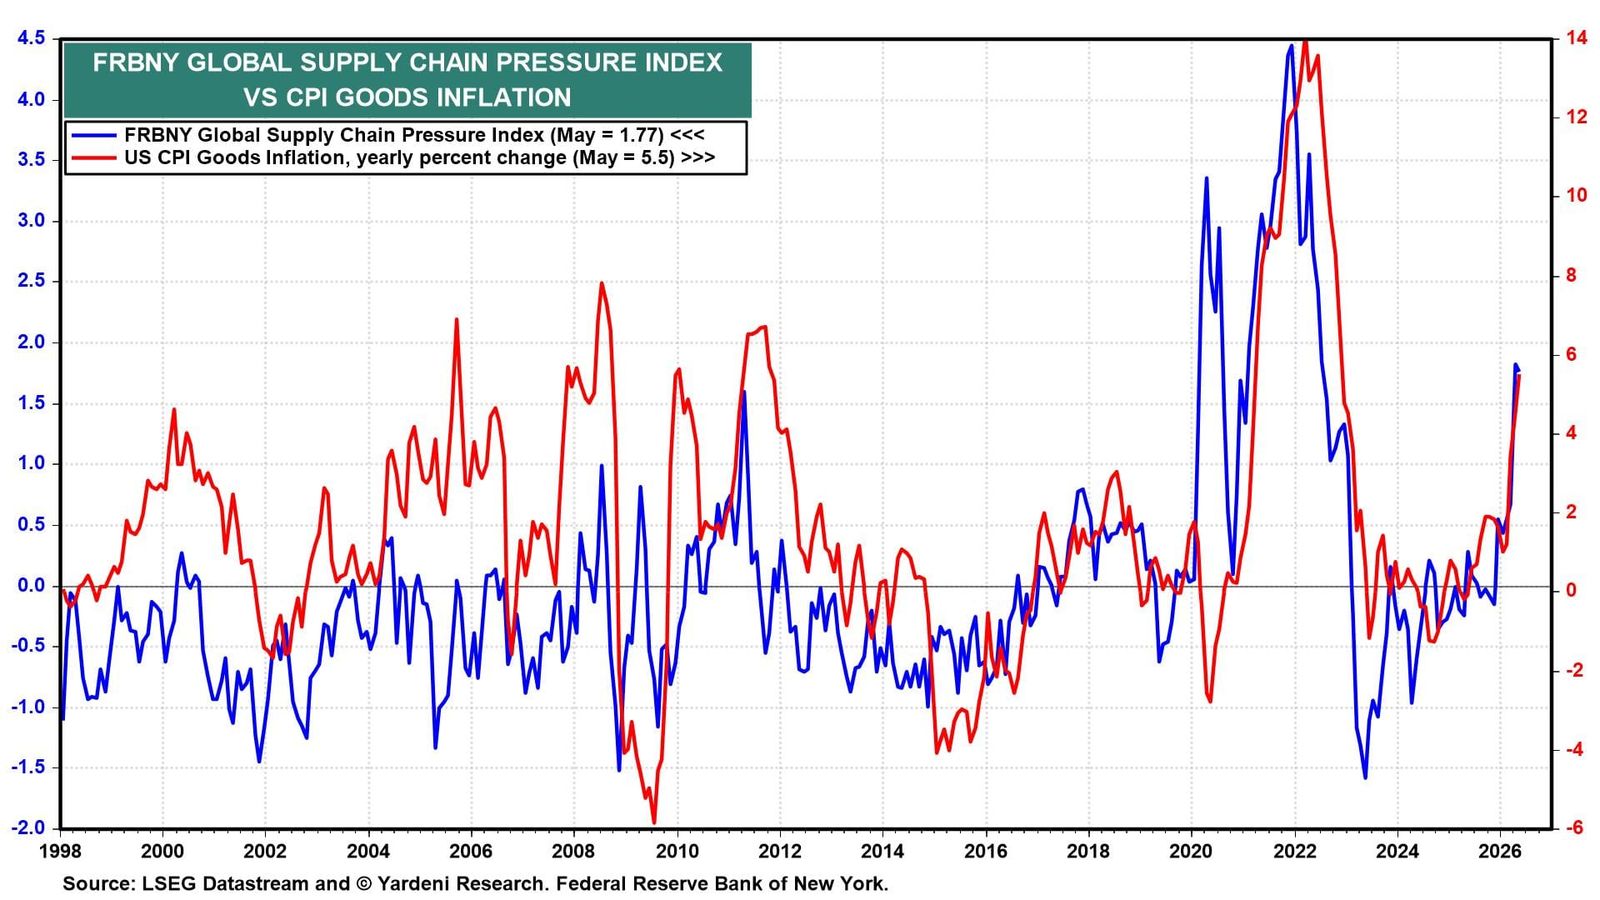
The FRBNY Global Supply Chain Pressure Index ticked back up in May, with US CPI goods inflation at 5.5% y/y (chart). The correlation between these two series has increased in recent years.
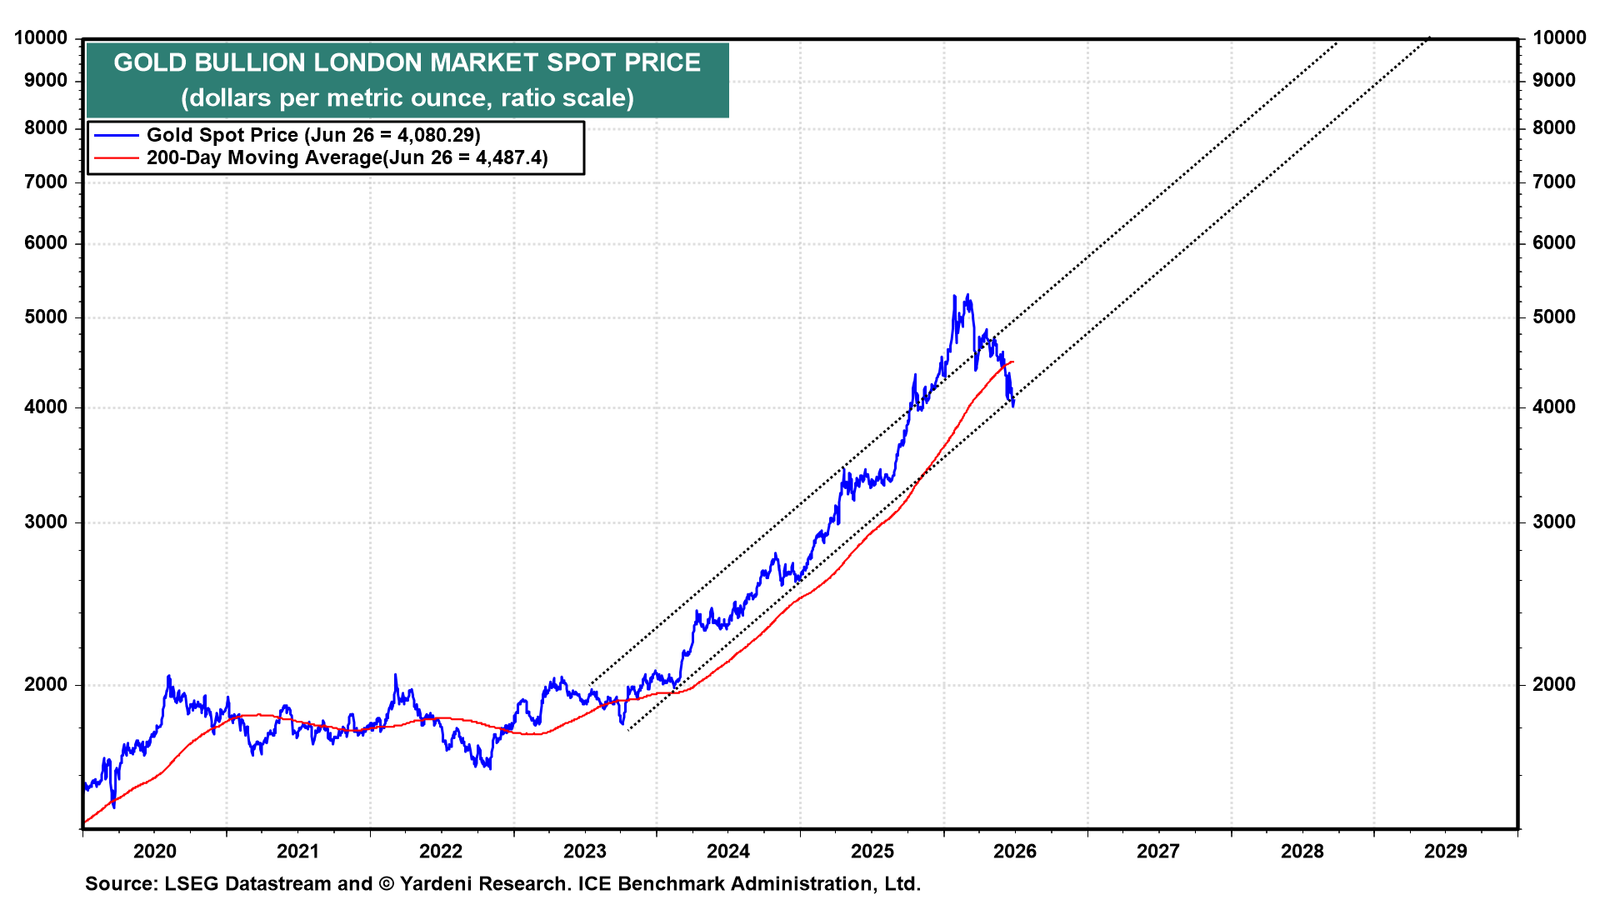
Gold dipped below $4,000 on Wednesday before recovering to $4,080 (chart). It found support at the lower end of its rising channel. We reduced our year-end target from $5,500 to $5,000 last week. The gold price has been beaten down recently by the Fed's hawkish pivot and the dollar's strength.
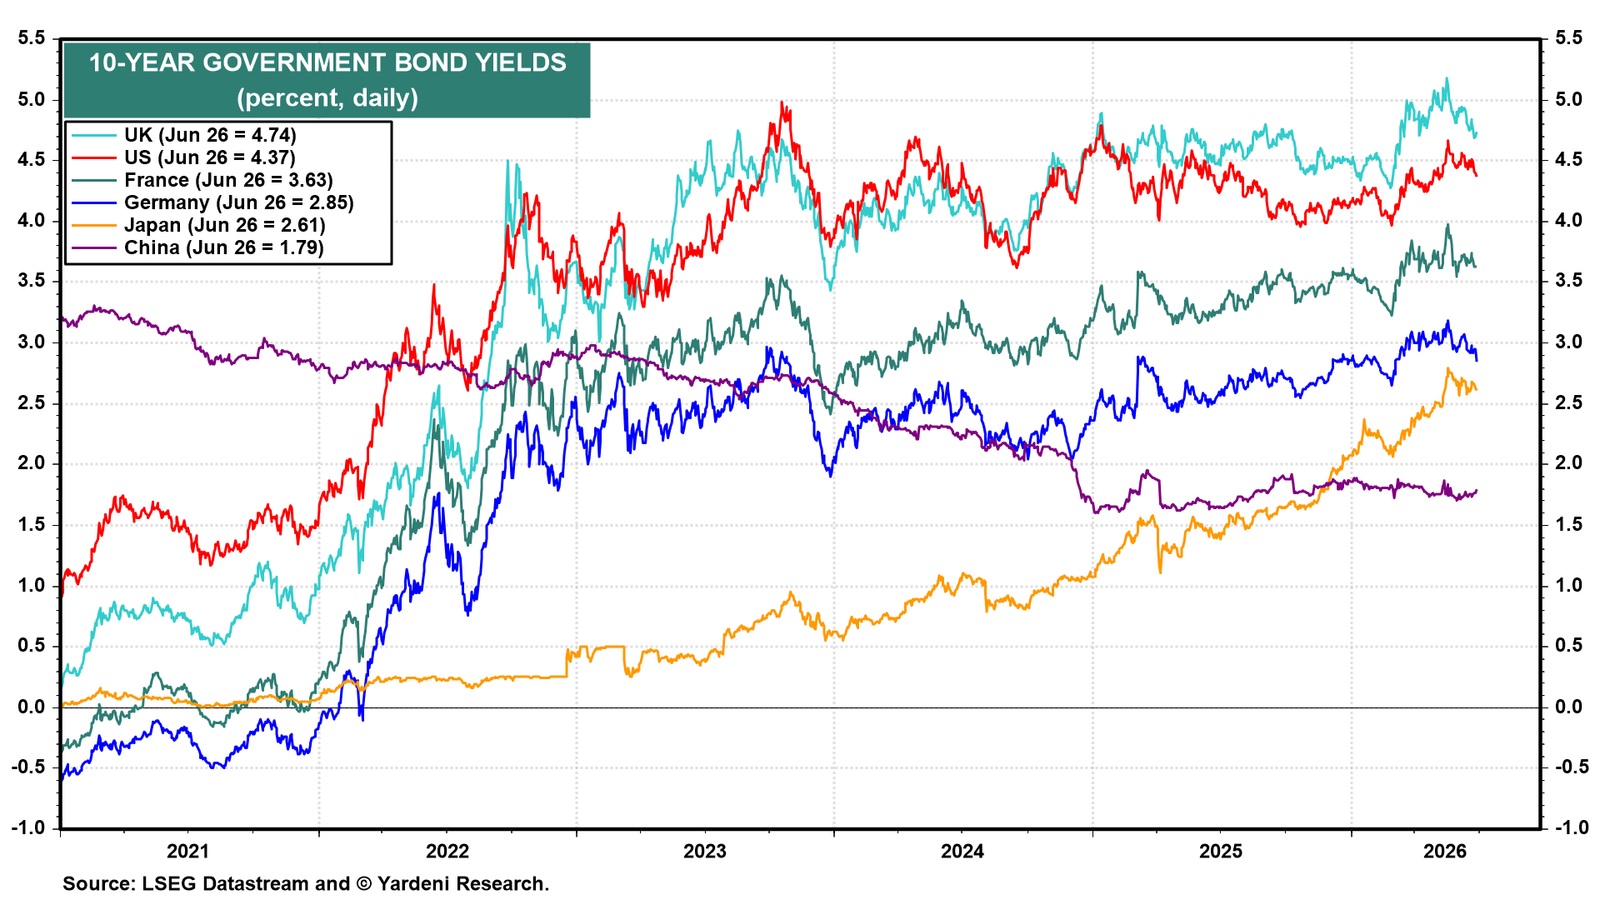
(5) Bond yields. Sovereign yields continue to ease from their May peaks, led by a 9bps decline in the US 10-year to 4.37% on the week (chart). The UK gilt at 4.74% remains the developed world's high-yielder, with France at 3.63%, Germany at 2.85%, and Japan at 2.61%. China’s 10-year yield at 1.79% is in its own world.
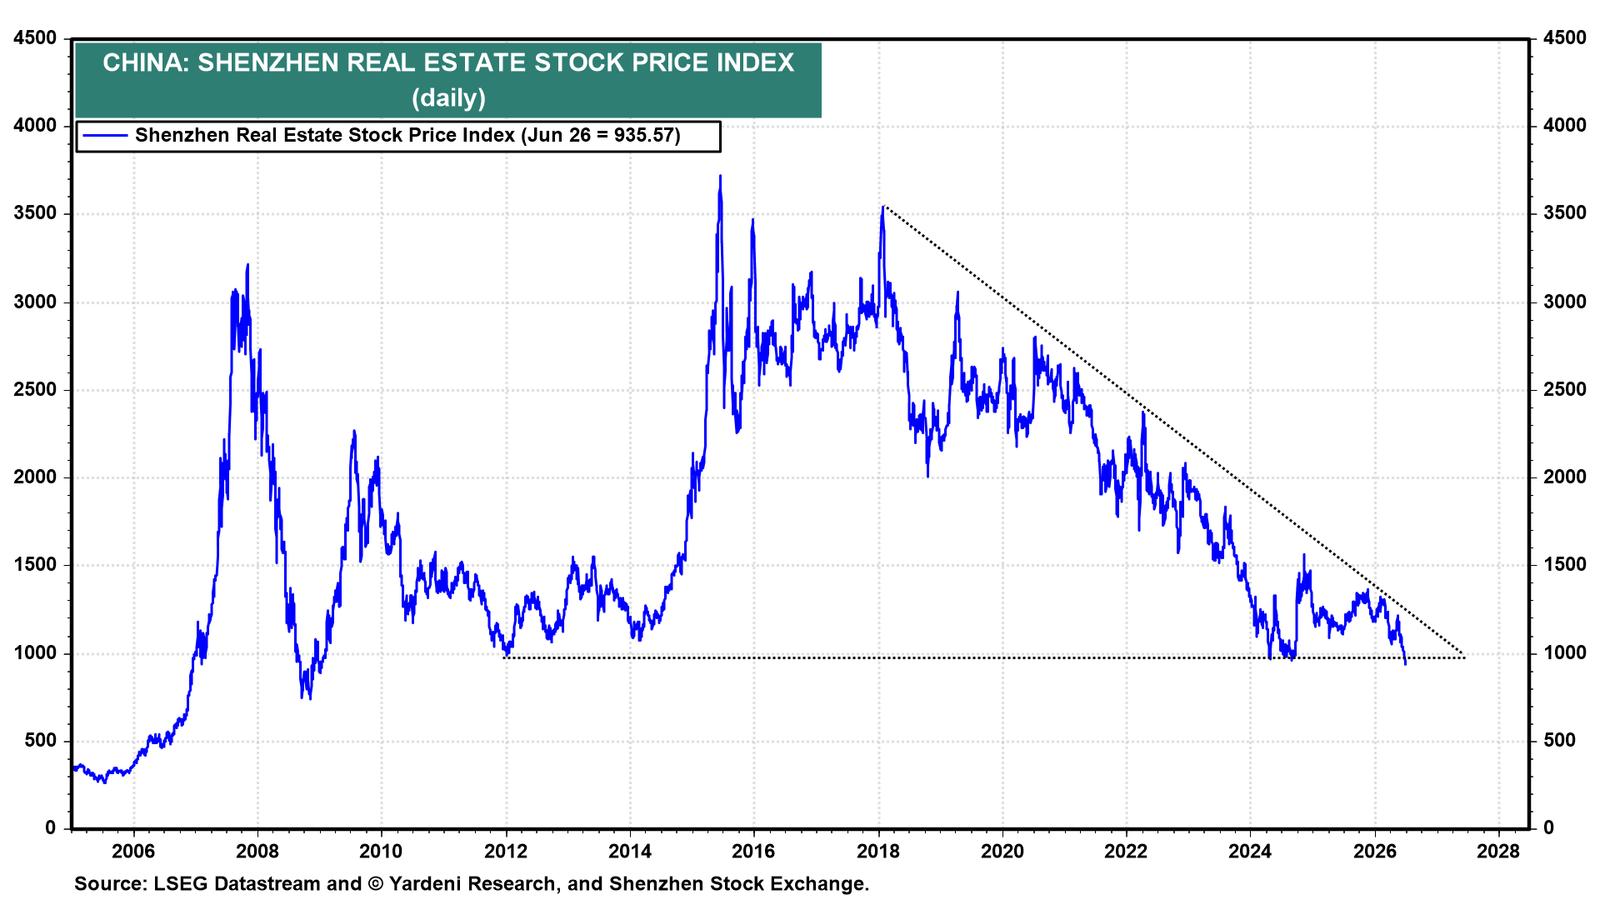
(6) China. China’s property sector remains in dire straits. The Shenzhen Real Estate stock price index remains in a multi-year downward trend and may fall through support (chart).
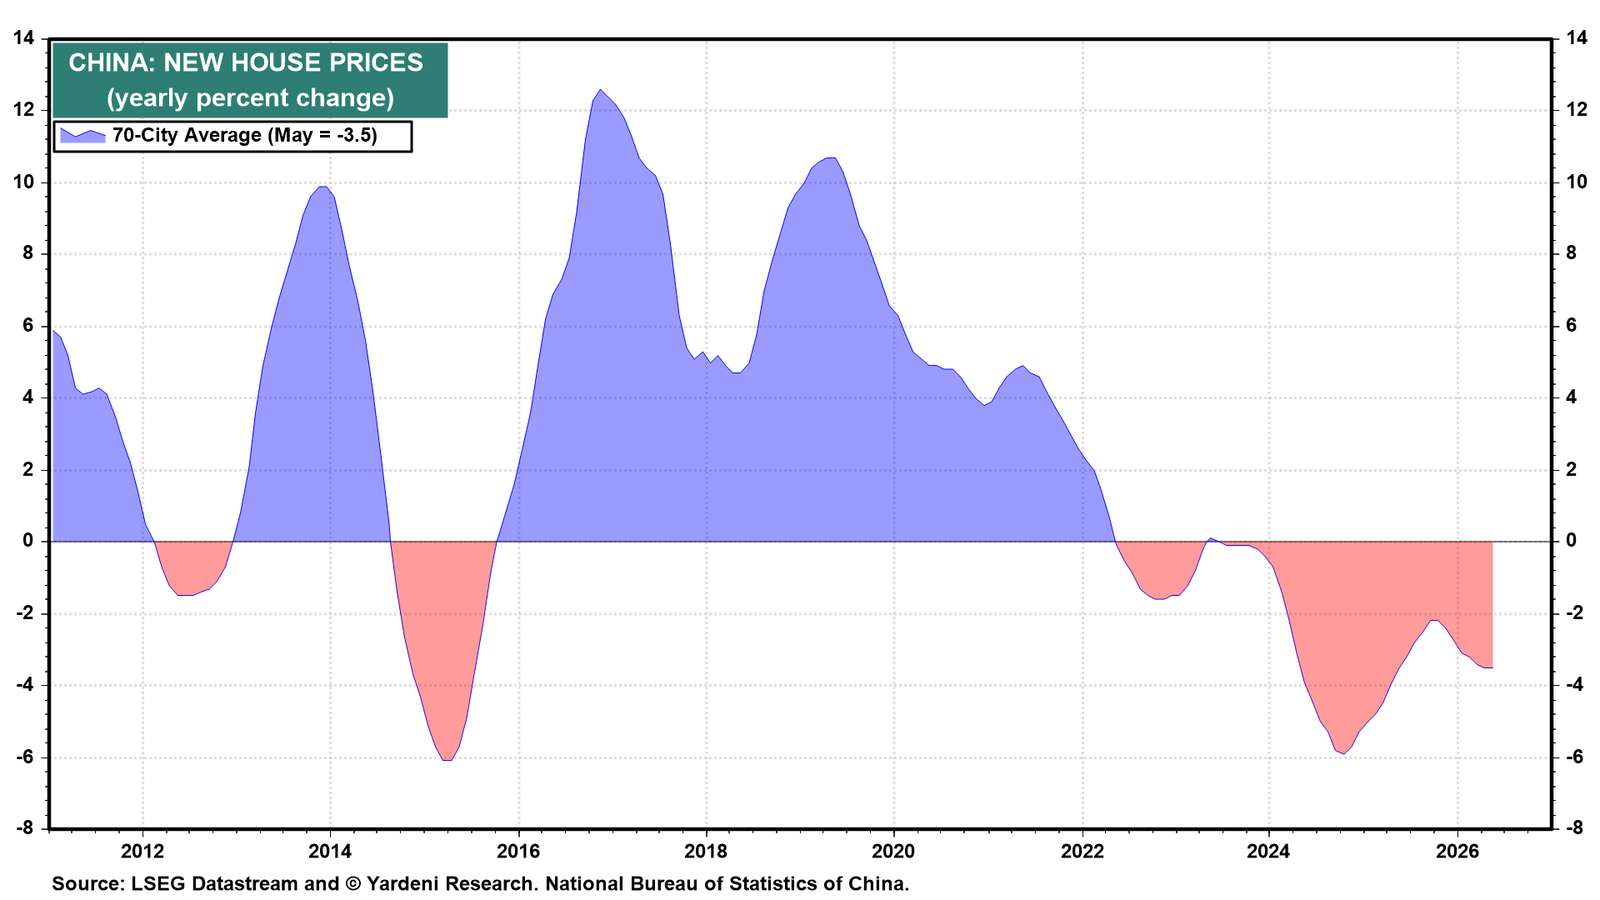
New house prices fell 3.5% y/y in May across the 70-city average, deepening the contraction that took hold in 2023 (chart).
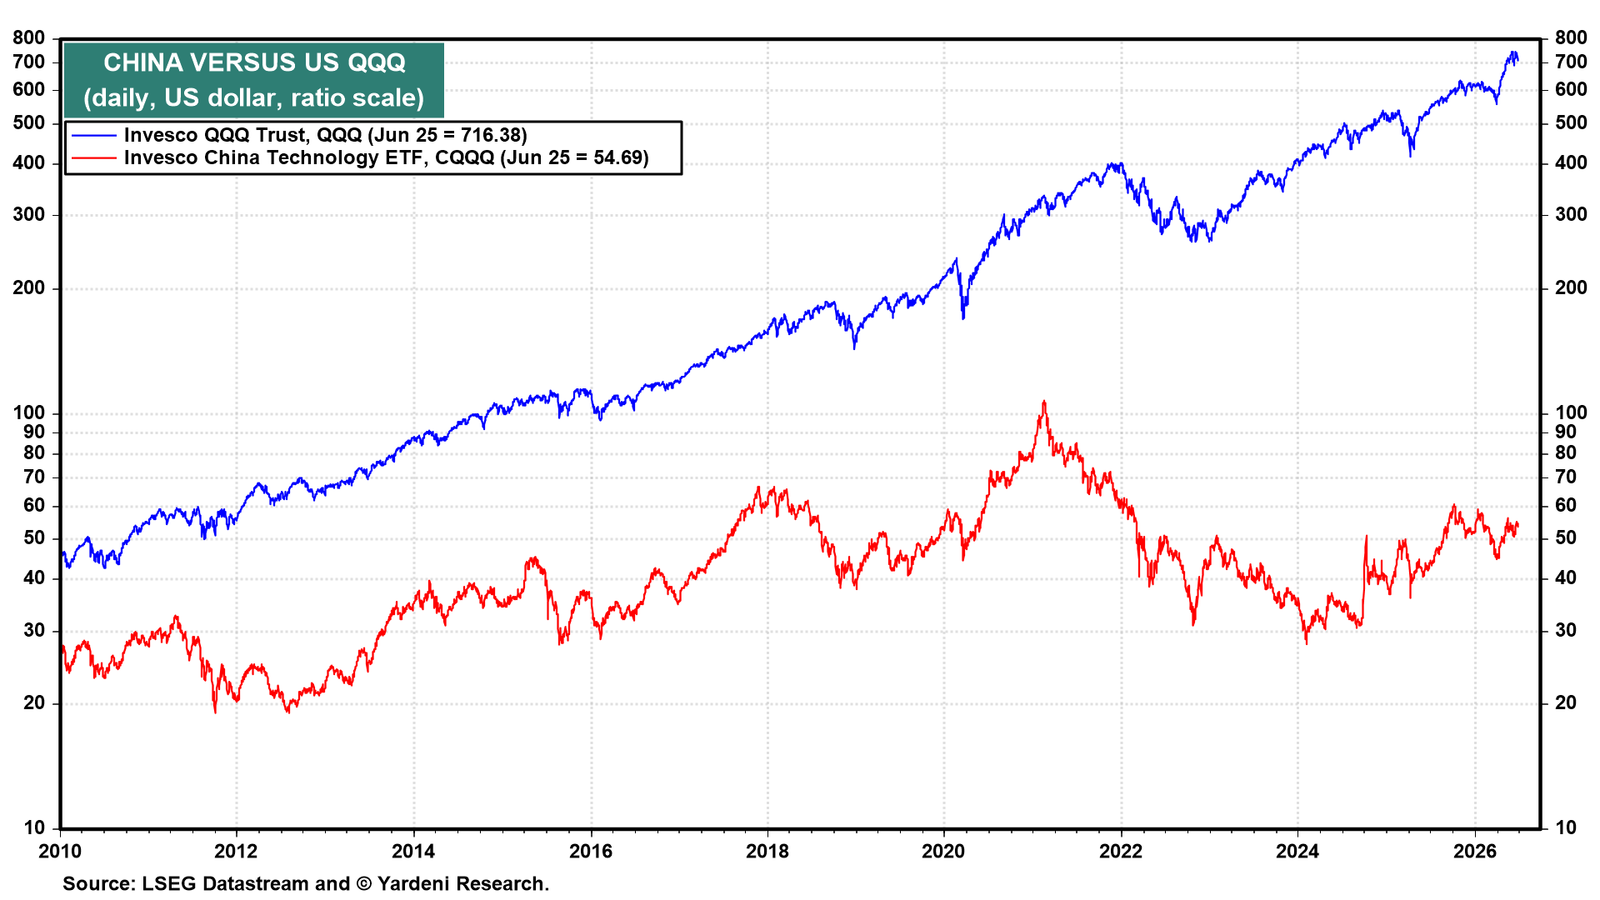
The Invesco China Technology ETF (CQQQ) continues to fall behind the Invesco US QQQ Trust (chart).
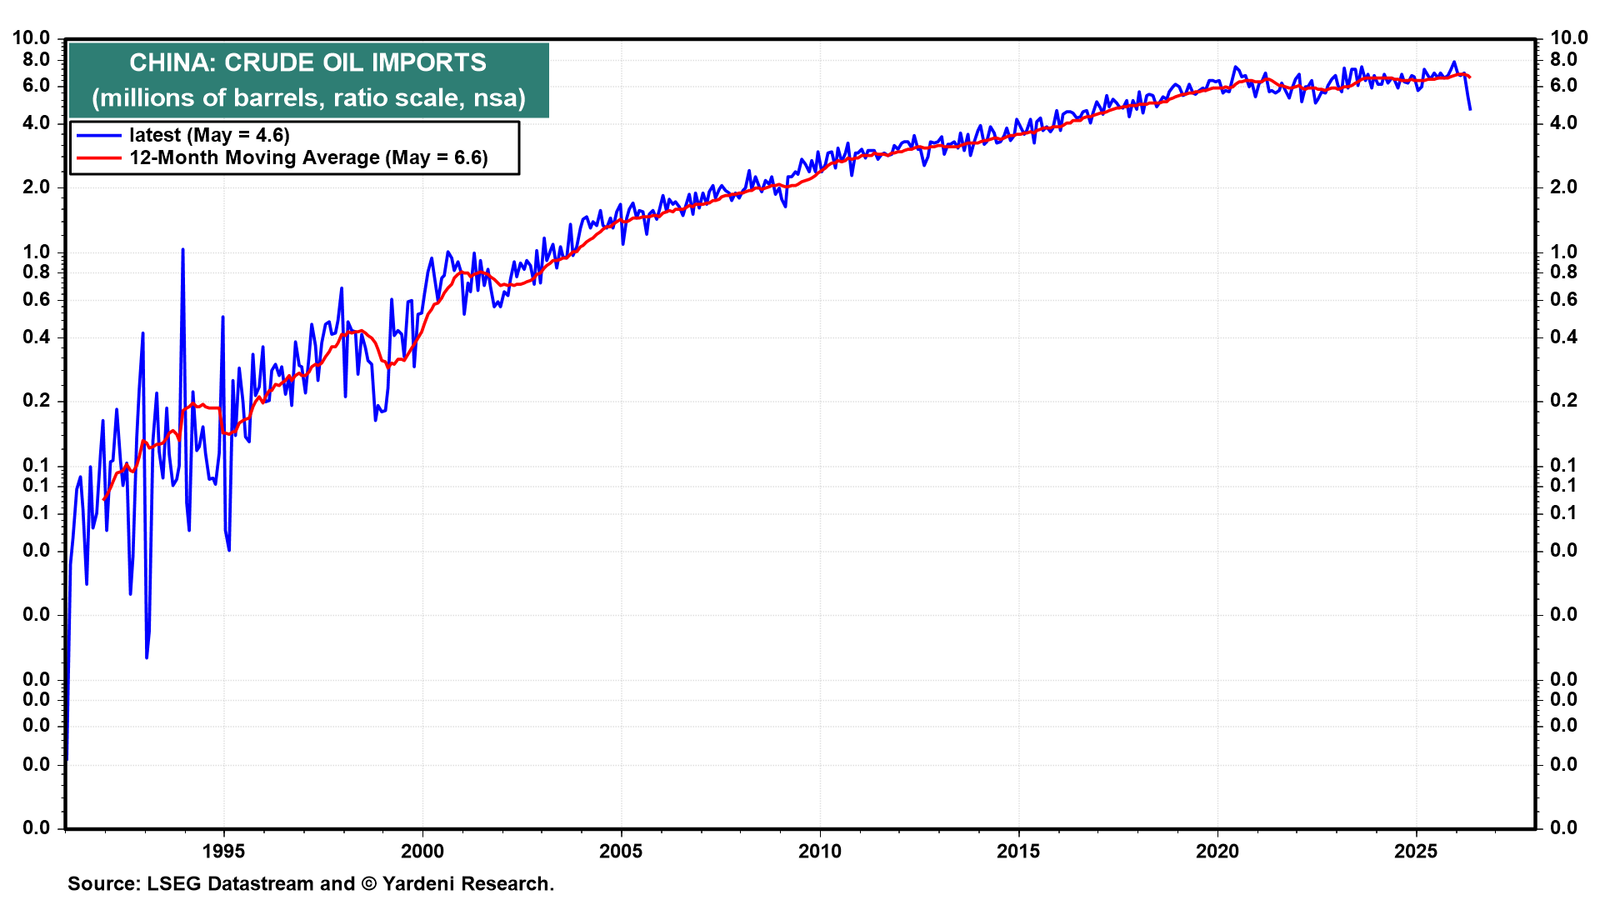
China’s crude oil imports fell to 4.6 million barrels per day in May, well below the 12-month moving average of 6.6, as the Strait of Hormuz closure forced refiners to draw down stockpiles (chart). Their ability to do so helps to explain why oil prices didn't go much higher during the war. Also, slower economic growth and the widespread adoption of EVs have flattened China's crude oil imports in recent years.