I. FEMO in Q3
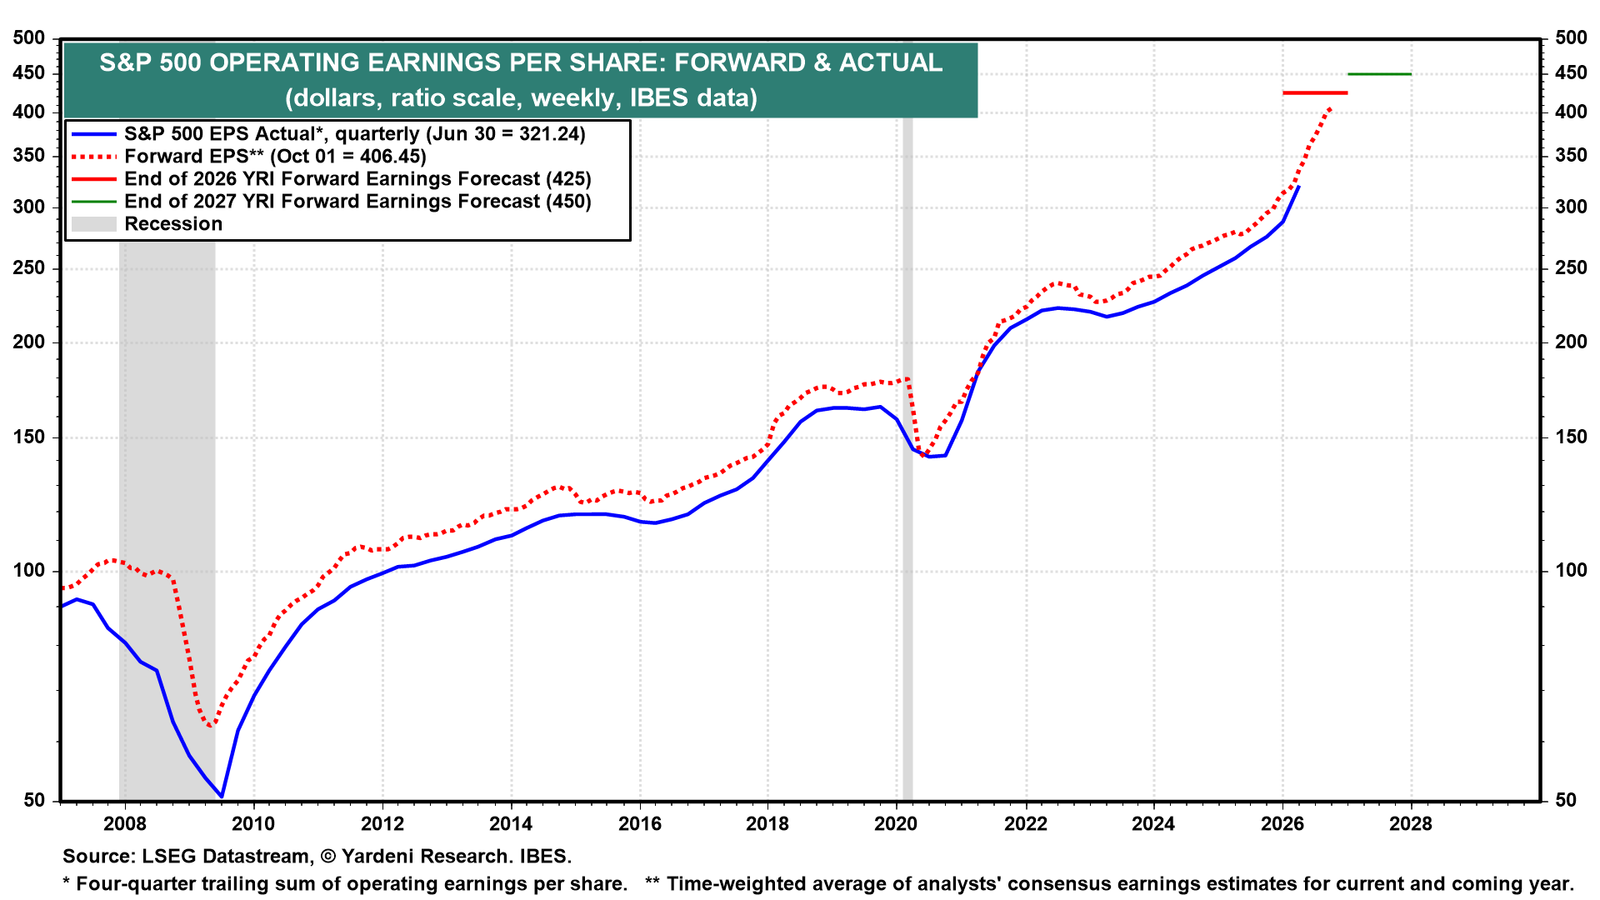
We have spent much of the past few months marveling at Corporate America's Fabulous Earnings Momentum (FEMO). S&P 500 earnings per share growth approached 30% y/y in Q1 and accelerated to more than 50% in Q2, although unusually large mark-to-market investment gains boosted both figures. Even excluding those gains, earnings grew roughly 20% and 25%, respectively. Q2 also marked the fifth consecutive quarter with record earnings.
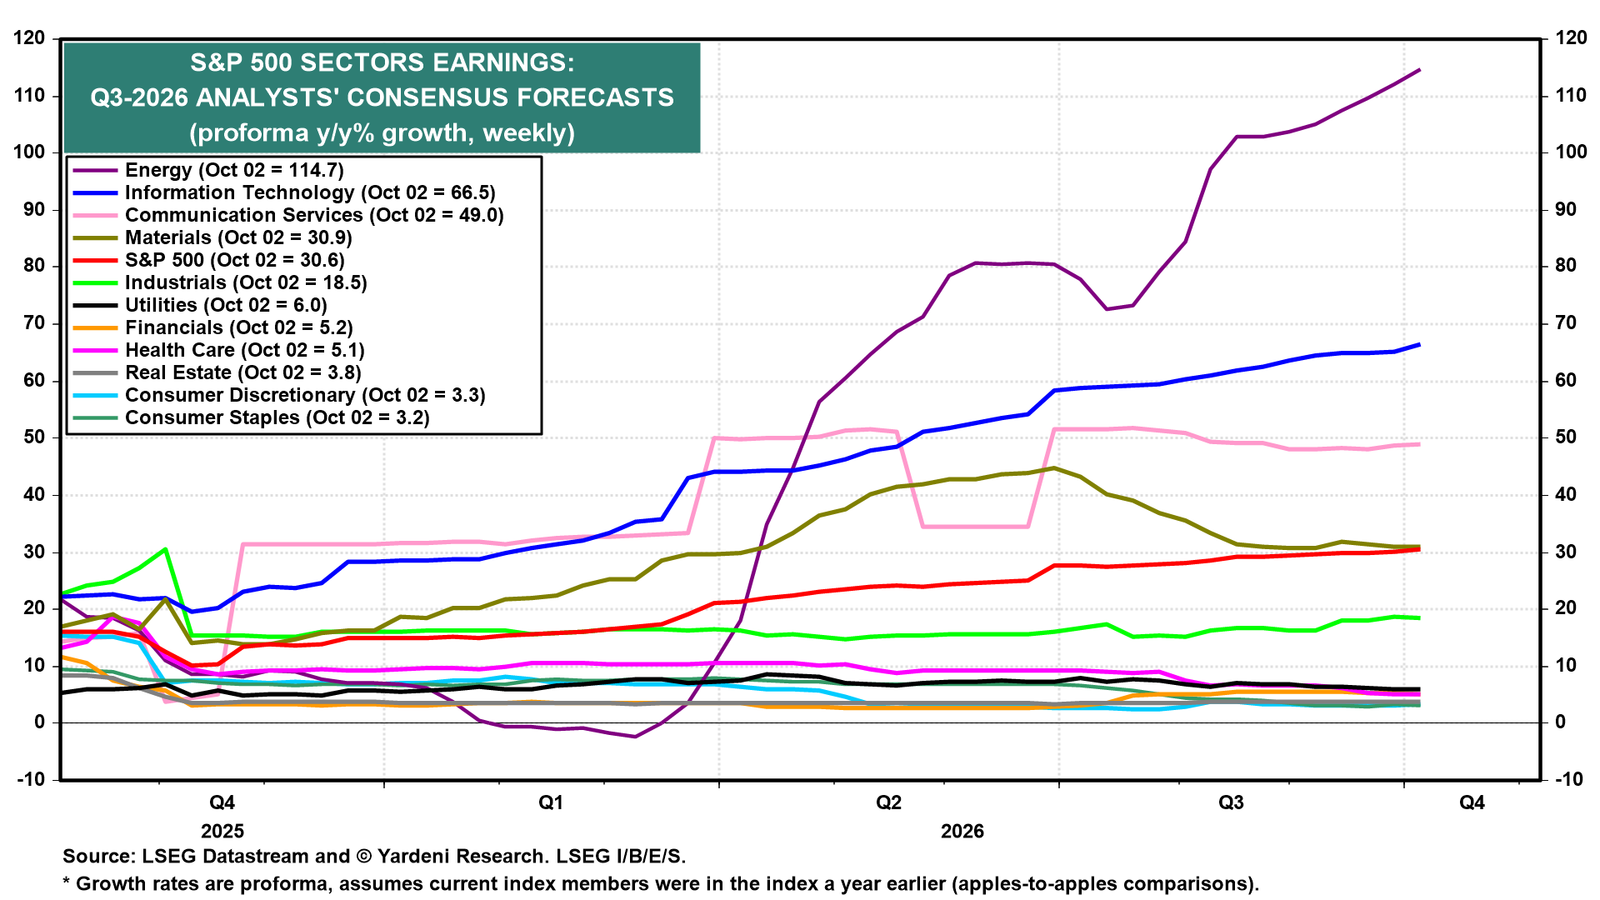
Q3 is shaping up to be another blockbuster quarter. As Joe reported this week, industry analysts' consensus forecast for Q3-2026 S&P 500 EPS growth started the quarter at an already remarkable 27.6% y/y. Rather than declining as it typically does during the quarter, it climbed 3.0 ppts to 30.6%. The level of expected Q3 EPS rose 2.2% over the quarter, ranking as the 12th-largest upward revision in the 130 quarters since Q2-1994. That's no small feat!
Better yet, FEMO is broadening across Corporate America. Analysts expect all 11 S&P 500 sectors to deliver positive y/y growth in both revenues and earnings. Only once before, in Q2-2021, has such a perfect sweep occurred in the 25 years we've tracked the data. Overall, S&P 500 revenues are expected to grow 11.6% y/y, compared with earnings growth of 30.6% (chart).
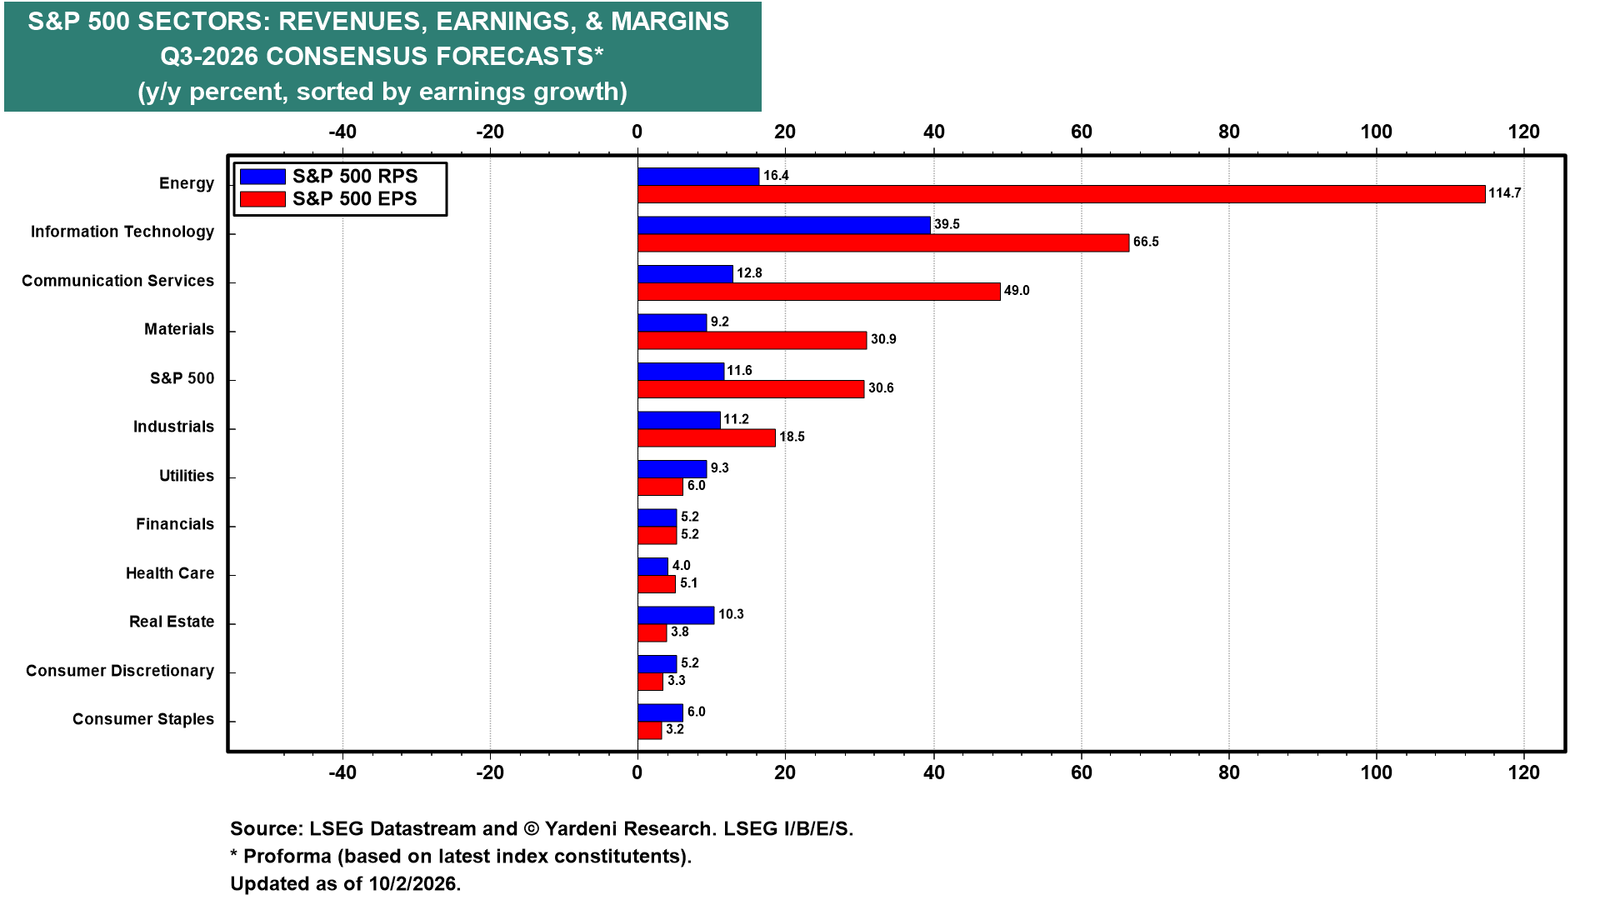
Energy is expected to lead Q3 earnings growth at a whopping 114.7% y/y, followed by Information Technology, Communication Services, and Materials (chart). Energy's expected earnings growth has surged from negative territory earlier this year, while Information Technology's has climbed steadily, reflecting the AI investment boom.
II. Financials in Q3
Q3 earnings season kicks off next week with the big banks. The latest banking data suggest there is plenty to be optimistic about.
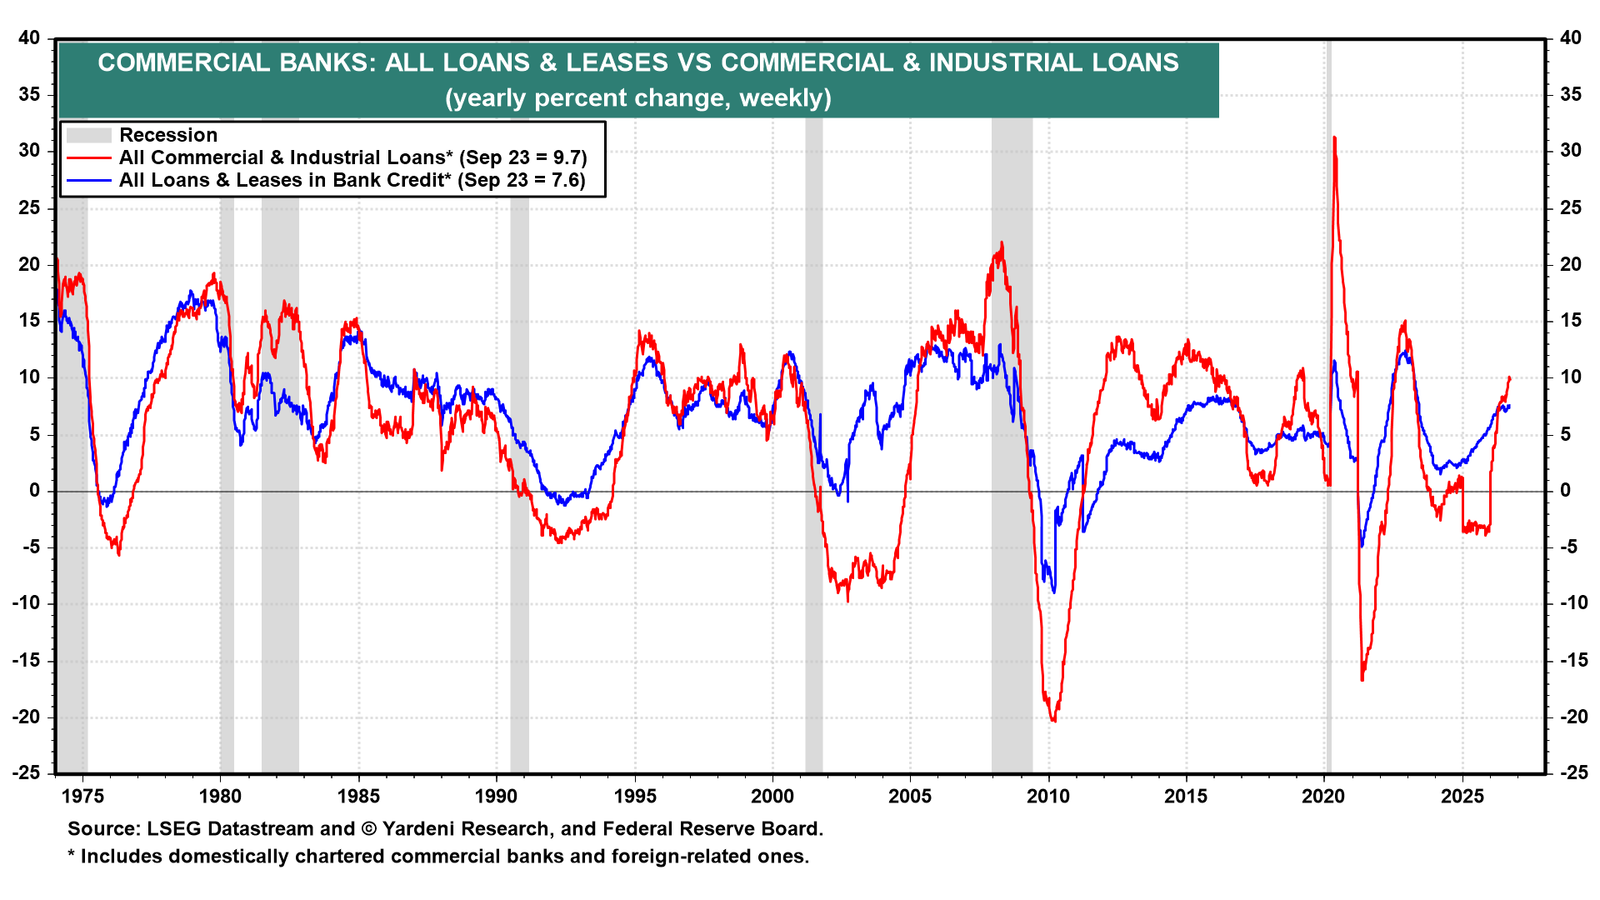
Commercial and industrial loans rose 9.7% y/y during the week of September 23, while total bank loans and leases increased a robust 7.6% (chart). Both point to strong bank lending.
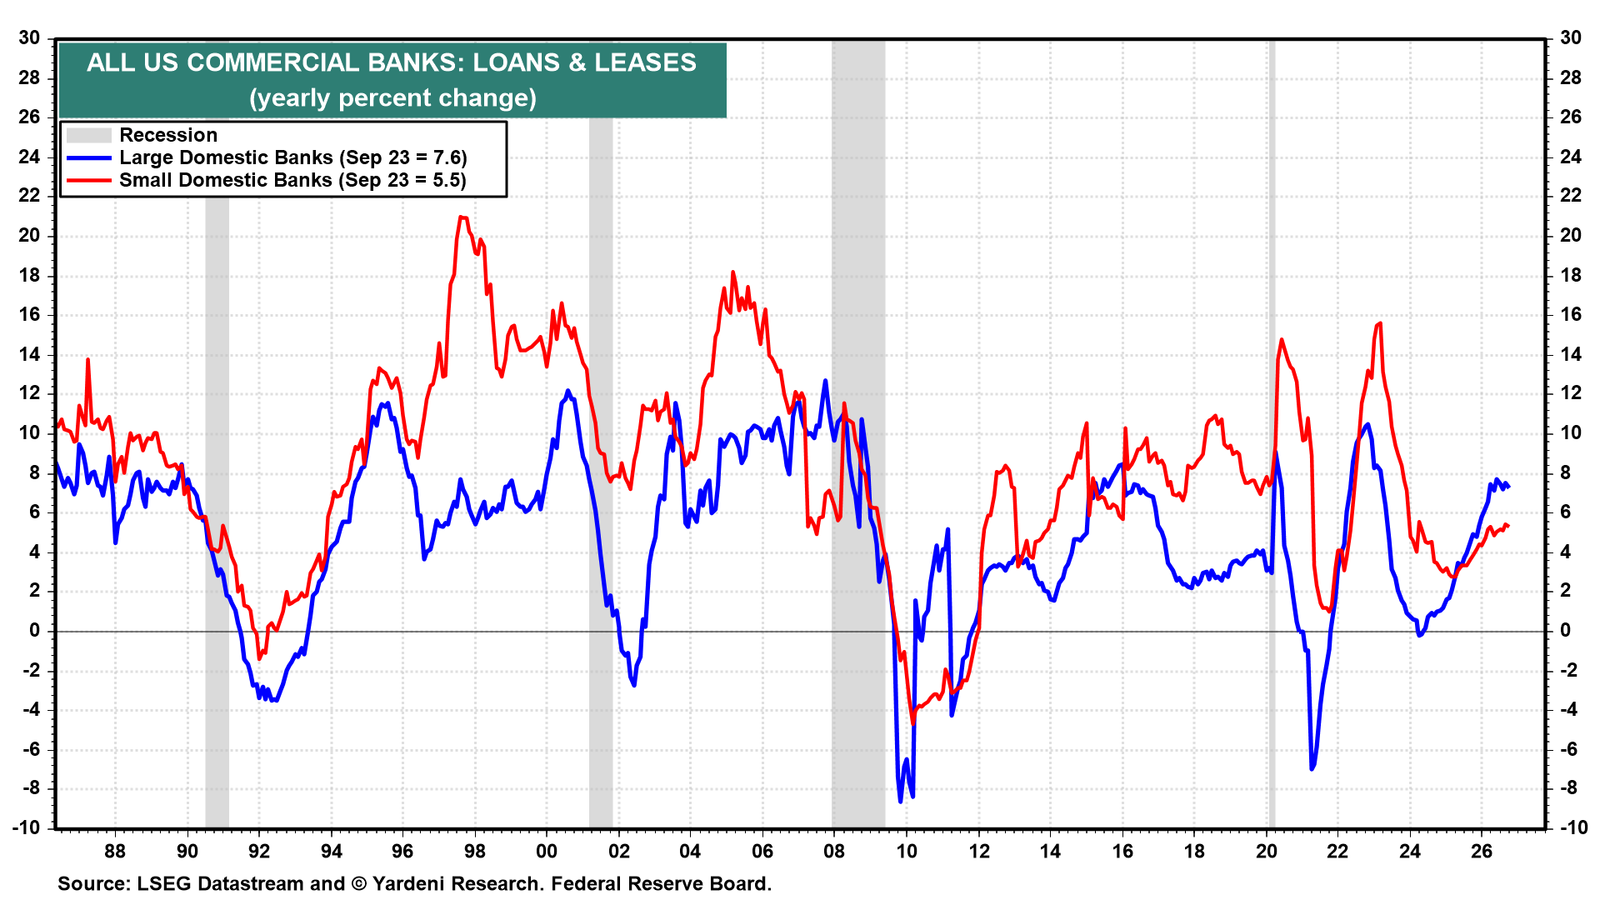
Large domestic banks are leading the charge, with loan growth of 7.6% y/y compared with 5.5% at smaller banks (chart). Strong bank lending is another reflection of a resilient economy.
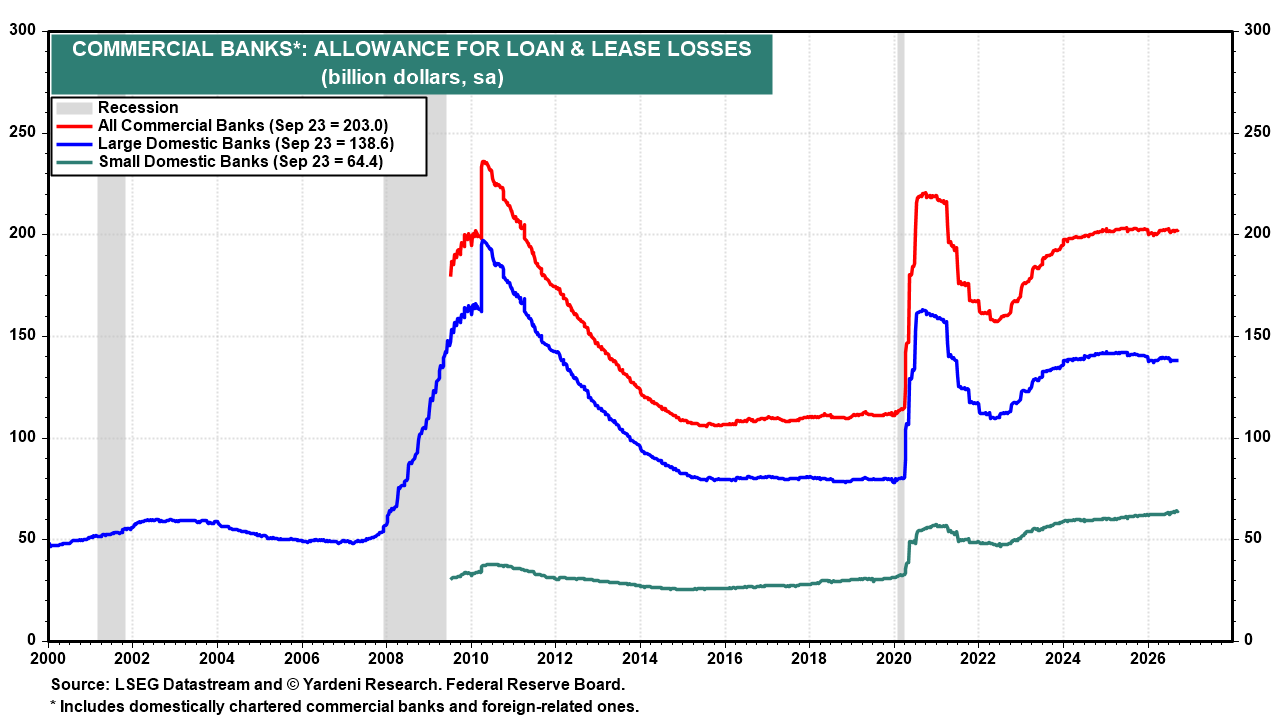
Commercial banks' allowances for loan and lease losses stood at $203 billion during the week of September 23, little changed over the past two years, confirming that banks do not see a deterioration in credit quality.
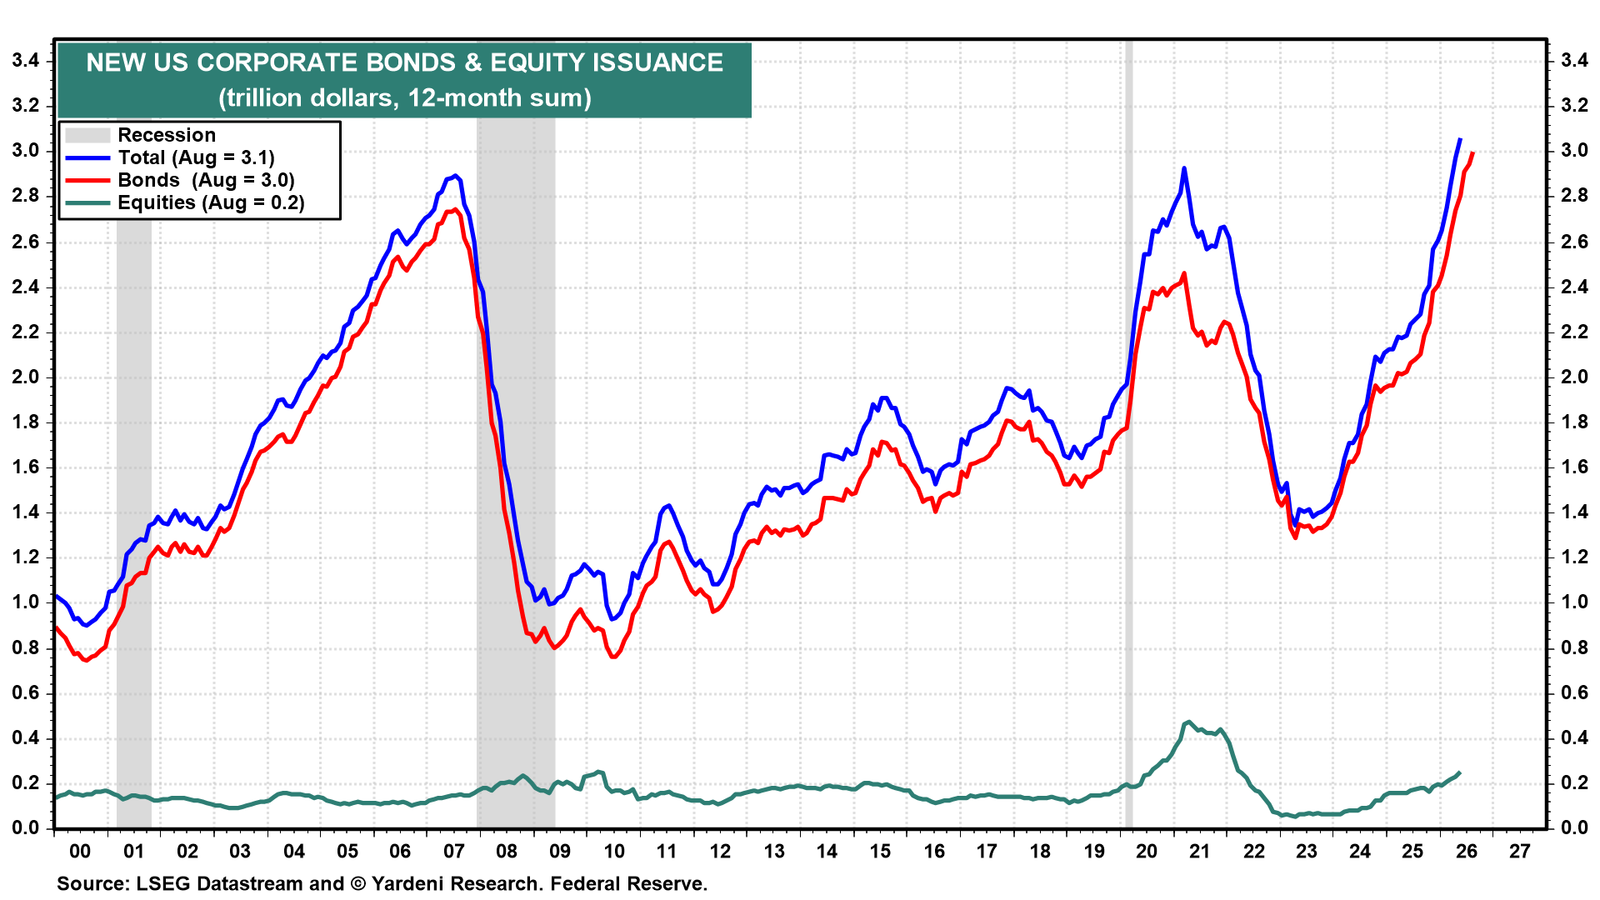
Meanwhile, new US corporate bond and equity issuance reached a record $3.1 trillion over the 12 months through August (chart). That's good news for investment banking activity and another sign of robust demand for capital across Corporate America.
III. What could go wrong?
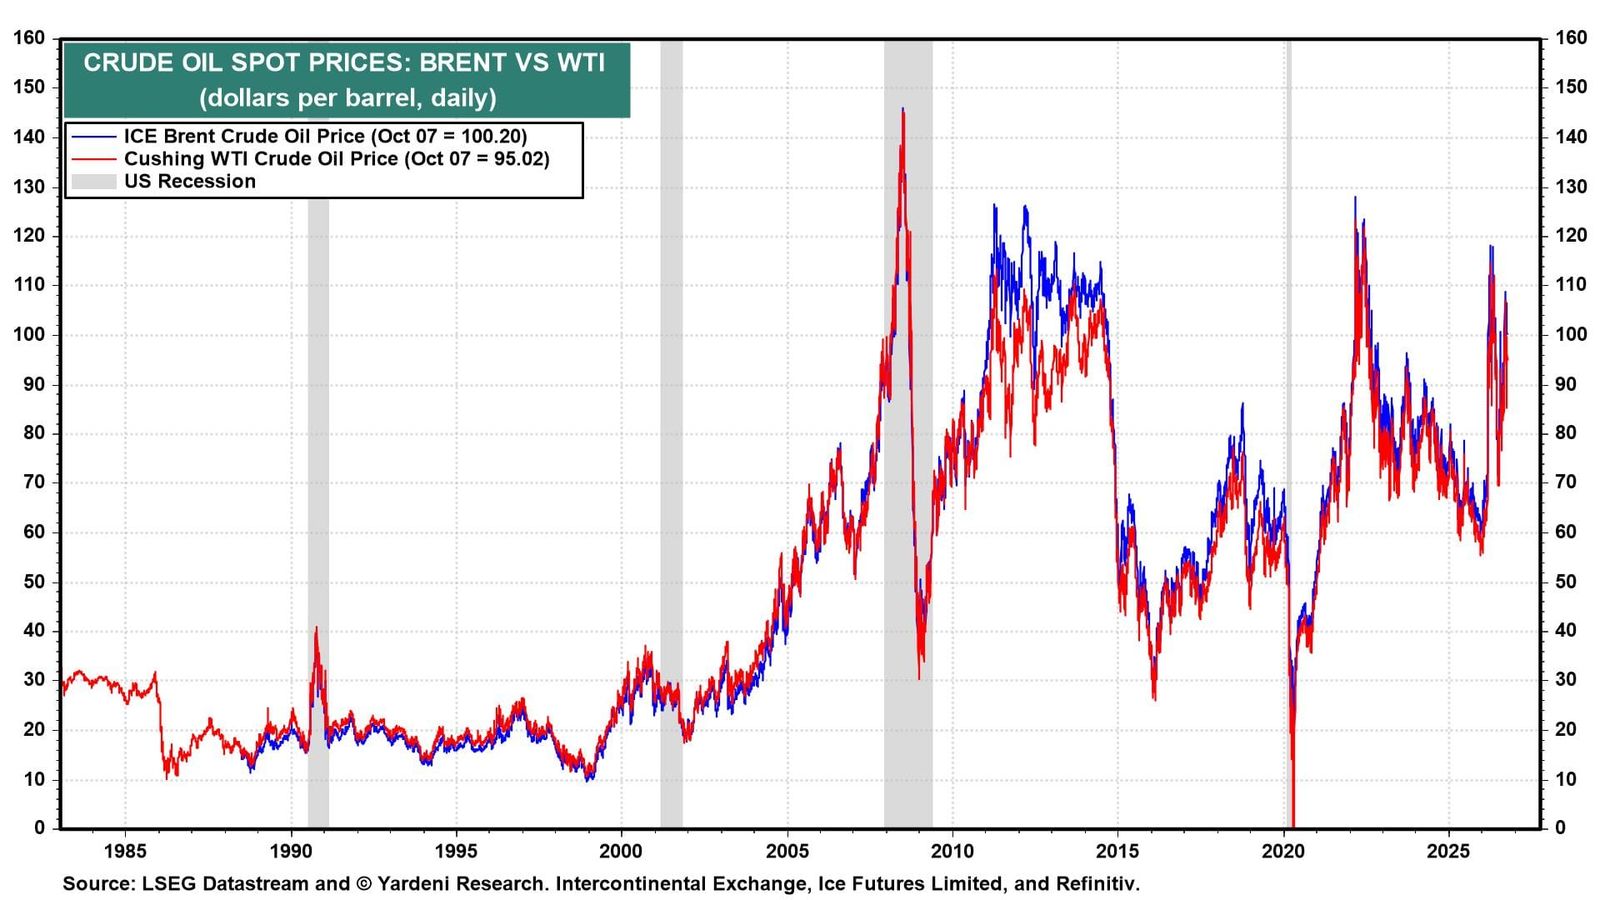
All this sounds bullish, and it is! But our worry list remains long, not least because of the ongoing conflict in the Middle East. The bid-ask spread between Washington and Tehran remains wide. The risk of a military re-escalation is increasing. For now, we expect energy prices to remain higher for longer, keeping inflation and bond yields elevated (chart).
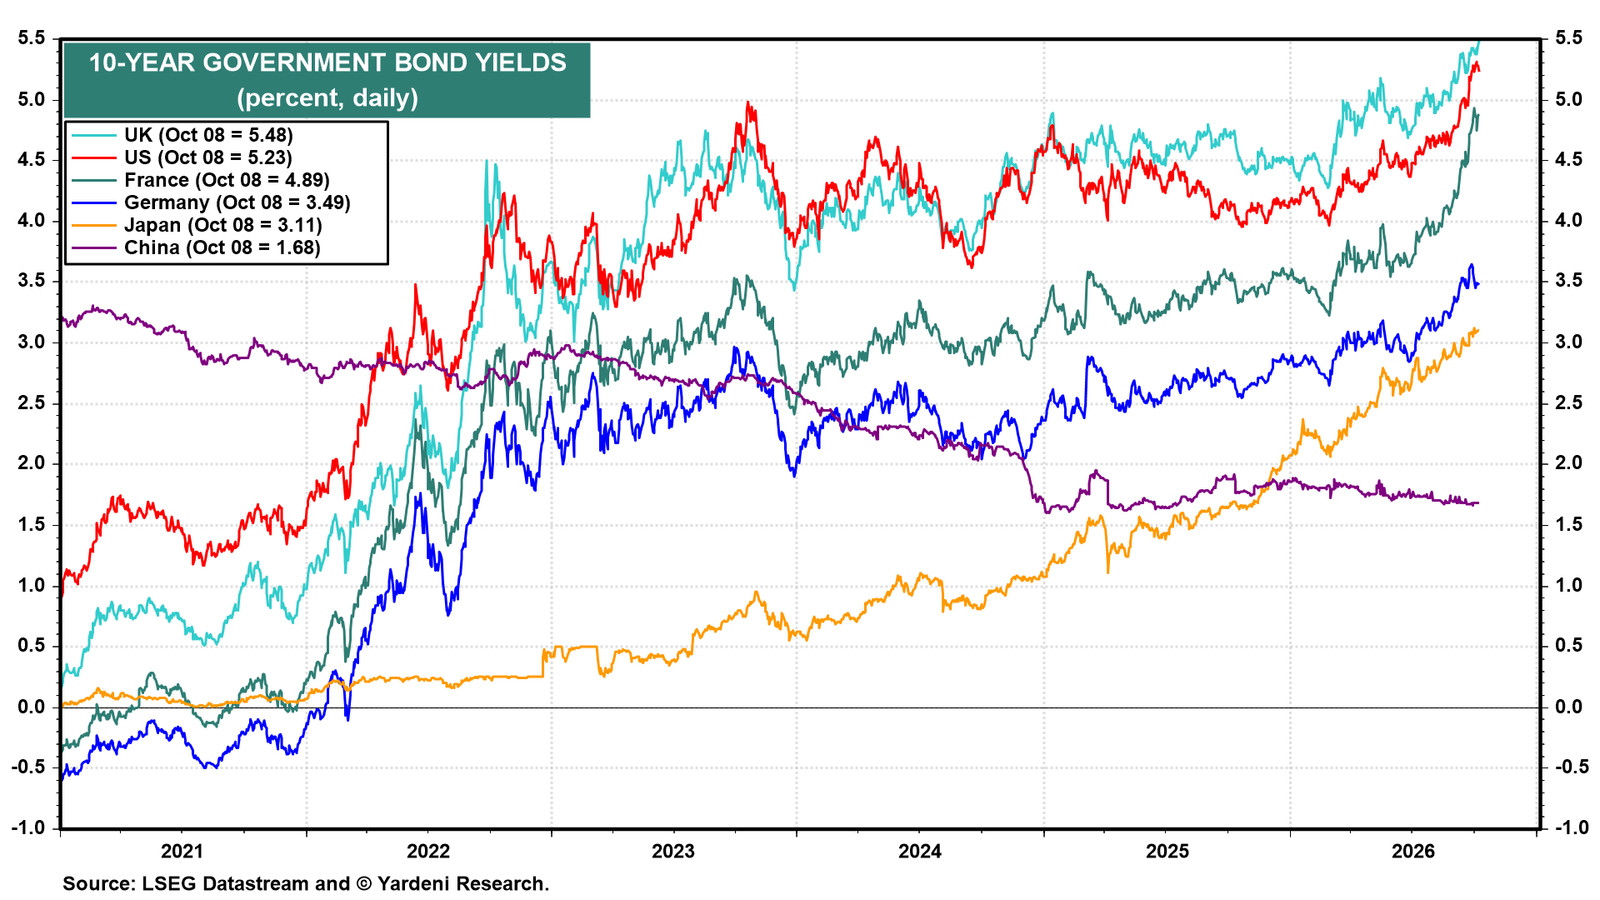
Meanwhile, global bond yields keep rising (chart). In the US, stronger nominal GDP growth and a higher neutral rate partly explain the rise. The energy shock, the unwinding yen-carry trade, and mounting concerns about fiscal excesses are adding fuel to the fire. In France, the Bond Vigilantes are pushing yields above nominal GDP growth amid high debt, weak growth, and political gridlock. The risk is contagion across Europe.
Other worries include second-round inflation effects, more aggressive Fed rate hikes, rising US debt-service costs, an AI investment slowdown, post-midterm political gridlock, and mega IPOs draining liquidity from the stock market.
Against this backdrop, we recently moved our 8,400 target for the S&P 500 from the end of this year to the middle of next year. Importantly, we haven't lowered our earnings outlook. S&P 500 forward EPS reached a record $406.45 on October 1, and we still expect it to climb to $425 by year-end (chart). Instead, we reduced our target forward P/E from 19.8 to 18.6 to reflect valuation risks.