The price of Brent crude is back above $100 a barrel. Government bond yields are rising nearly everywhere, with the 10-year yields of Australia and the UK both above 5.00% and the US’s at 4.97%. Either development would normally be enough to break a global bull market in stocks. Neither has so far. That's because corporate earnings keep climbing.
The Fed, the Bank of England (BOE), and the Bank of Japan (BOJ) all meet this week. The Fed's decision matters the most to investors’ appetite for global risk. The BOJ's decision matters the most for the yen carry trade, which seems to be unwinding now that the yen is back up to 153.47 per dollar and short-term interest rates are rising in Japan. That unwinding might partly explain the global bond market selloff.
Here's more:
I. Stay Home vs Go Global
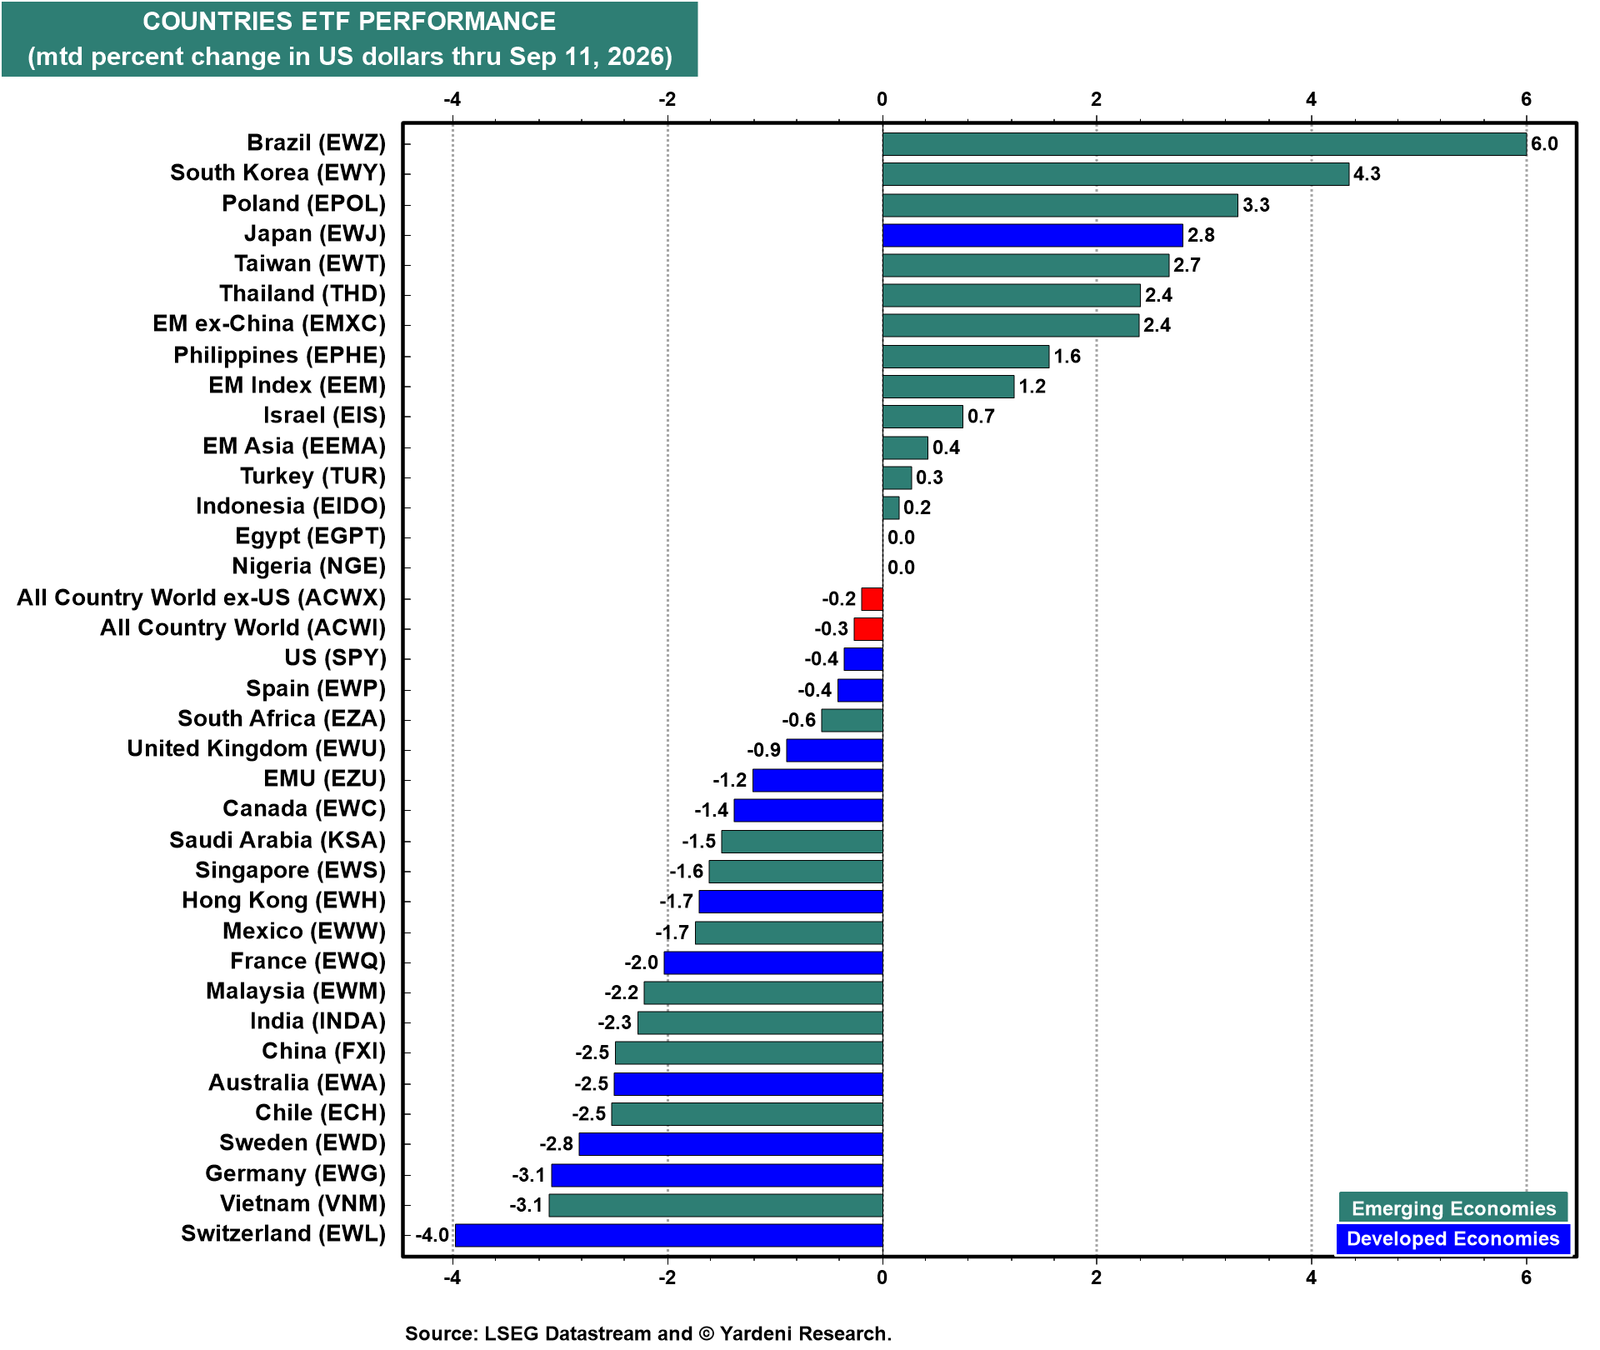
The Go Global investment strategy is still working, and September has done nothing to change that so far. Brazil leads the country ETF rankings mtd at 6.0% in dollar terms, with South Korea at 4.3% and Poland at 3.3% (chart). The US ETF is down 0.4% mtd.
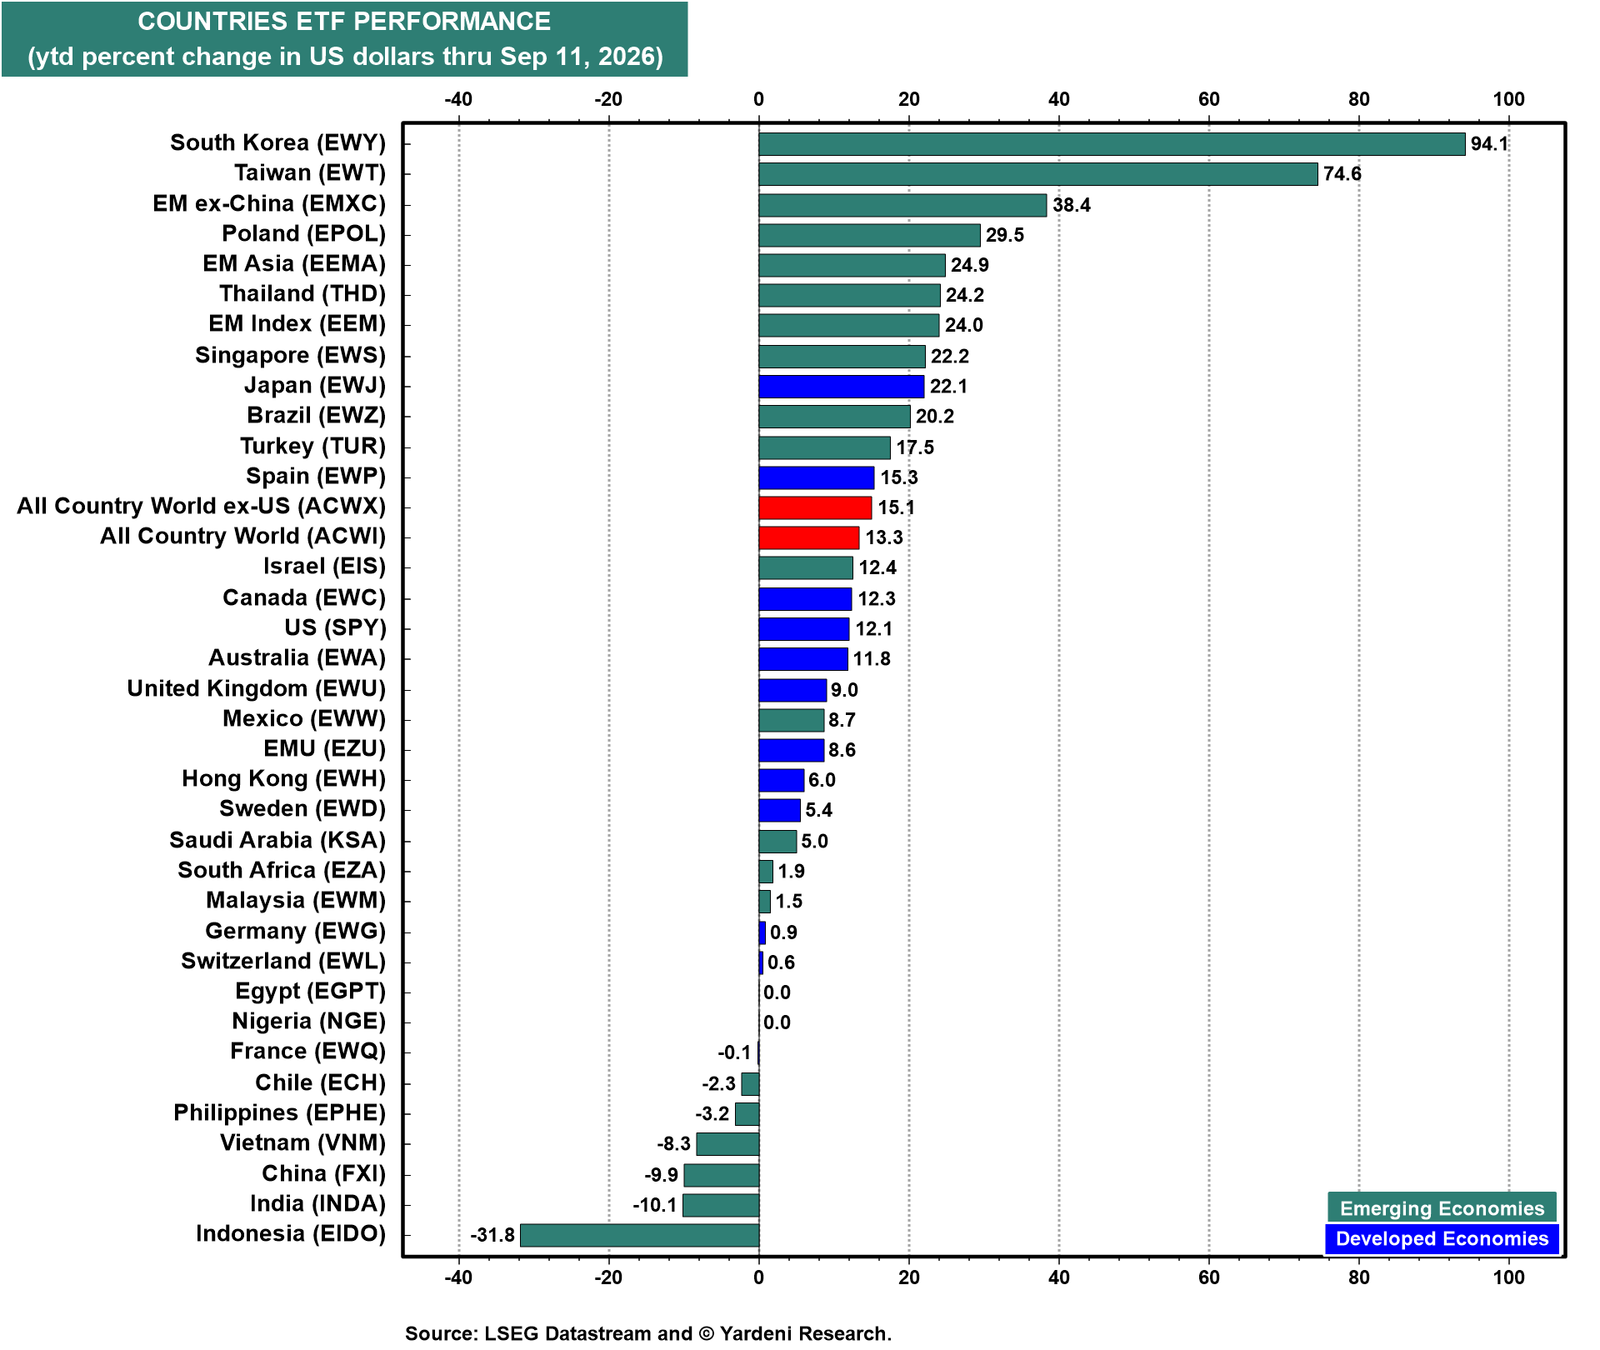
The ytd performance derby shows similar leadership, with a much wider spread. The South Korea and Taiwan ETFs are in the lead, up 94.1% and 74.6% ytd, respectively (chart). The US ETF is up 12.1%, behind both the All Country World (ACW) ex-US ETF at 15.1% and ACW ETF at 13.3%.
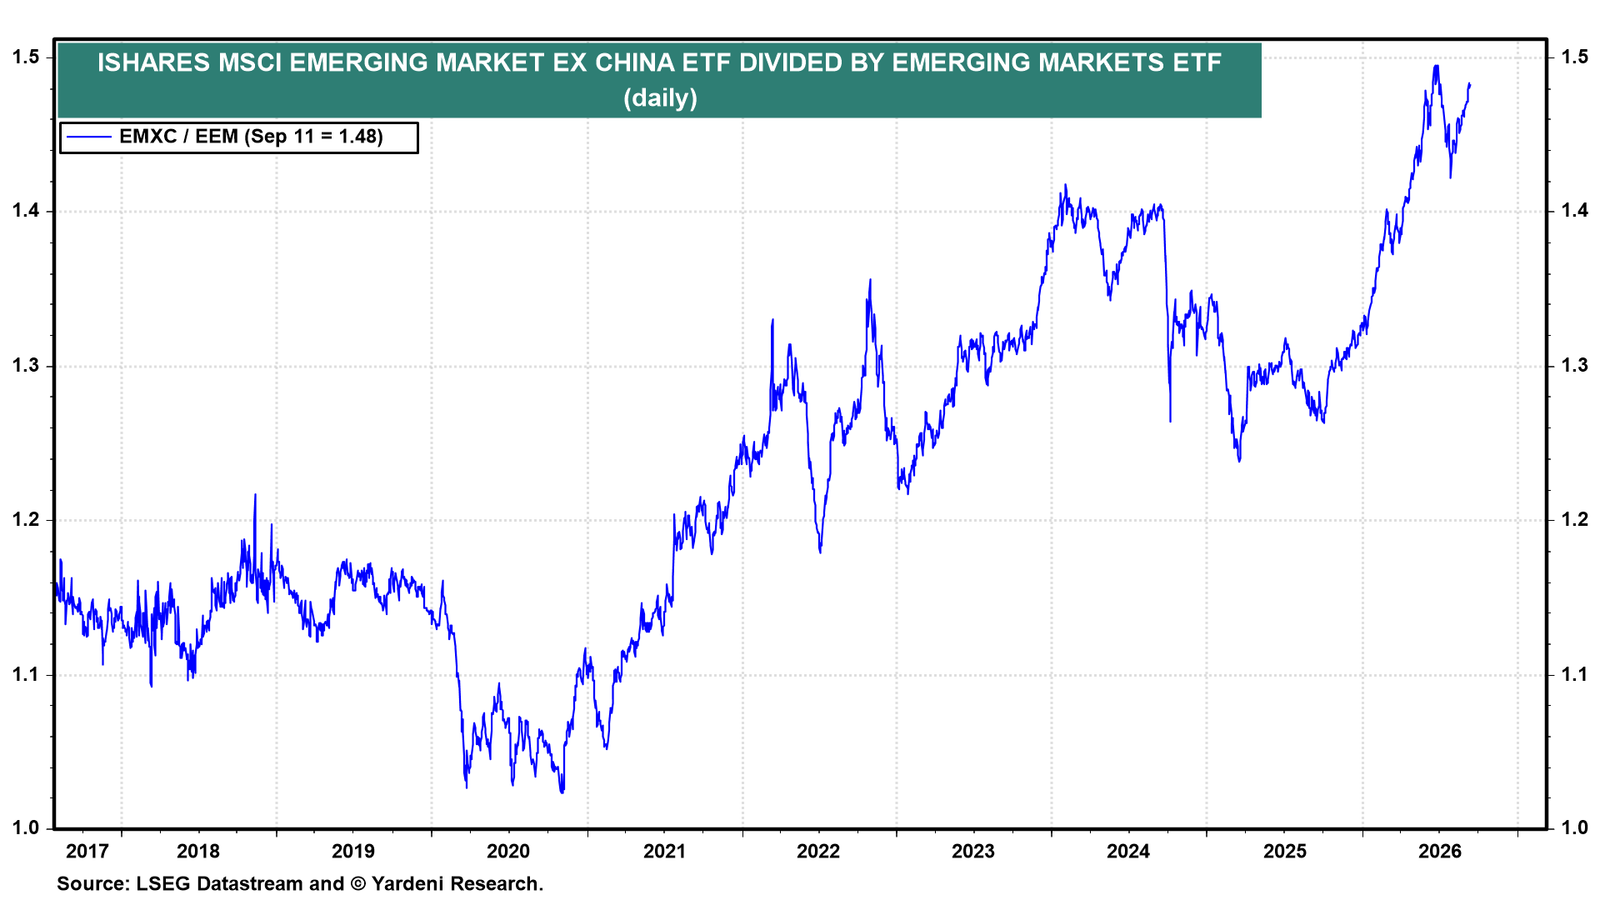
Within emerging markets, the Emerging Markets ex China ETF has pulled decisively ahead of the broader Emerging Markets one. The ratio of the two is just short of the record set earlier this year (chart). We have preferred the former to the latter for some time.
II. Earnings & Valuation
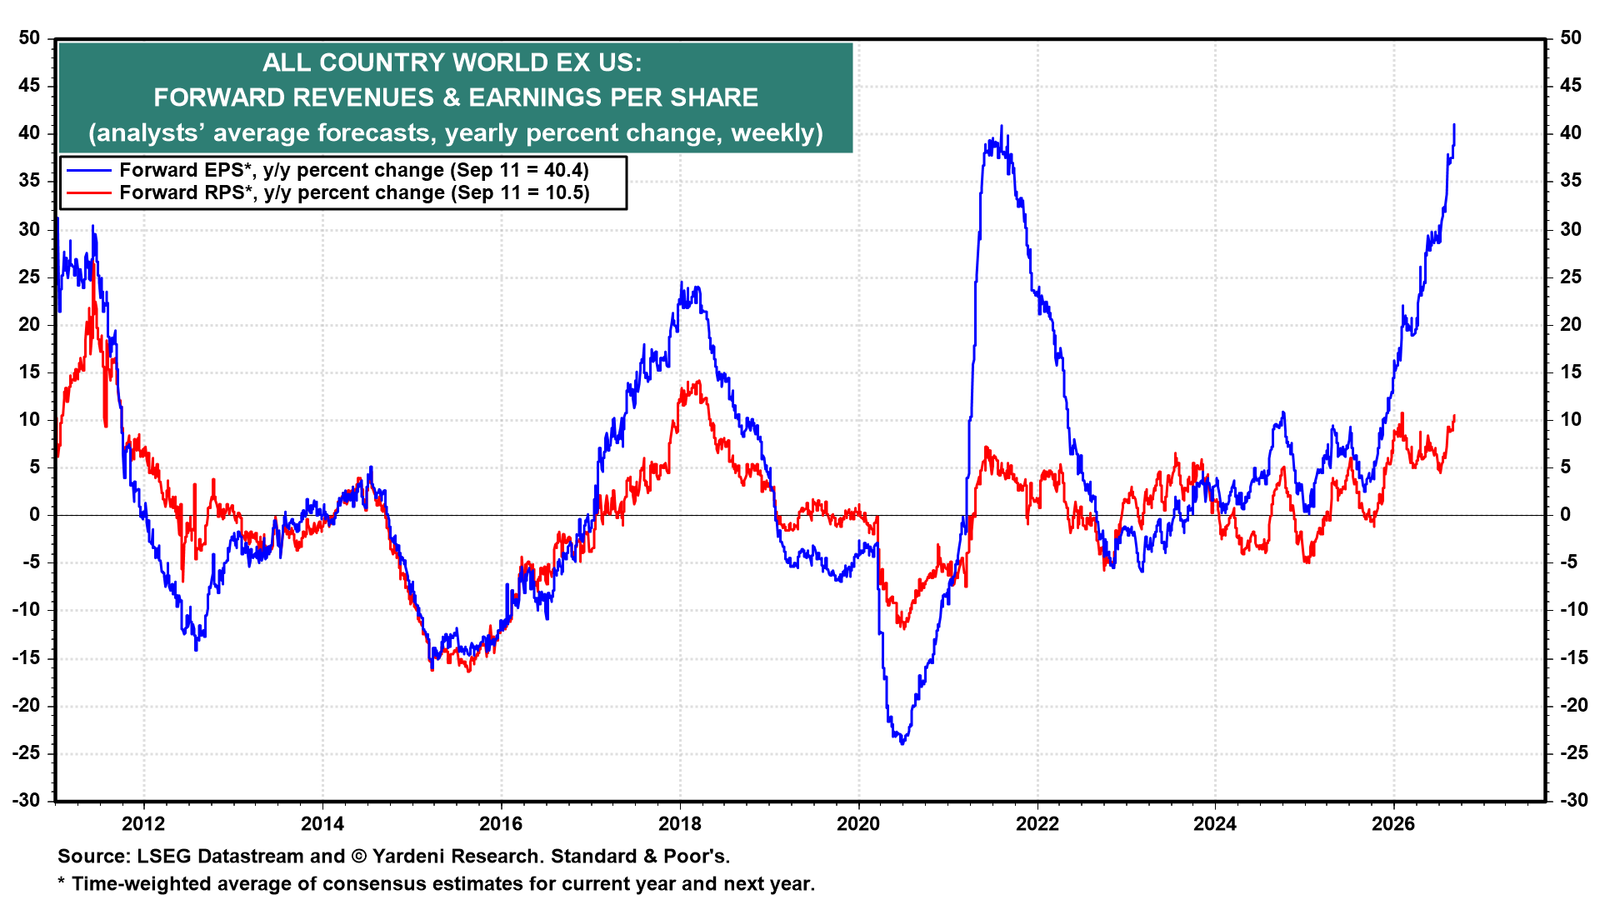
Overseas earnings are soaring, while overseas valuations have dropped. The ACW ex-US MSCI’s forward earnings is up 40.4% y/y, while its forward revenue is up 10.5% y/y (chart). This is reflected in the index's forward profit margin, which is at a record-high 12.6%.
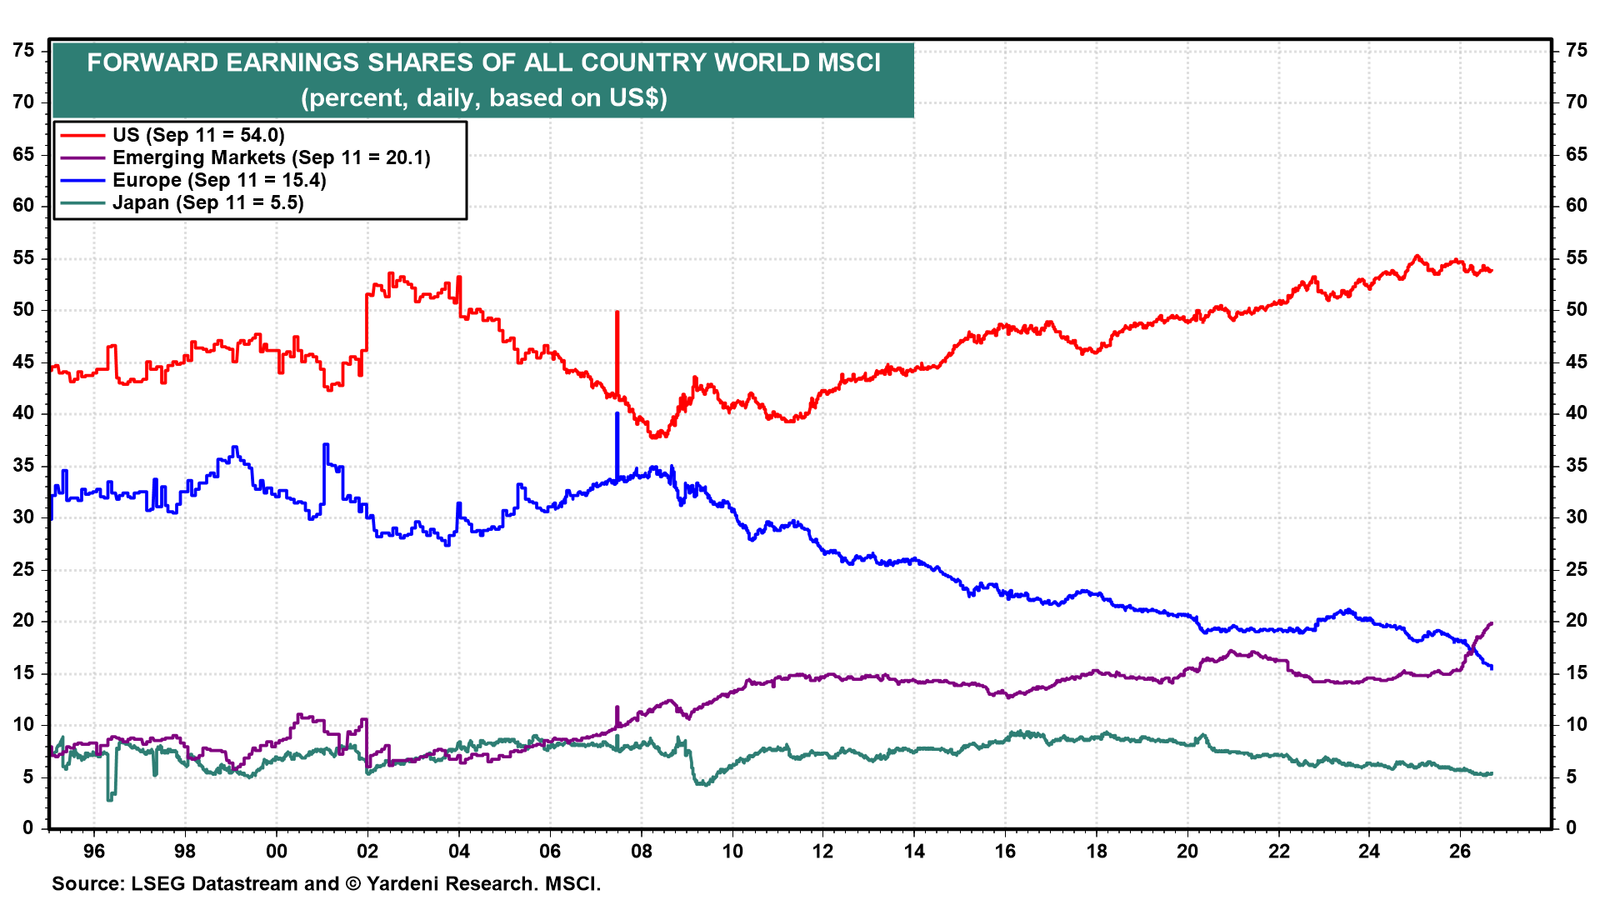
The US MSCI accounts for 54.0% of the ACW MSCI’s forward earnings but a heftier 63.8% of its market capitalization (chart). The Emerging Markets MSCI holds mirror-image shares: 20.1% of forward earnings but just 12.0% of market cap. Its earnings share is up sharply from 15.4% at the end of 2025, while Europe’s and Japan's earnings shares have fallen.
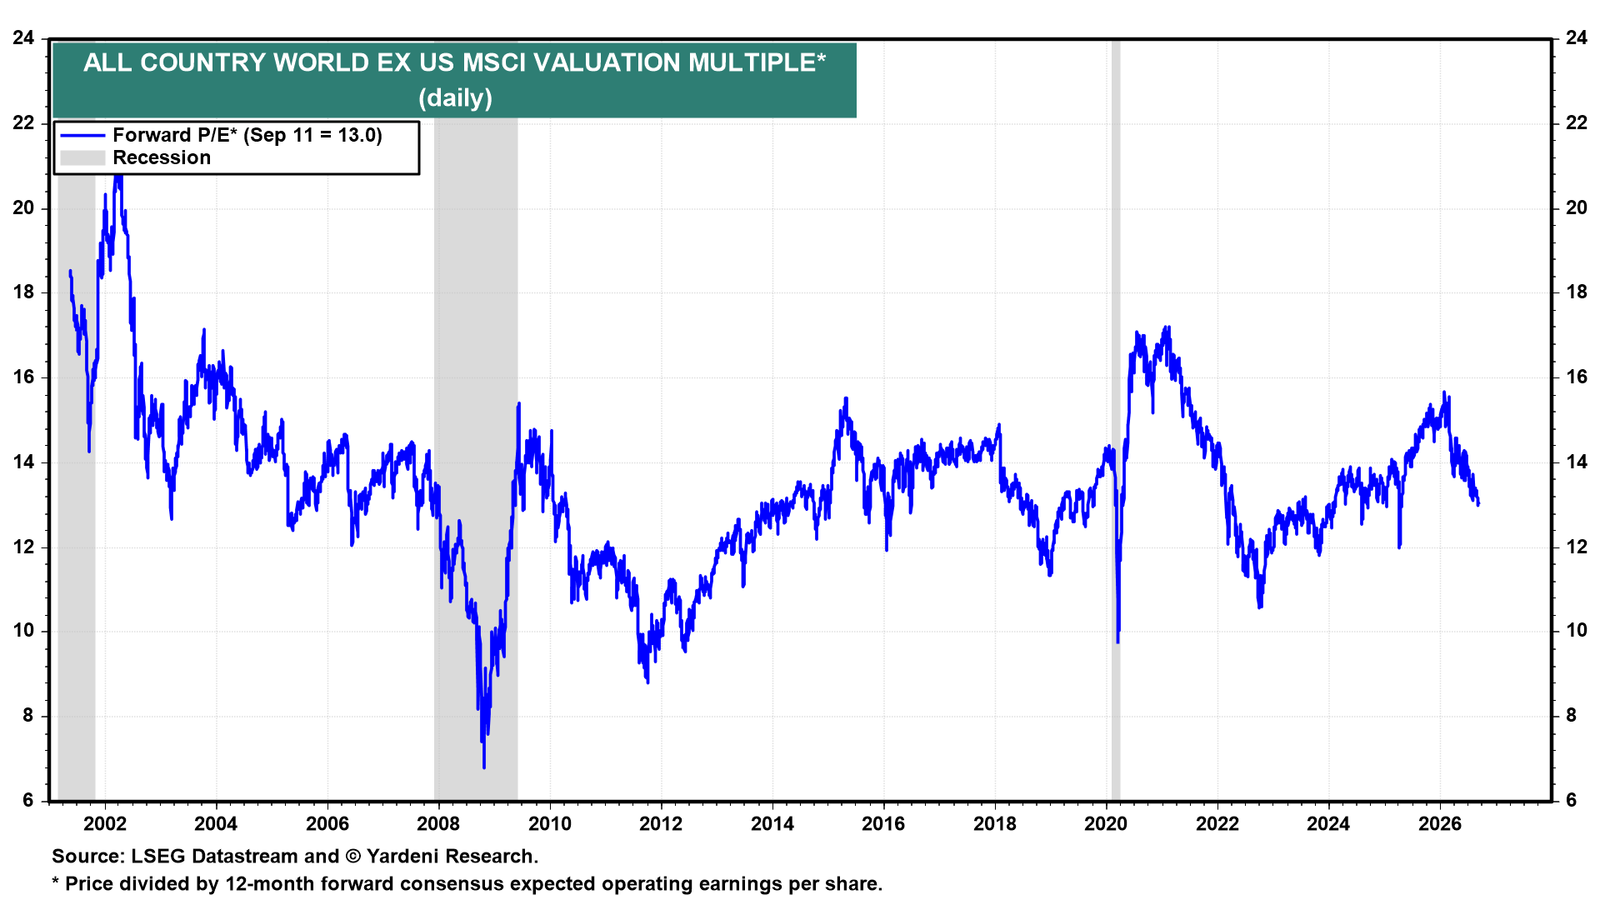
Meanwhile, the ACW ex-US MSCI trades at a 13.0 forward P/E, well below its 2021 peak of 17.2 (chart). Investors have resisted paying more for stocks that are delivering better earnings.
III. Global Bonds
Bond yields are rising nearly everywhere, and equities seem to be reading this development as mostly reflecting resilient economic and earnings growth. Australia's 10-year government bond yield is 5.37%, and the UK's is 5.35%, both above 5.00% (chart). The US’s, at 4.97%, is at the top end of the 4.00%-5.00% range we call the "old normal."
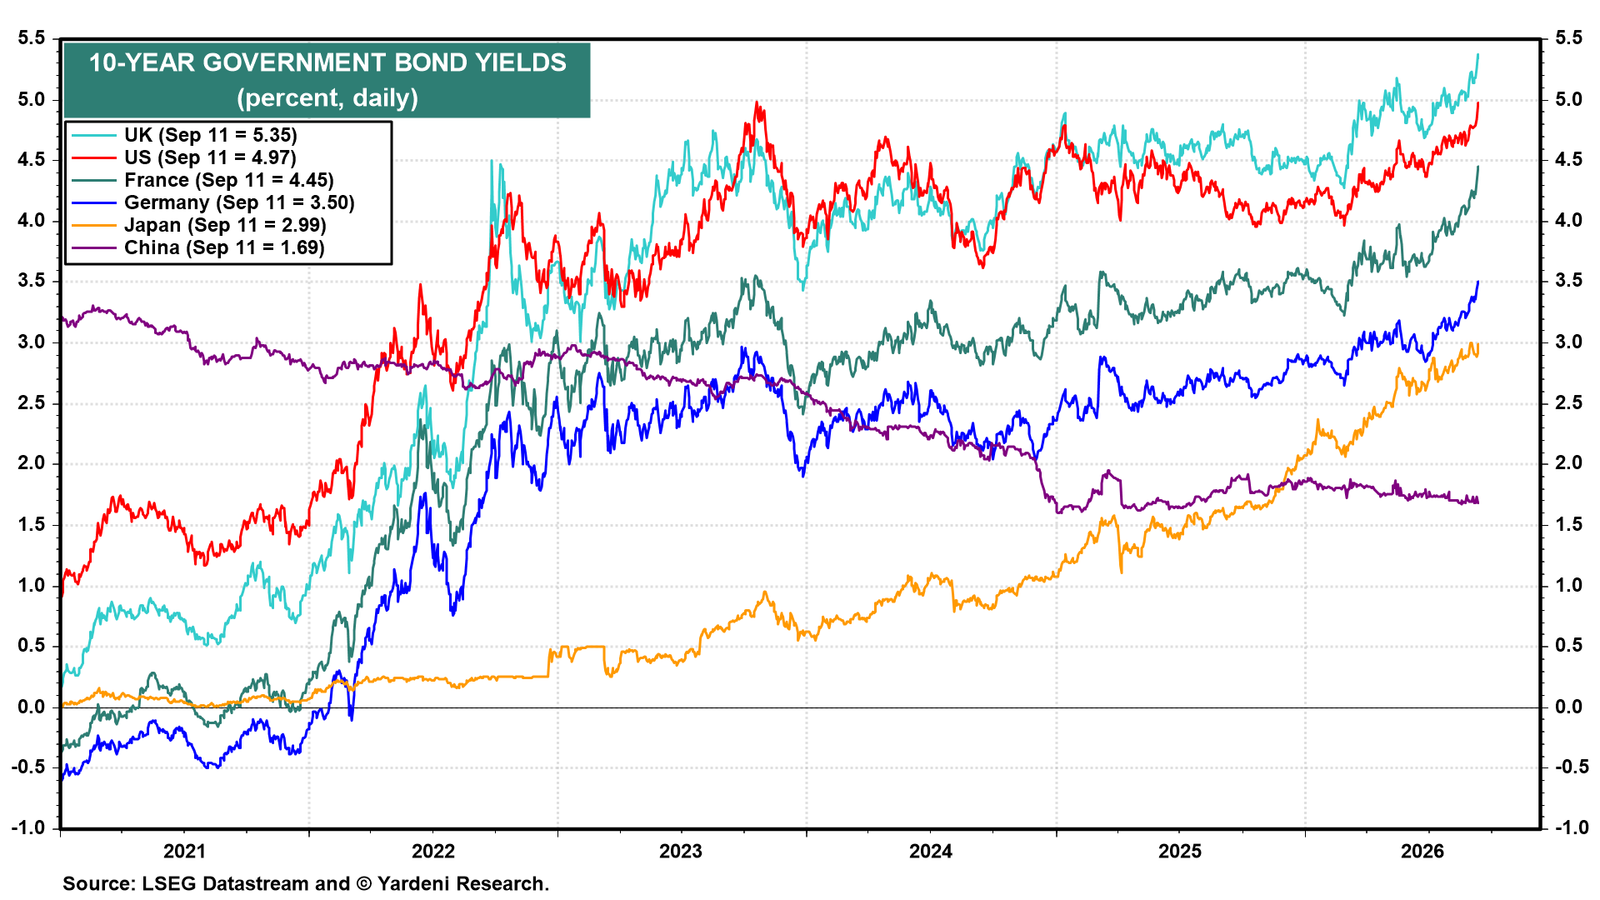
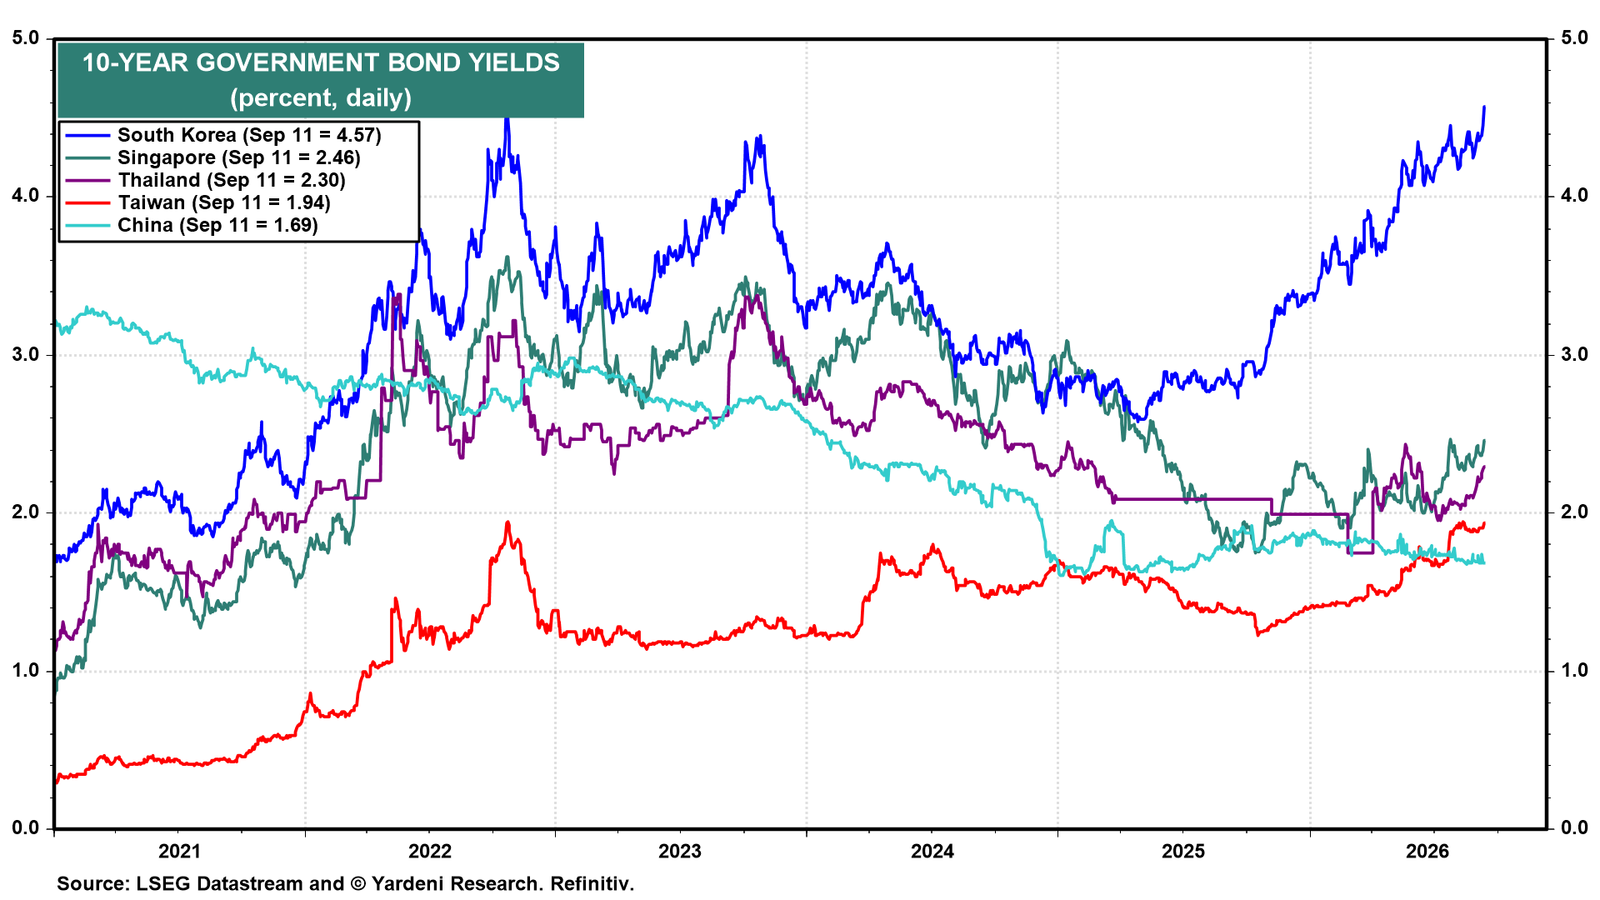
Over in Asia, South Korea's 10-year yield has climbed to 4.57%, the highest since 2022, while China's is 1.69% and still falling (chart). China remains the world's exception to the rising trend, reflecting that economy’s deflation.
IV. Commodities
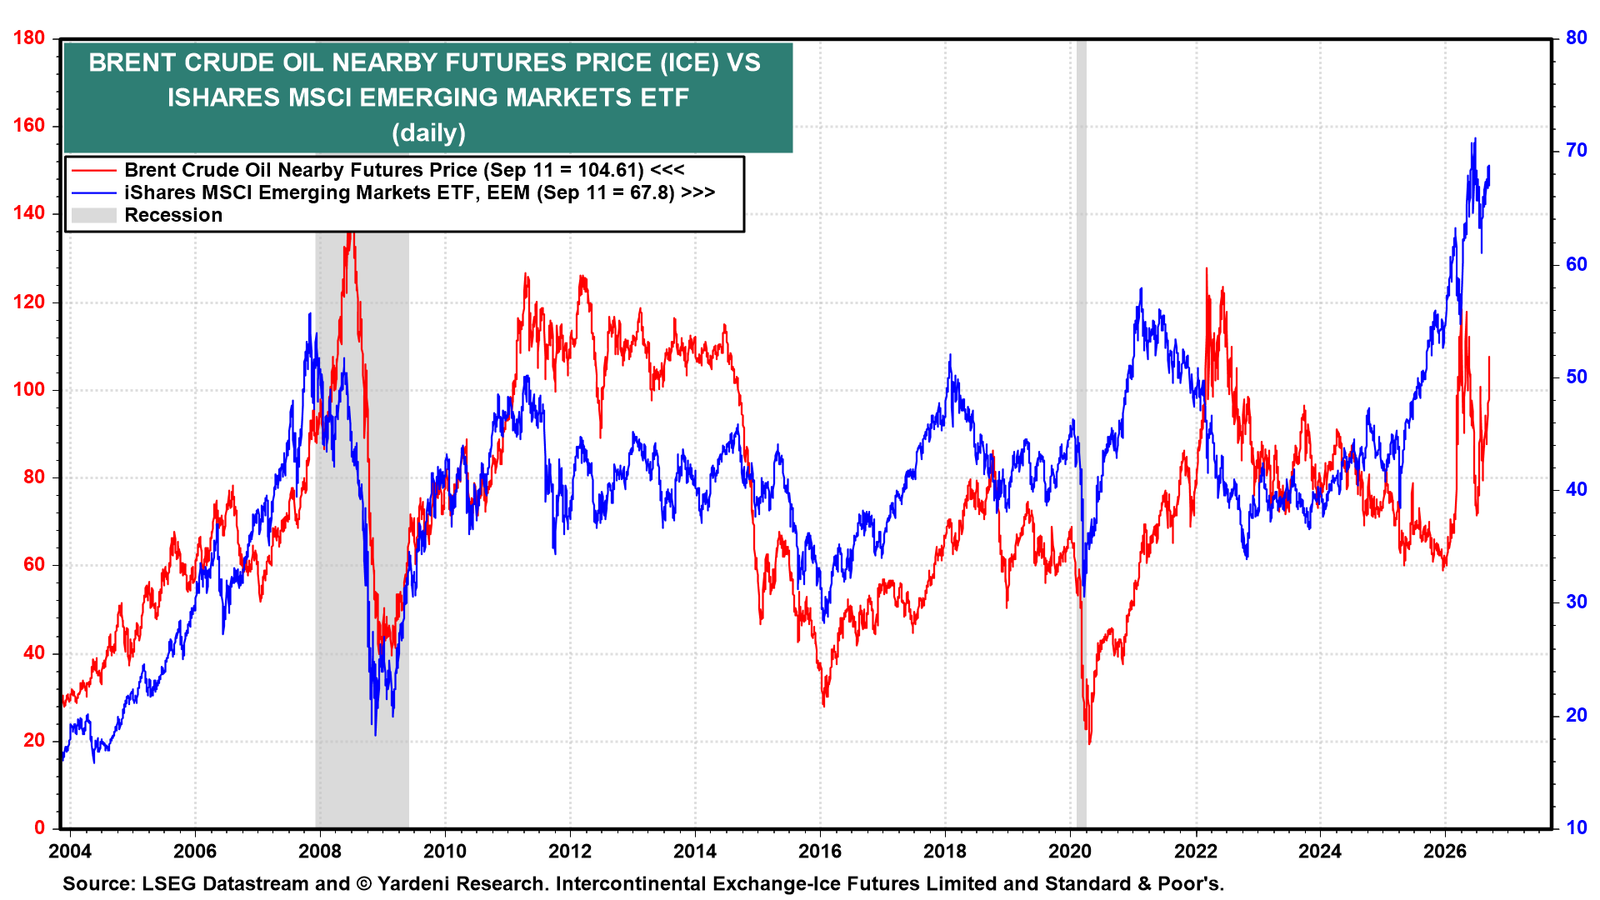
With the war's re-escalation, the price of Brent crude is back up to $104.61 a barrel. But that hasn’t stopped the Emerging Markets ETF from rising as well, to $67.8 as of September 11 (chart). So far, higher energy prices have not derailed the emerging markets trade the way they did in 2022.
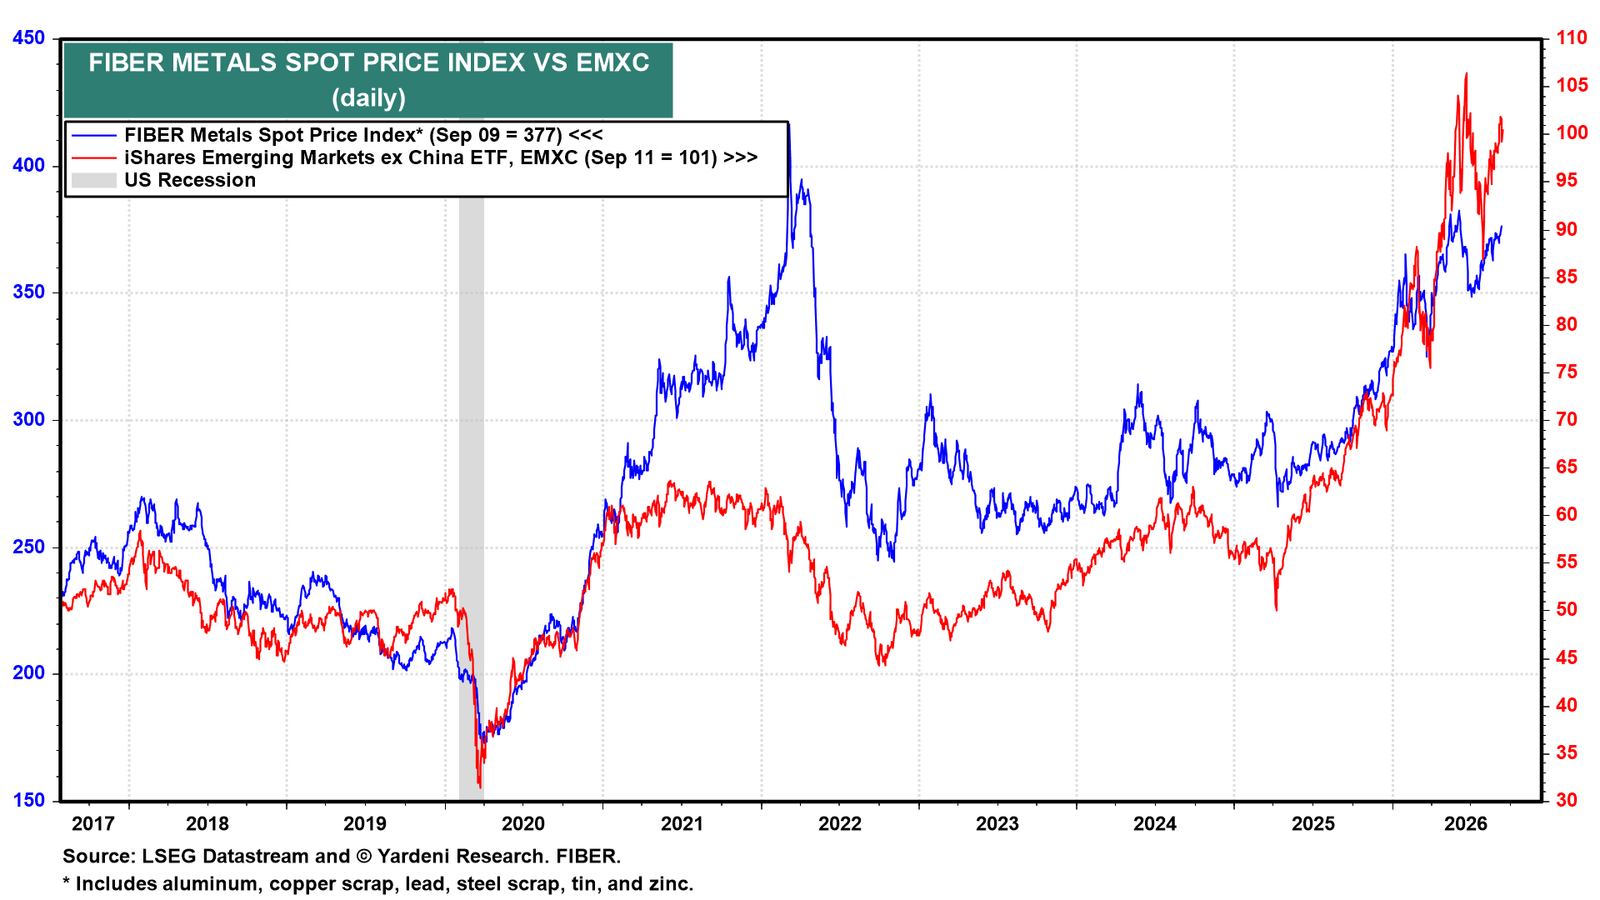
The FIBER Metals Spot Price Index is at 377, up sharply since late 2024, and the Emerging Markets ex China ETF is tracking it closely (chart). Industrial metals demand is holding up, a sign that the global economy is absorbing the shock oil and bond shocks.
V. Japan
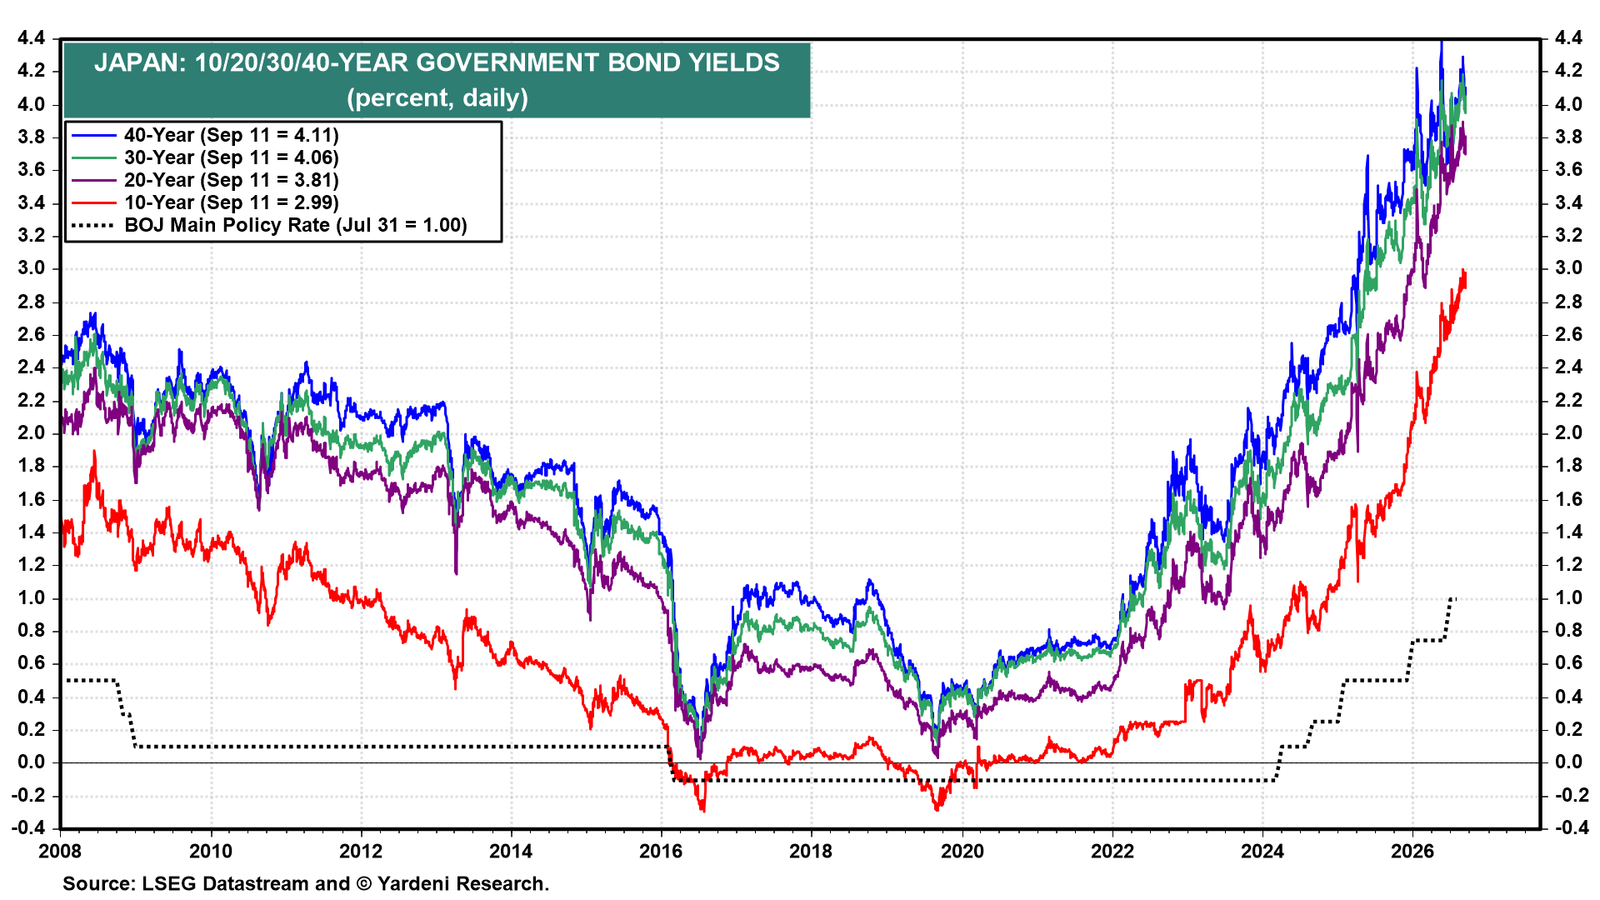
Japan has been at the epicenter of the global yield rout, with the BOJ set to hike rates this week. The Japanese government bond yield curve has steepened dramatically. The 40-year yield is 4.11%, the 30-year 4.06%, and the 10-year 2.99%, all against a policy rate of just 1.00% (chart). The long end has priced in considerably more tightening than the BOJ has delivered.
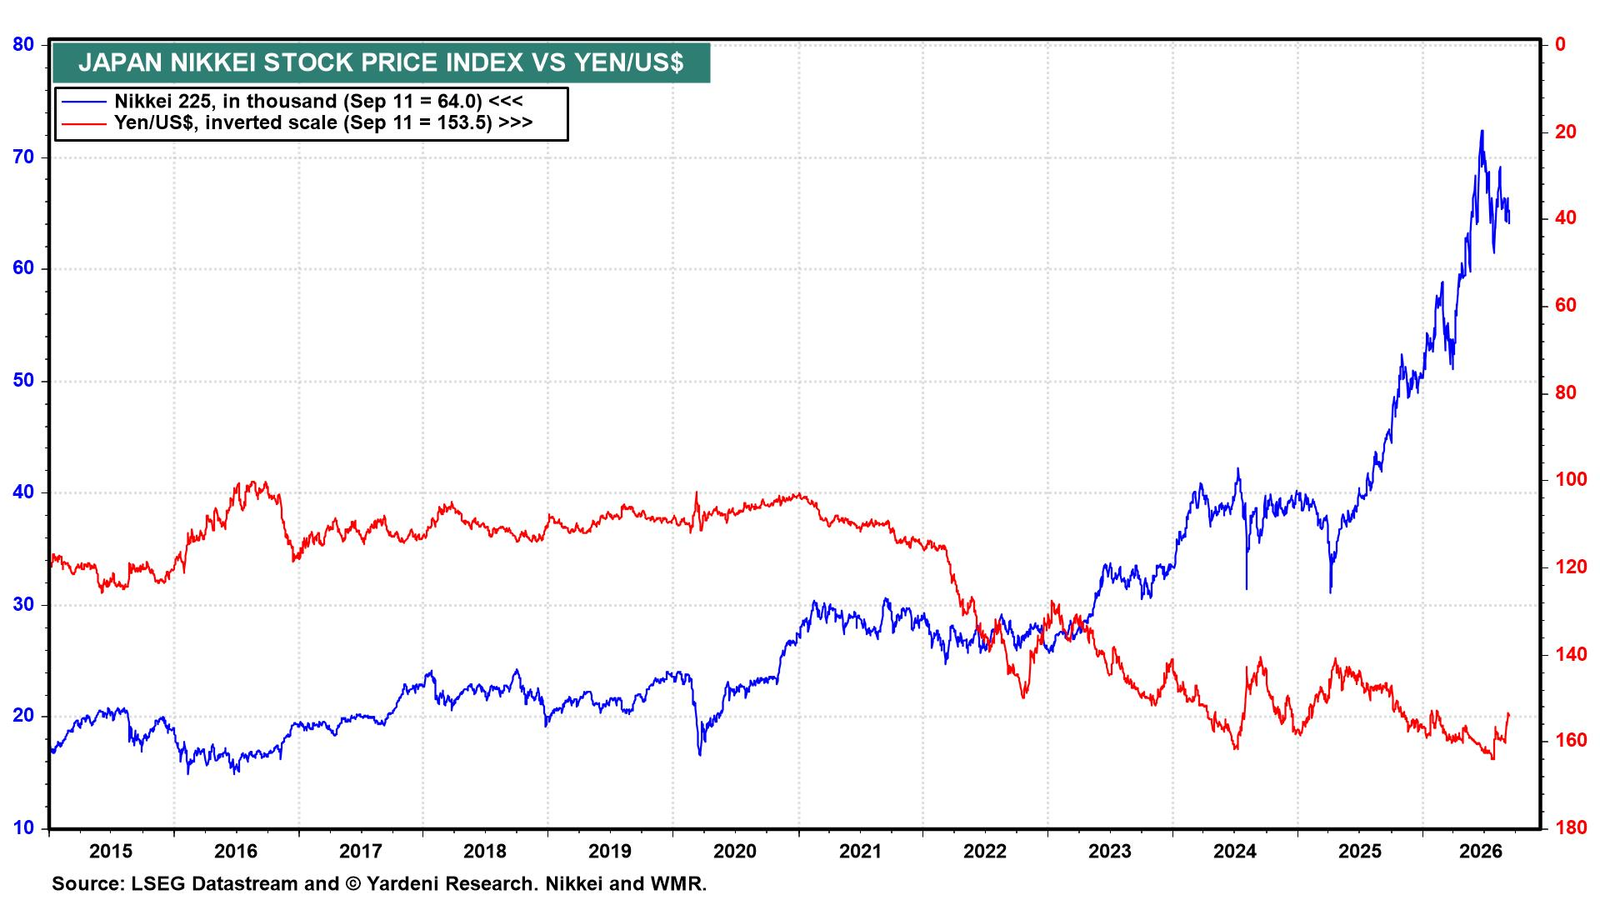
In recent years, the rising Nikkei and the weakening yen have been closely correlated (chart). This can be explained by exporters. A weaker yen lifts the translated earnings of Japan's large overseas revenue base, and the equity market rally has traded off the weakening currency for three years.
That relationship has reversed over the past month. The yen is up 3.72%, and the Nikkei is down 4.75%. Investors are now pricing in action by the BOJ, not the exporters.
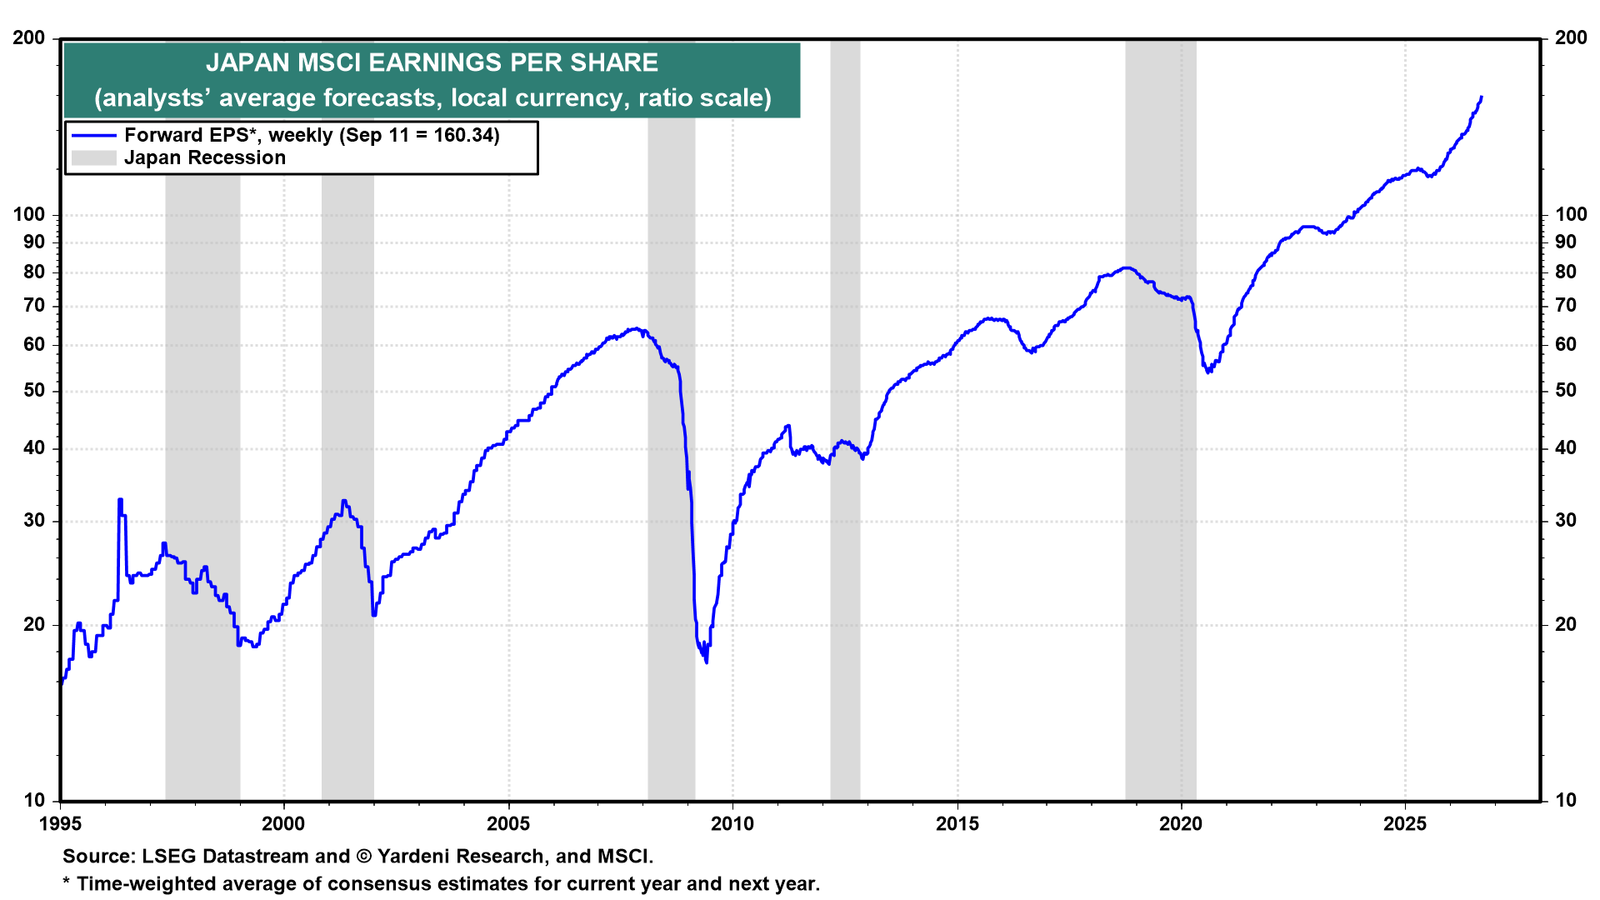
Despite concerns about rising interest rates and a strengthening currency, Japanese earnings keep climbing. Forward earnings per share is 160.34 yen, a record high (chart). Record earnings against a 15.5 forward P/E is not what a market looks like when monetary policy is about to break it.