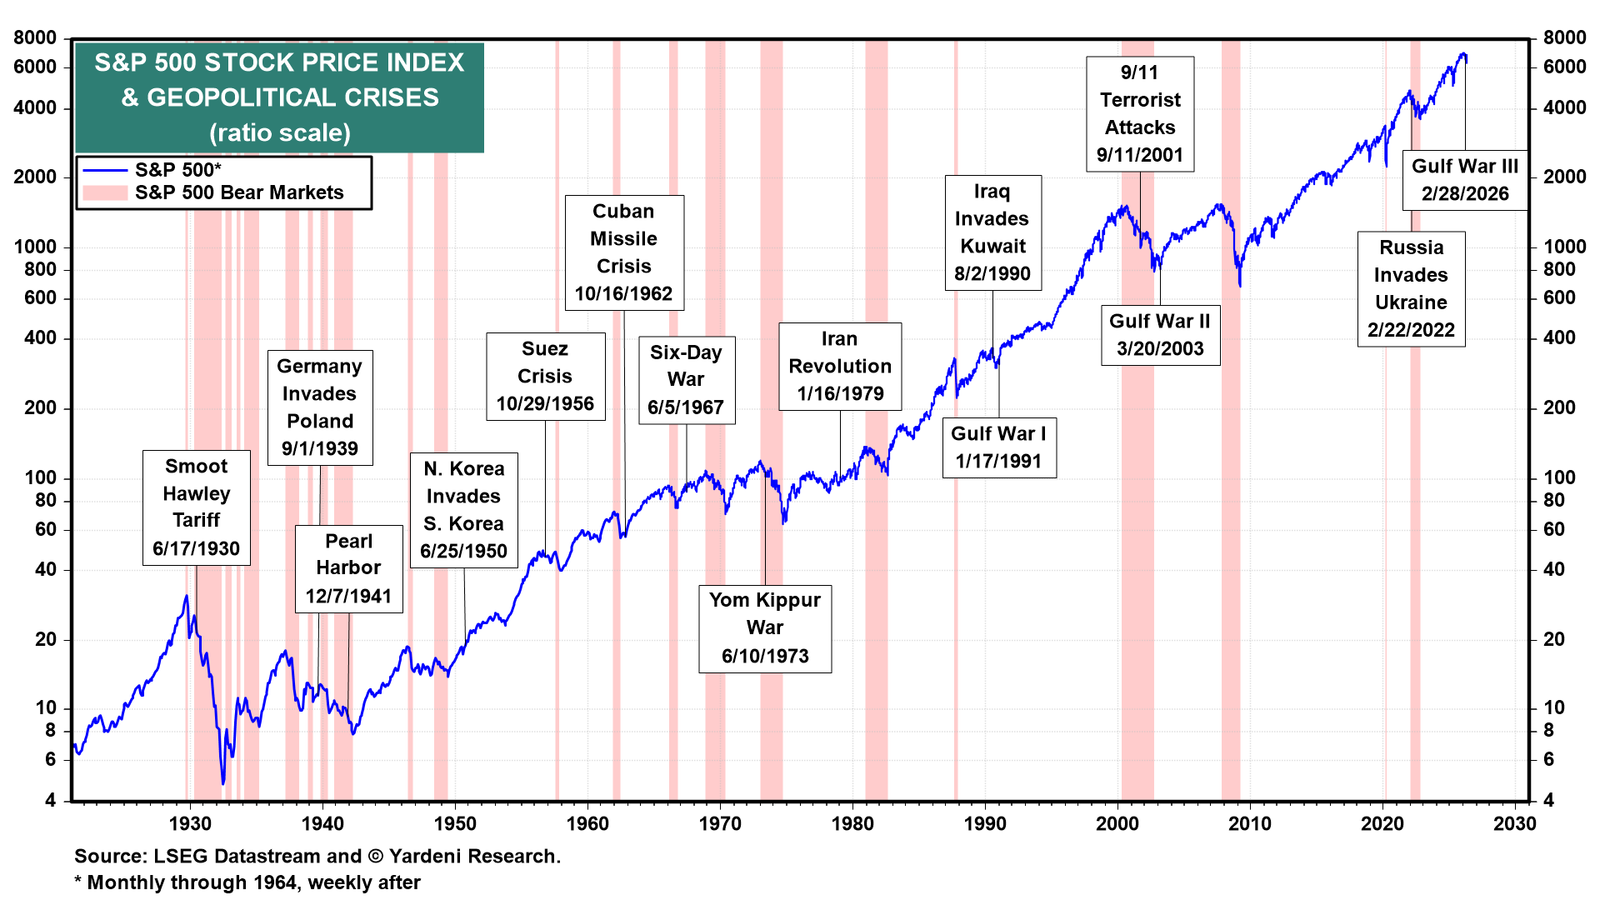
The S&P 500 is now up 1.3% since Friday, February 27, the day before Gulf War III started (chart). So as far as the stock market is concerned, the war is over until further notice. The index will be at a new record high tomorrow if it increases by more than 11.22 points! It has been yet another V-shaped buy-the-dip recovery in the S&P 500. It has also been another buying opportunity arising from a geopolitical crisis, as we previously observed when we called the March 30 bottom the following day.
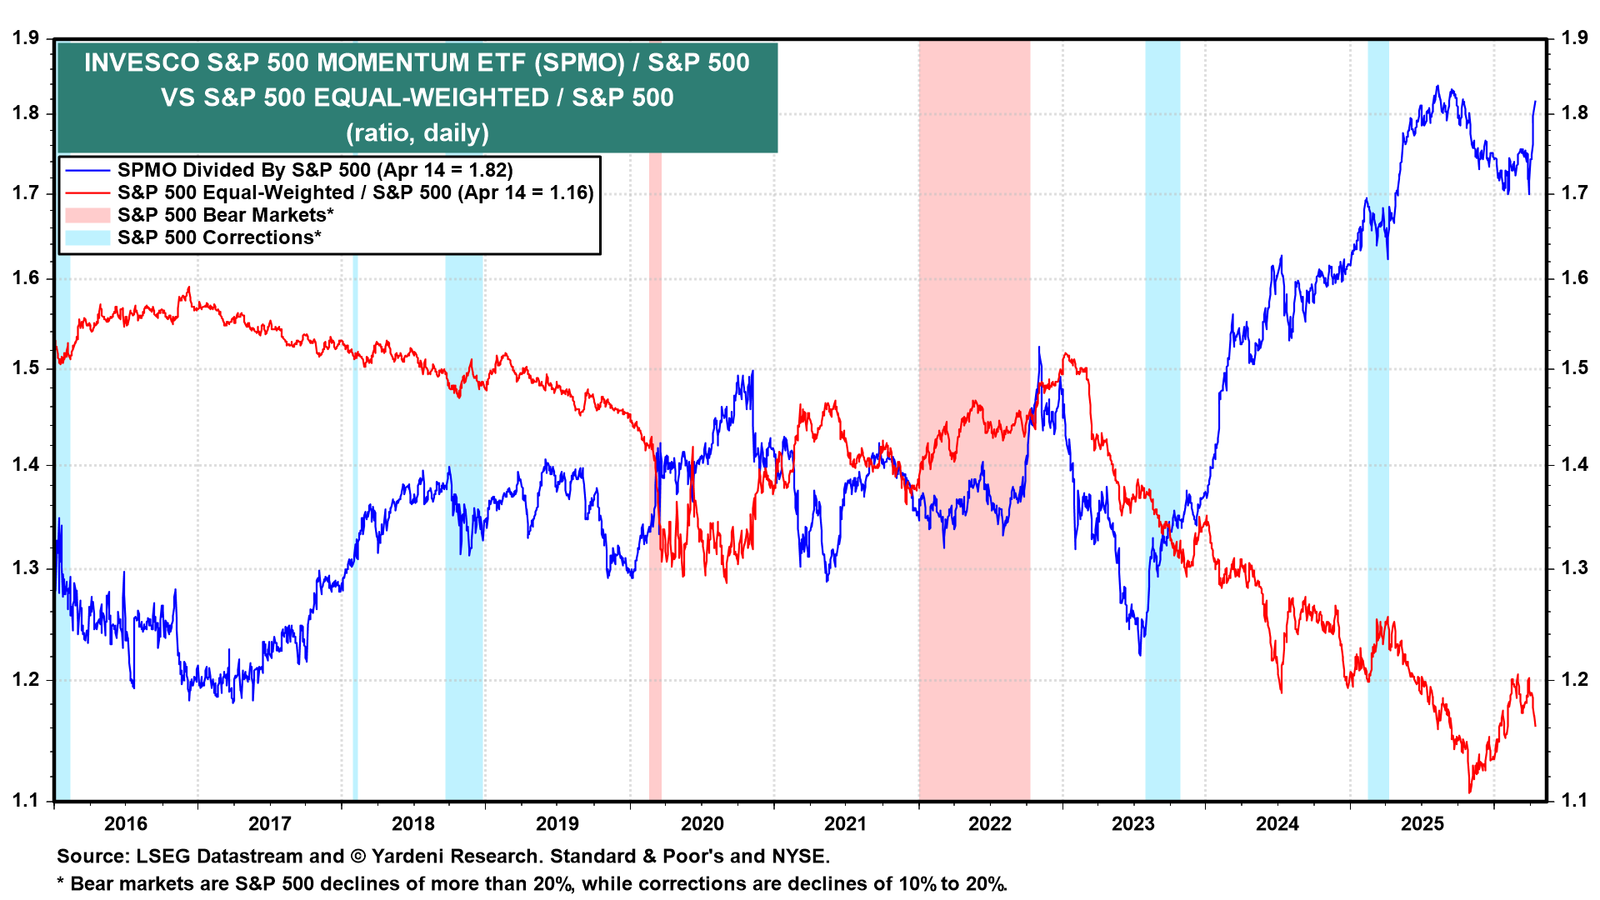
It has also been another momentum-led rebound, similar to last year's explosive rally that started on April 9, when President Donald Trump postponed his Liberation Day tariffs (chart). The S&P 500 equal-weighted index has underperformed the S&P 500 market-weighted index so far. Since the latest pullback bottomed on Monday, March 30, the former and the latter have risen 6.1% and 9.8%, respectively. Over this same period, the MAGS ETF is up 14.8%, while the XMAG ETF is up 8.1%.
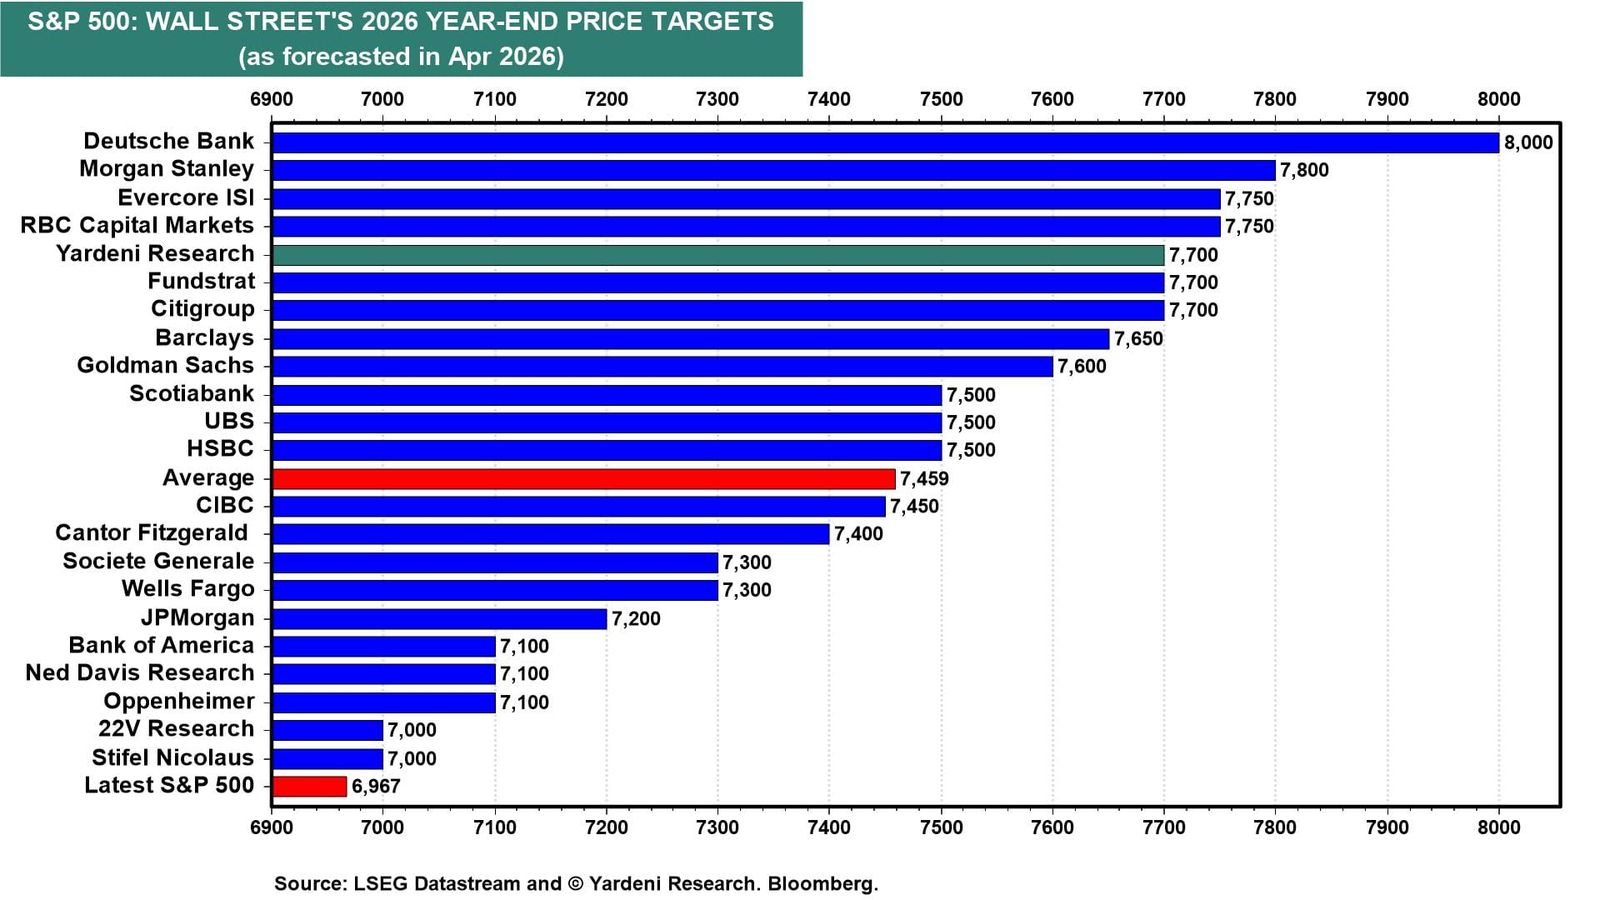
Interestingly, Wall Street's investment strategists didn't flinch. At the end of last year, they predicted, on average, that the year-end S&P 500 would be 7,555. Now, the average is about the same at 7,459. We are still at 7,700 (chart).
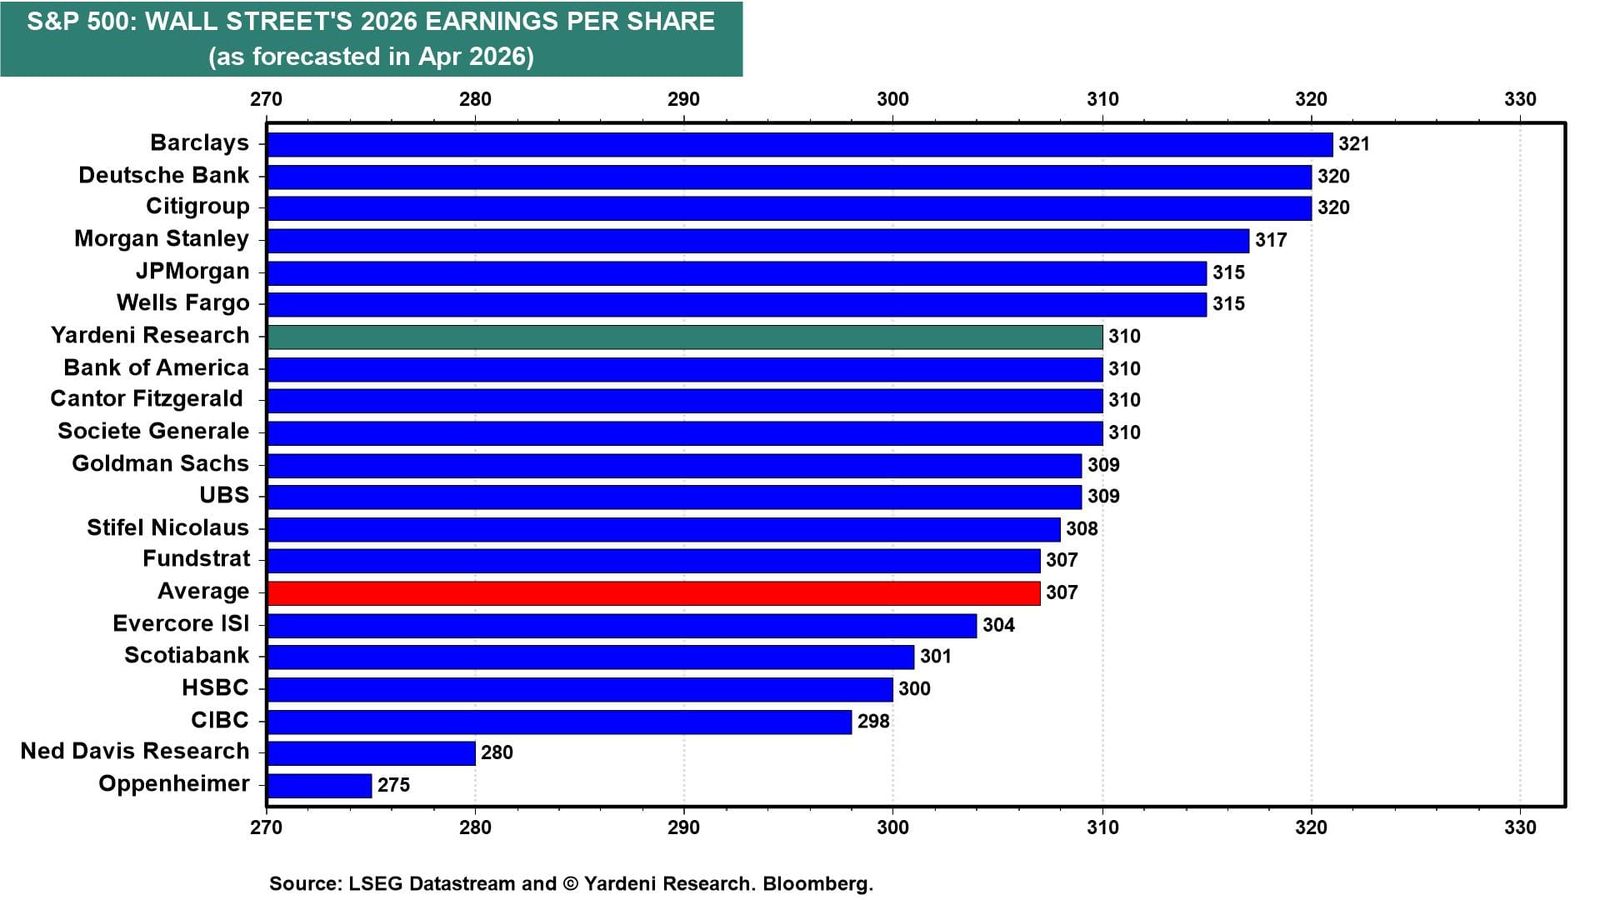
Also interesting is that, on average, Wall Street's strategists predict S&P 500 EPS of $307 this year, unchanged from their forecast at the end of last year (chart). As we noted yesterday, the consensus of industry analysts is $324. We are still at $310 and plan to raise our estimate again once the war is over.
While the war may be cooling down, inflation is heating up, led by rising energy costs. The question is, will these costs put upward pressure on core inflation? Today's March PPI report shows that it isn't happening yet. Consider the following:
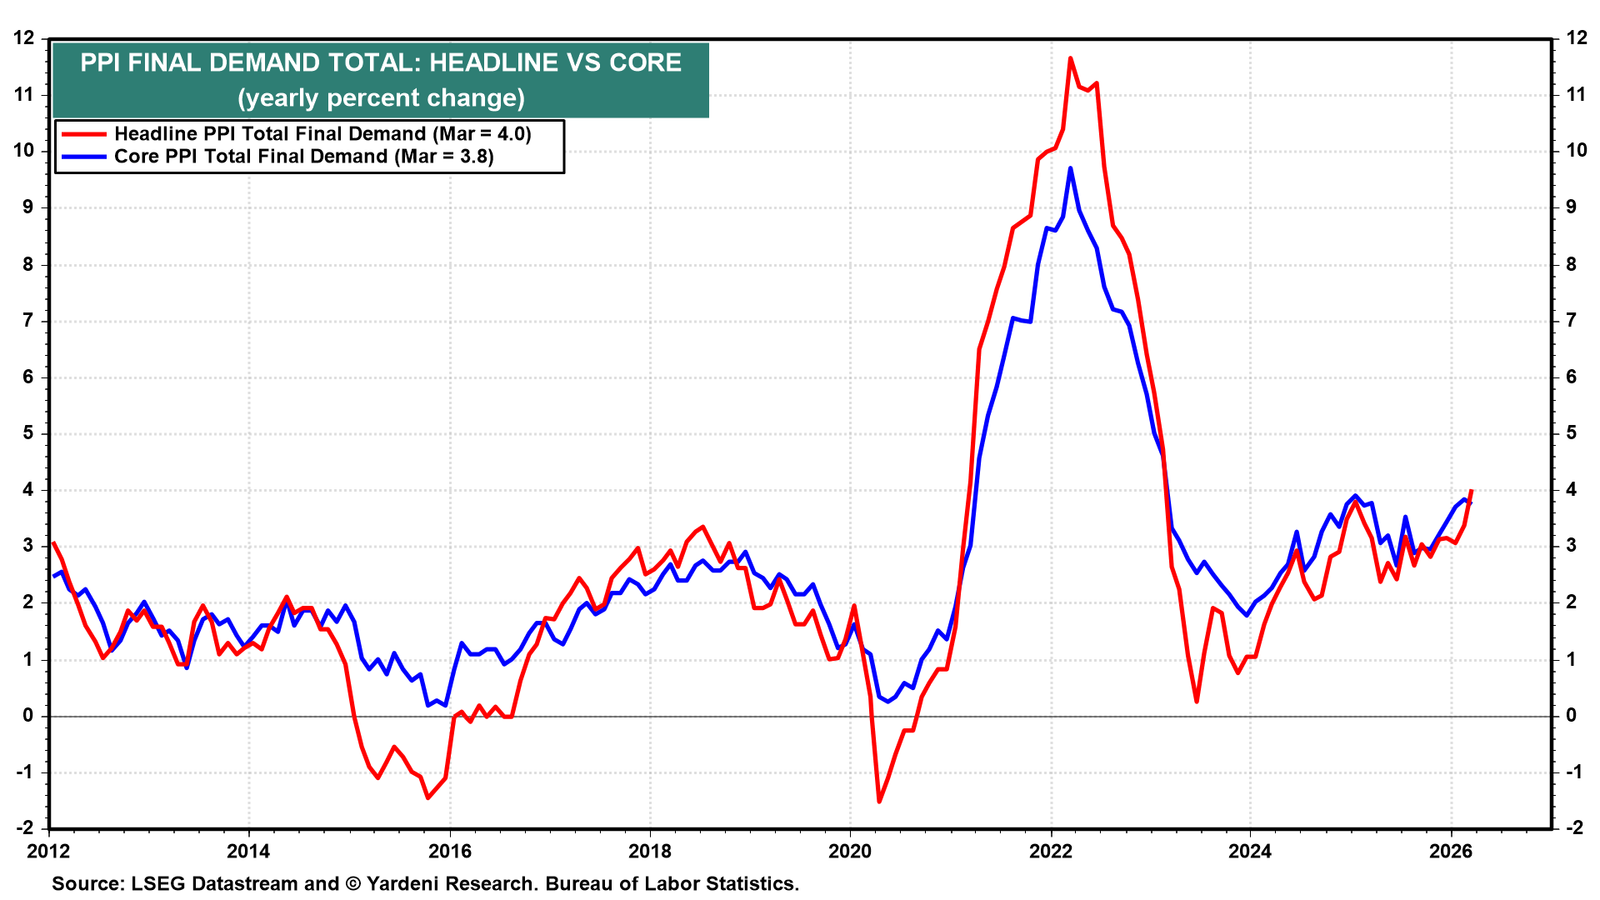
(1) March’s PPI report showed headline inflation at 4.0% y/y, the highest reading in more than three years (chart). The core rate edged down to 3.8% y/y, rising a mere 0.1% m/m.
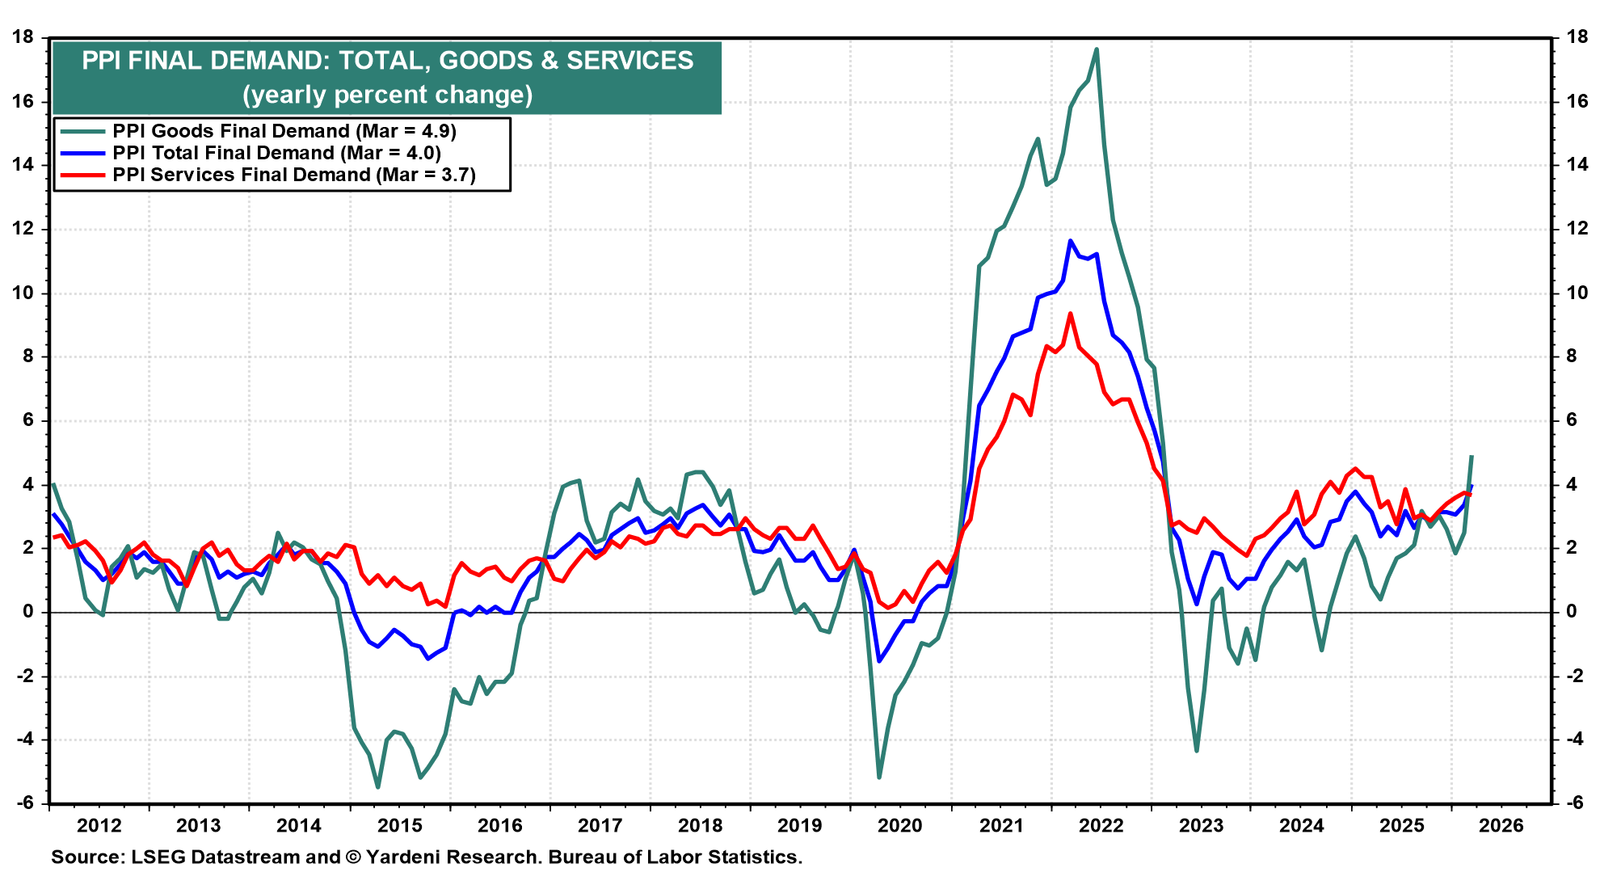
The headline increase was driven almost entirely by a rise in PPI goods inflation, which jumped 4.9% y/y, led by an 11.2% surge in energy prices. The spike in goods prices was moderated by services prices holding flat y/y (chart).
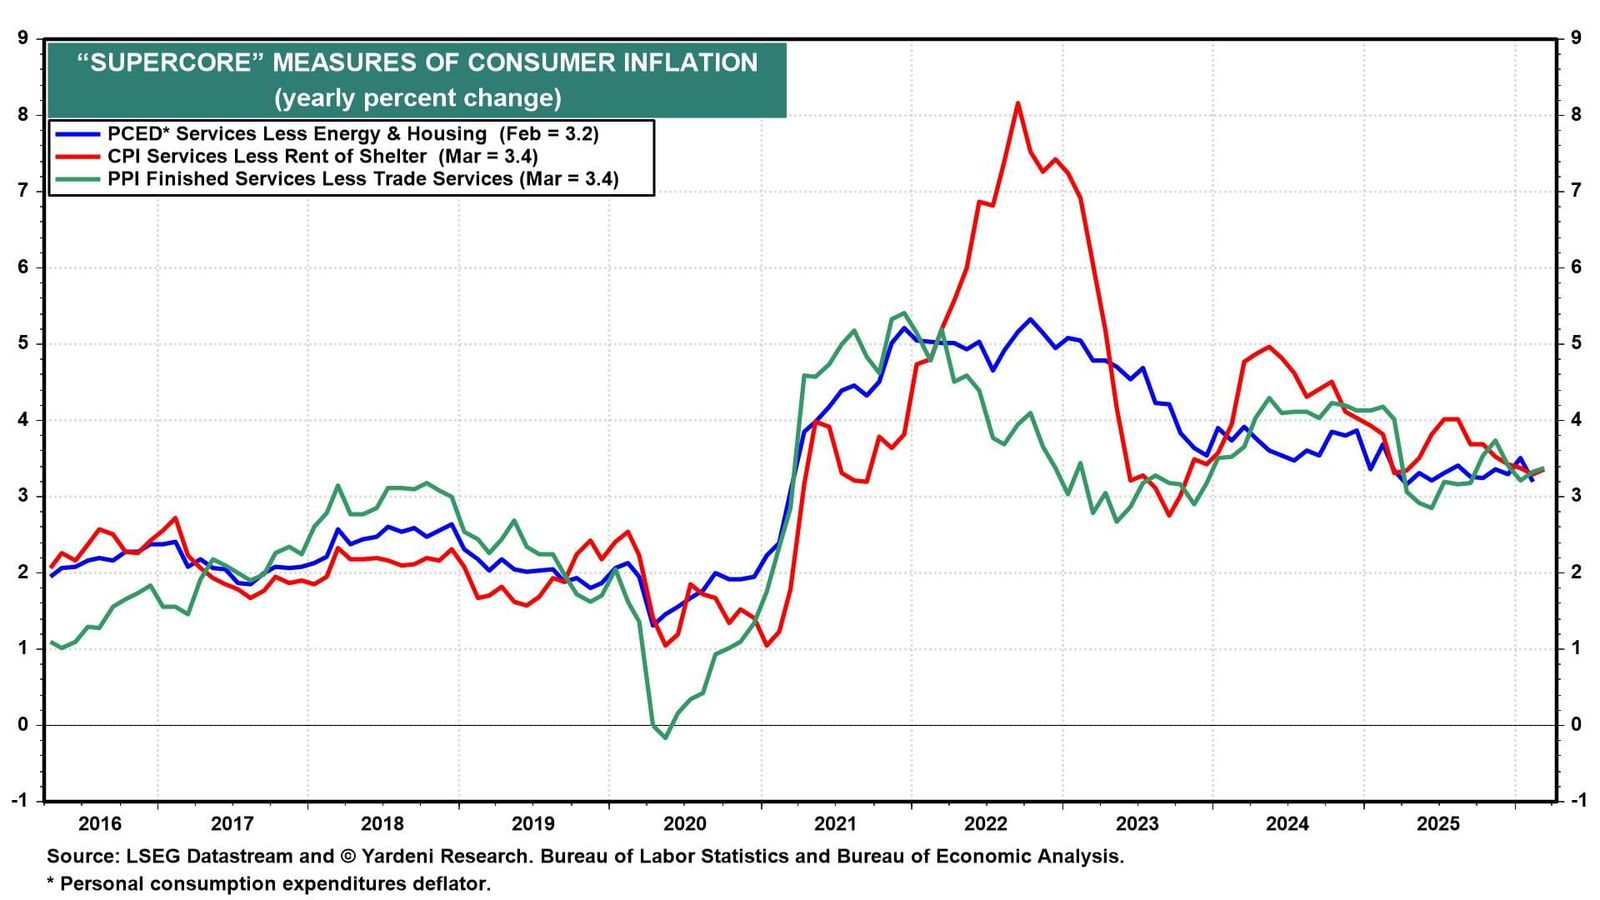
The March PPI report shows that the energy price shock hasn't yet spread to other prices. The "supercore measures" of consumer core services prices, excluding shelter, remain stuck around 3.4% (chart). That's well above the pre-pandemic pace of around 2% for these measures.
In our Roaring 2020s base case scenario, strong productivity gains will keep unit labor costs subdued in 2026. Also helping to offset the energy shock in the coming months should be the fading of last year's tariff shock and the ongoing moderating of rent inflation.