Bond yields rose yet again today even though September's PCED inflation report showed some improvement, which was due mostly to new measurement procedures. Inflation remains about a percentage point above the Fed's 2.0% target. Other economic indicators today confirmed that the economy and the labor market are doing very well and strengthened the case for more Fed rate hikes. Yesterday's dovish suggestion by NY Fed President John Williams that a pause in rate hikes might make sense was all but forgotten today.
The most optimistic explanation for the backup in bond yields is that it reflects better-than-expected economic growth, suggesting the economy's R-Star (i.e., the neutral interest rate) is higher than Fed officials thought at the beginning of the year. Back then, they mostly agreed that the federal funds rate was still slightly restrictive, i.e., above the neutral rate. Now, they agree with Fed Chair Kevin Warsh that September's 25bps rate hike "removed a dose of accommodation." That implies that the federal funds rate is below neutral.
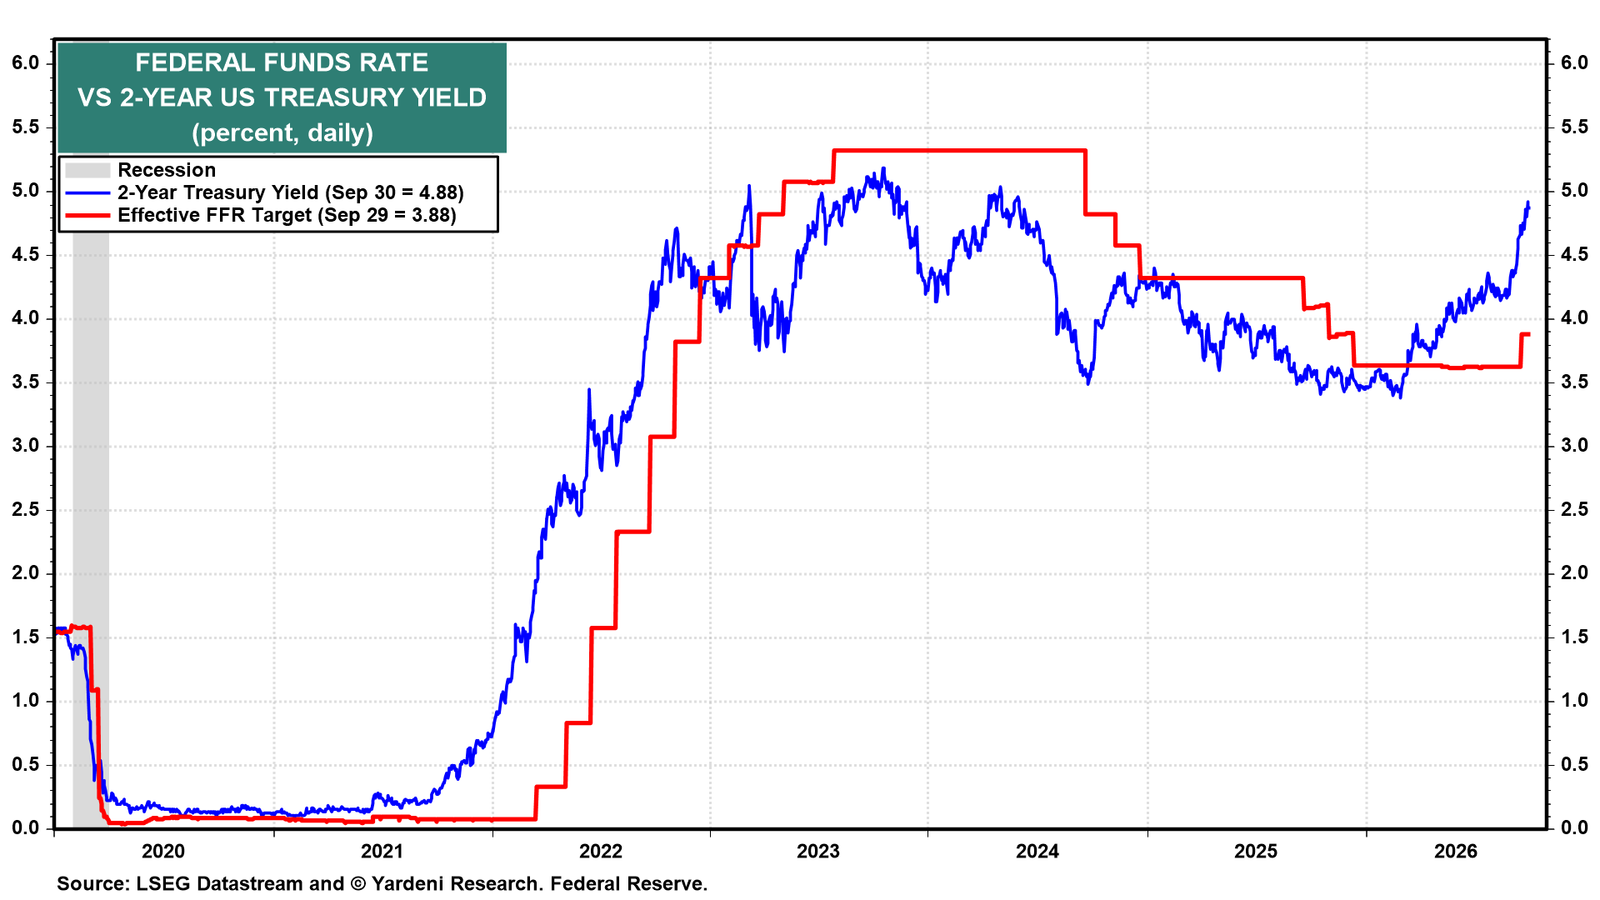
No wonder the 2-year Treasury yield remained 100bps above the federal funds rate today (chart).
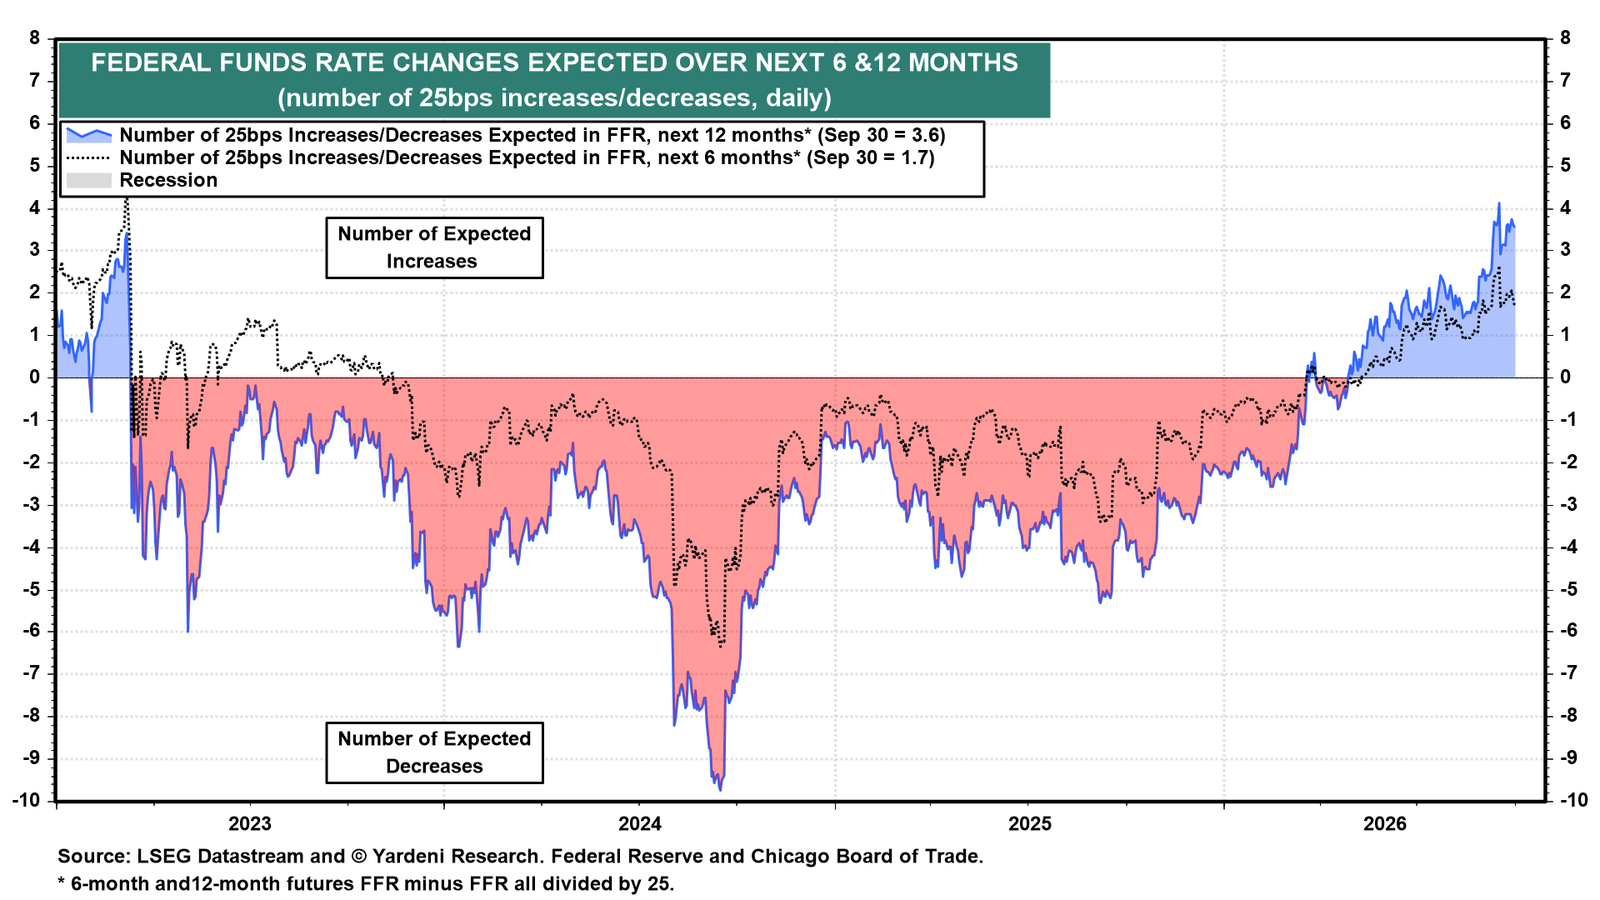
Federal funds futures are pricing in three to four 25bps rate hikes over the next 12 months, including roughly two over the next six months (chart).
Let's review the latest data:
(1) Inflation. Today’s August PCED report confirmed that the strong US economy still has an inflation problem. Headline PCED rose 0.3% m/m and 3.4% y/y, while core PCED increased 0.2% m/m and 3.0% y/y. Both remain well above the Fed’s 2% target.
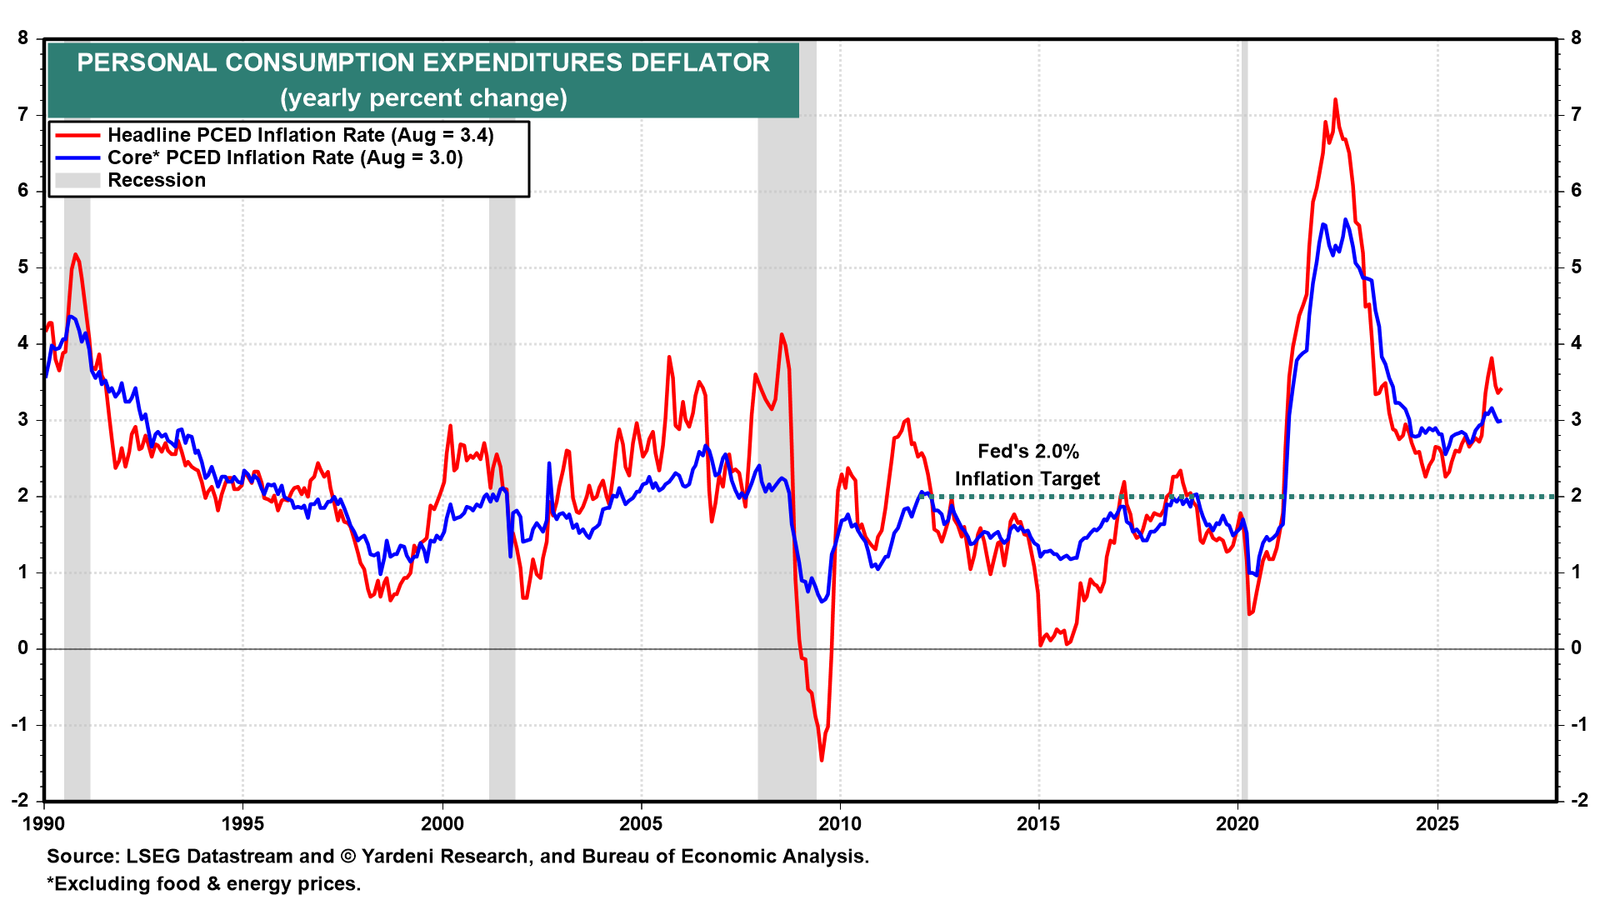
The August PCED report incorporated the annual revisions and methodological changes implemented by the Bureau of Economic Analysis. July's headline PCED inflation rate was revised down 37bps, to 2.98% y/y from 3.35%, while core PCED was cut 34bps, to 3.36% from 3.70%. The key point is that much of the recent decline in core PCED inflation reflects revised measurement procedures rather than a genuine improvement in underlying inflation.
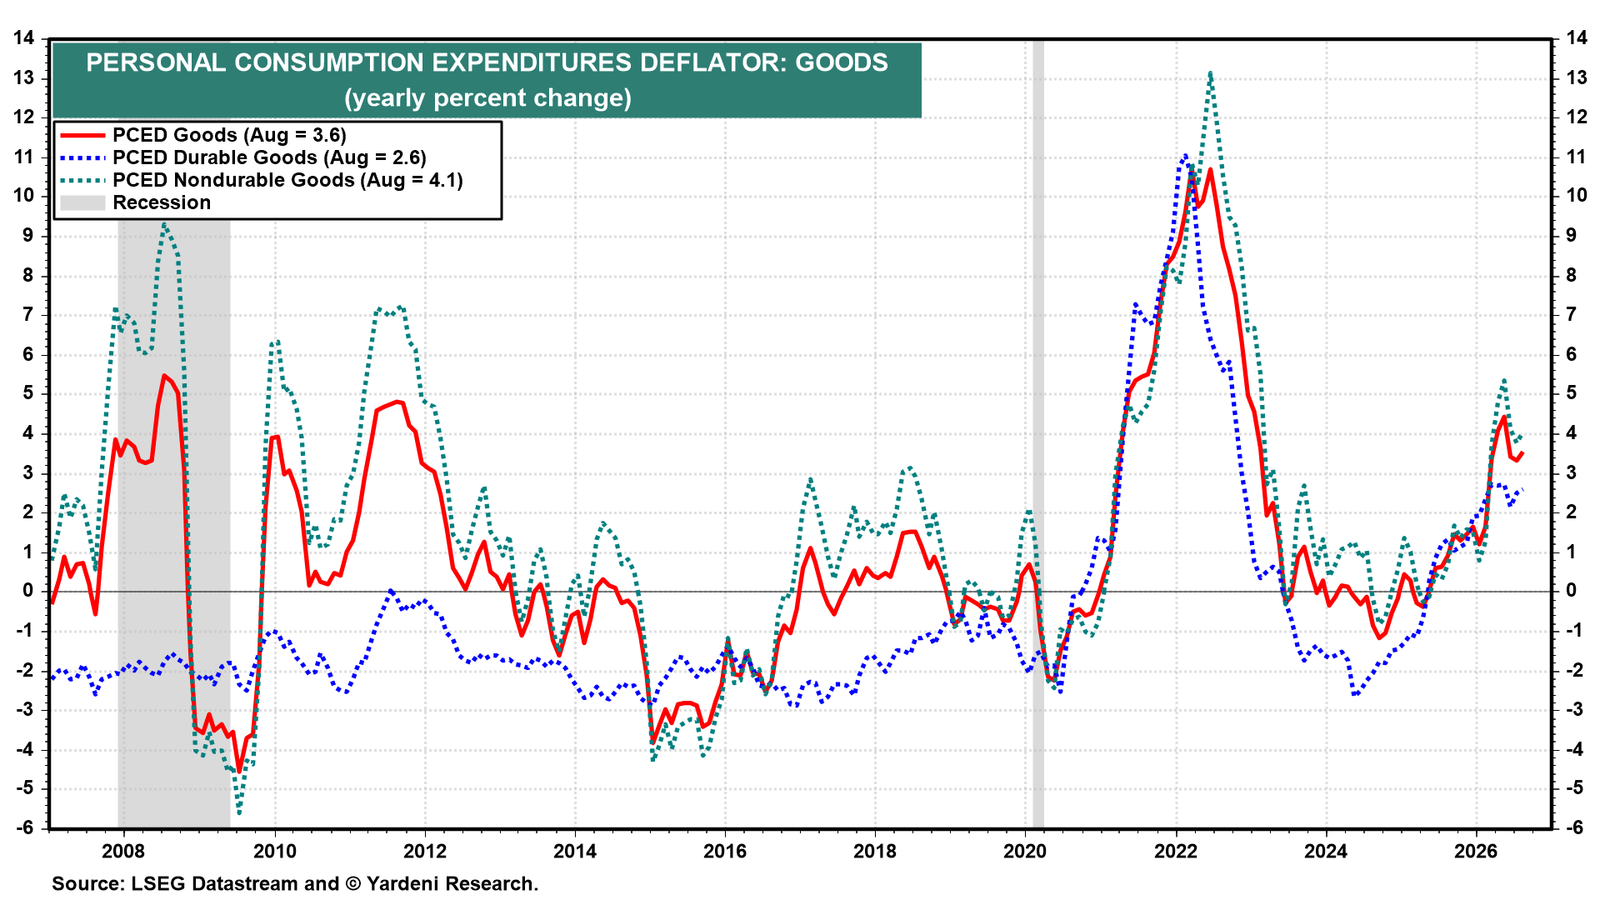
Indeed, despite the methodological changes, the report's details point to sticky underlying inflation. Goods PCED inflation rose to 3.6% y/y in August from 3.3% in July, partly reflecting a 4.1% m/m jump in gasoline prices (chart). Tariffs and the AI buildout added further pressure: prices for computers and peripherals surged 3.8% m/m, while toy prices rose 2.0%.
Looking ahead, tariff pass-through and AI-related demand should keep goods inflation elevated, while the renewed rise in oil and refined-product prices in September adds another source of upward pressure.
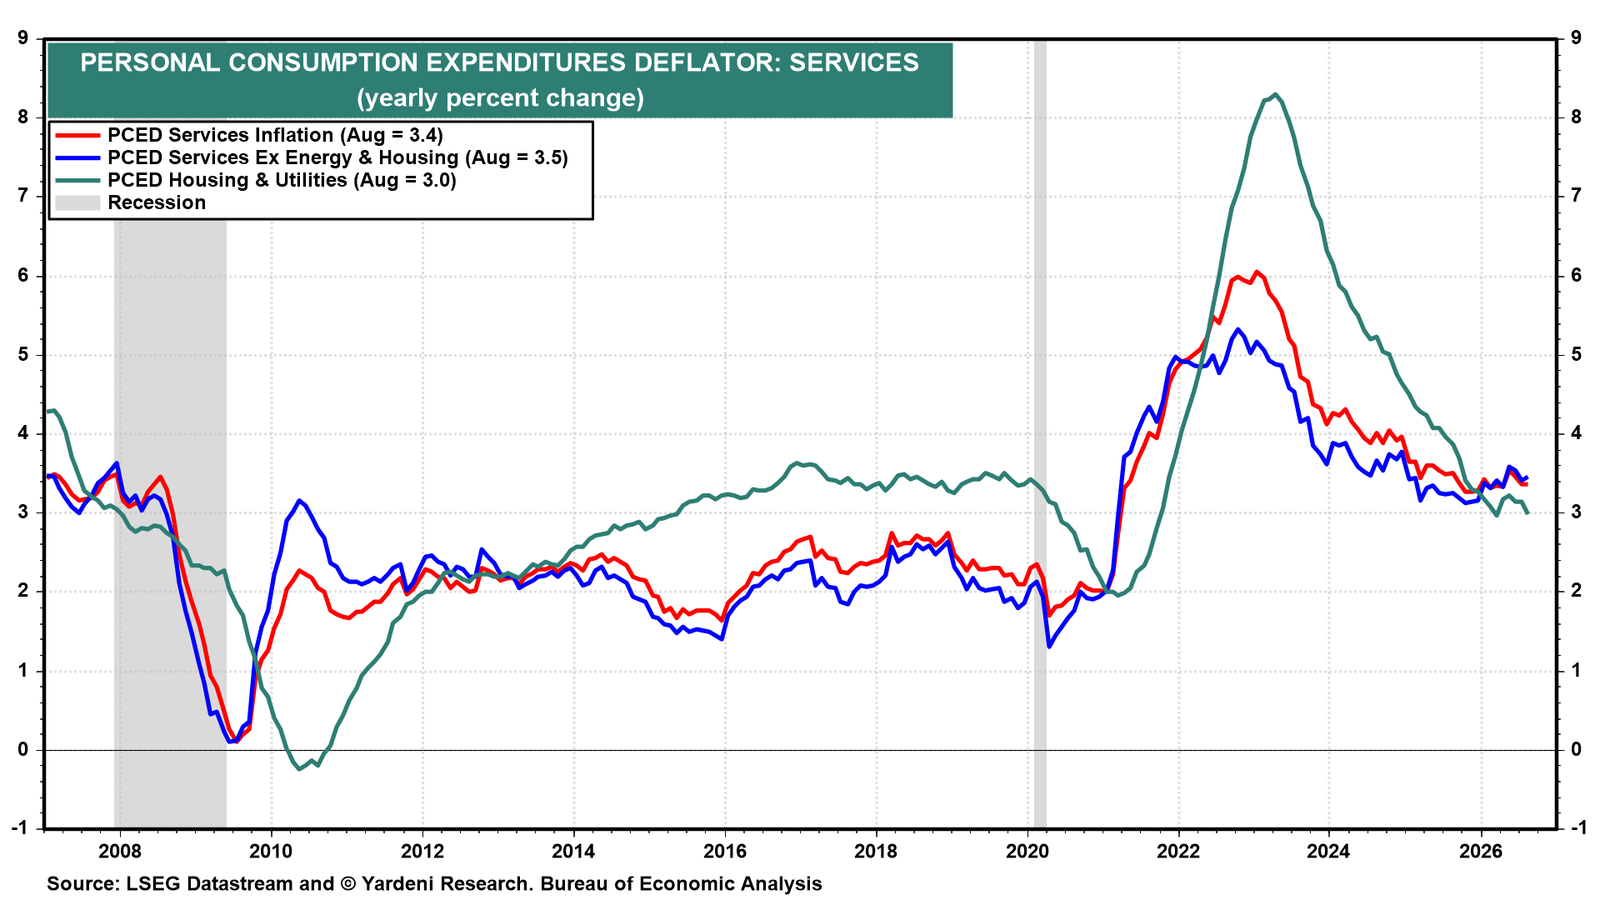
The PCED services inflation rate eased to 3.4% y/y in August (chart). However, the “supercore” PCED services, which excludes both energy and housing, rose 0.4% m/m in August. That was the strongest monthly increase since May 2026 and pushed the y/y rate up to 3.5%.
The supercore inflation rate isolates some of the stickiest and most wage-sensitive parts of the inflation basket. The measure remains well above a pace consistent with the Fed’s 2% target. More importantly, it has been moving higher since October 2025.
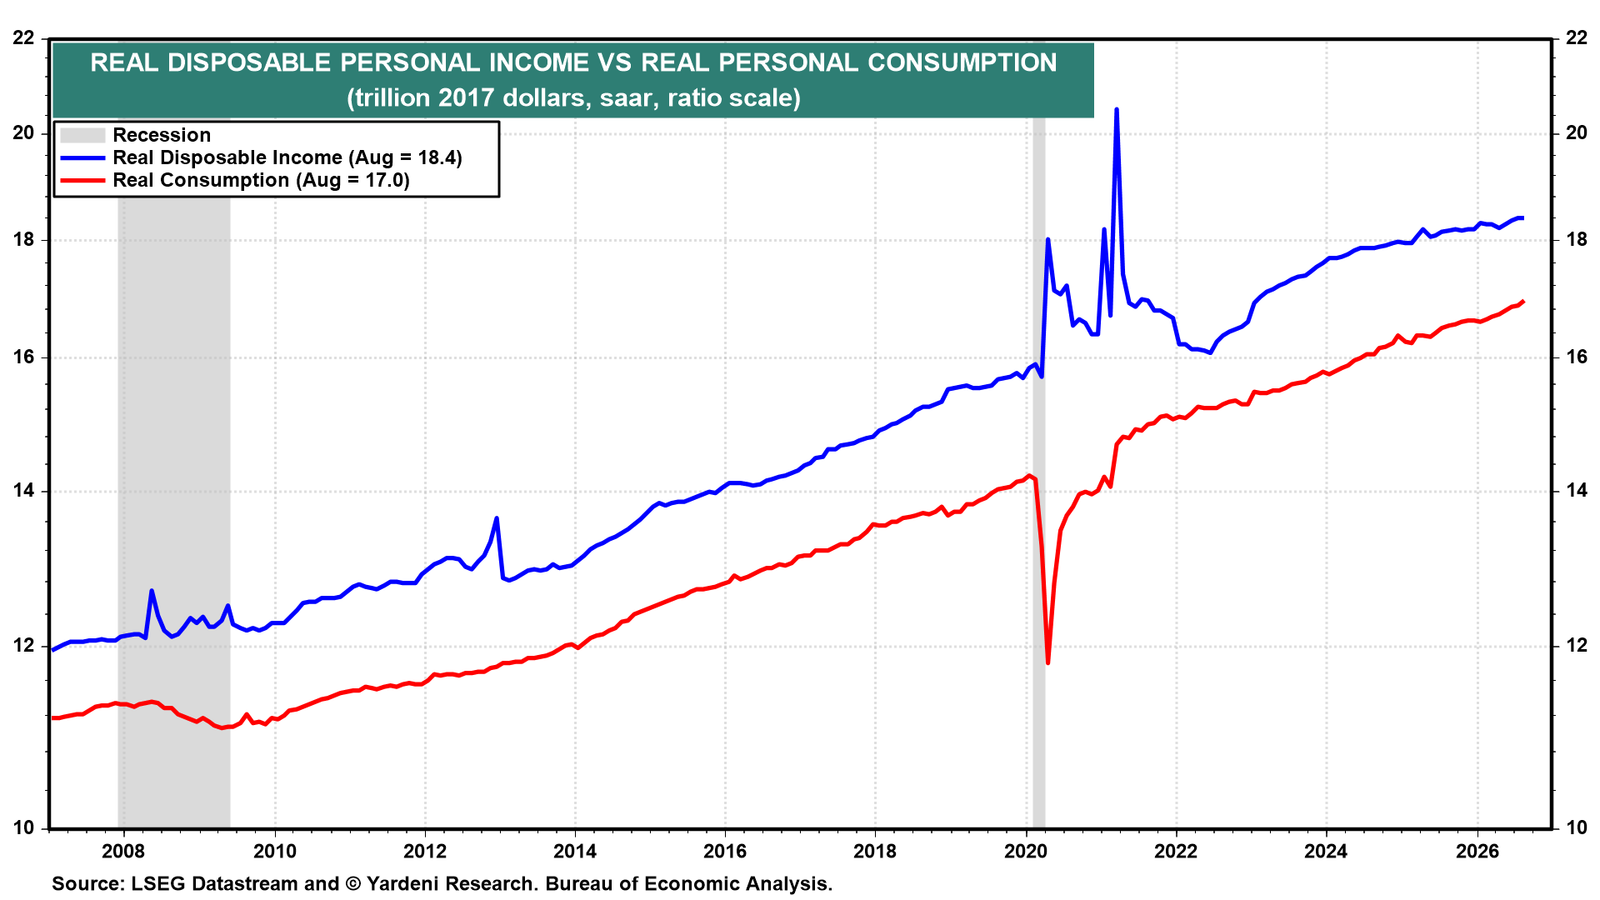
(2) Consumer spending and income. Consumer spending remains remarkably strong. Inflation-adjusted consumption rose to another record high in August (chart). By contrast, real disposable personal income was unchanged m/m and has been essentially flat for more than a year. That trend is likely to persist as more Baby Boomers retire, slowing wage income growth.
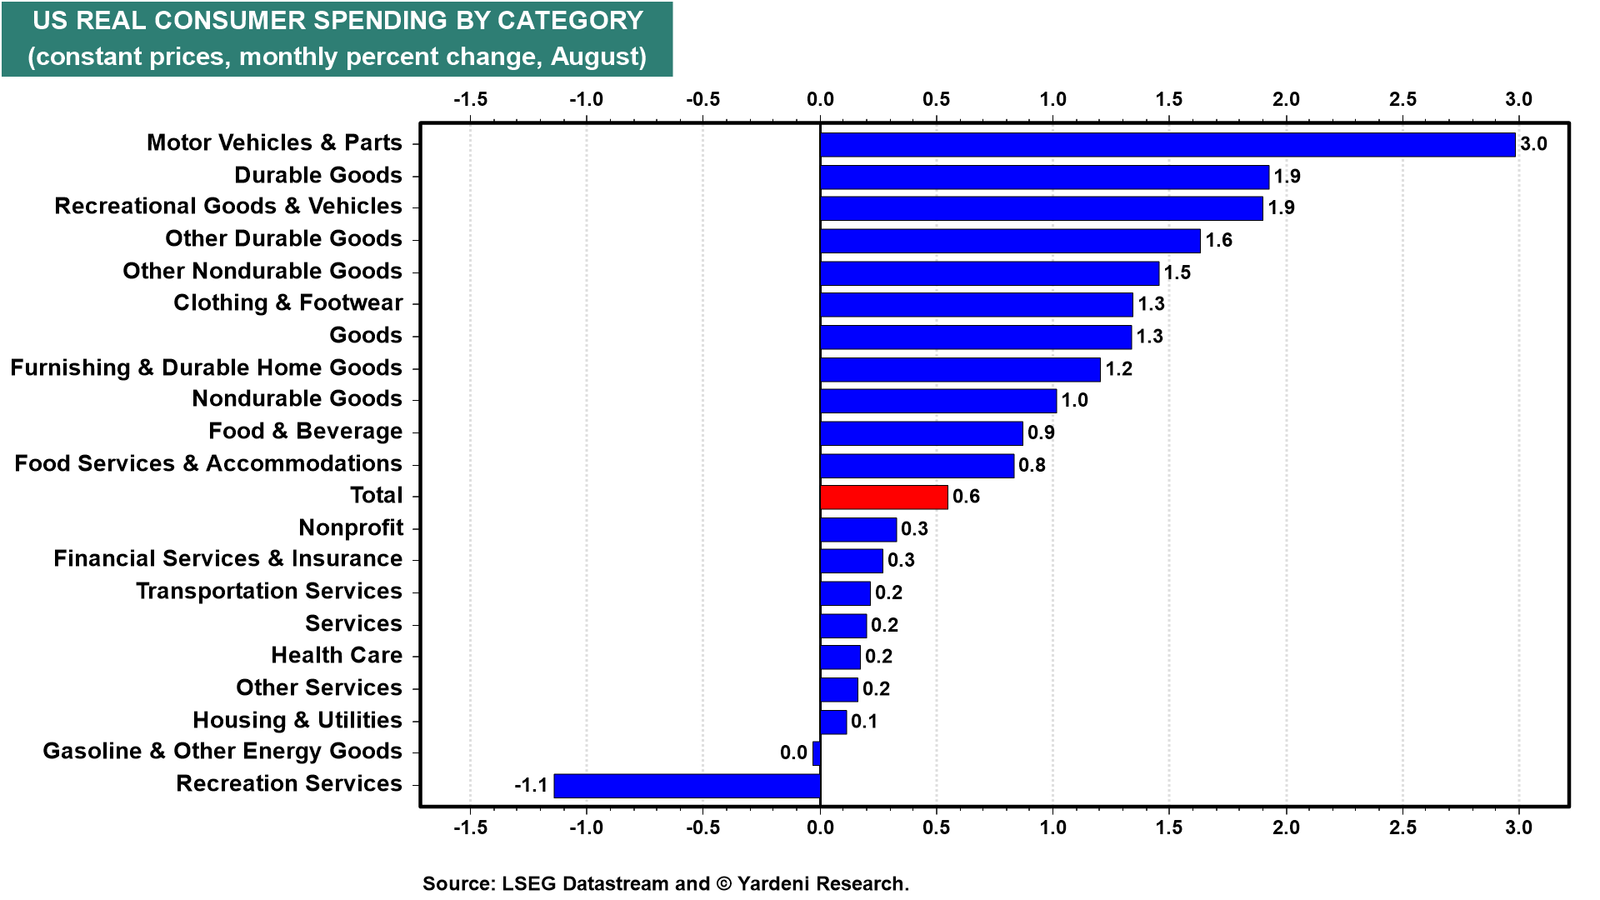
Real consumer spending rose 0.6% m/m in August, the strongest monthly gain since March 2025. The increase was broad-based, with especially strong spending on discretionary categories including restaurants and hotels, recreation, and apparel (chart).
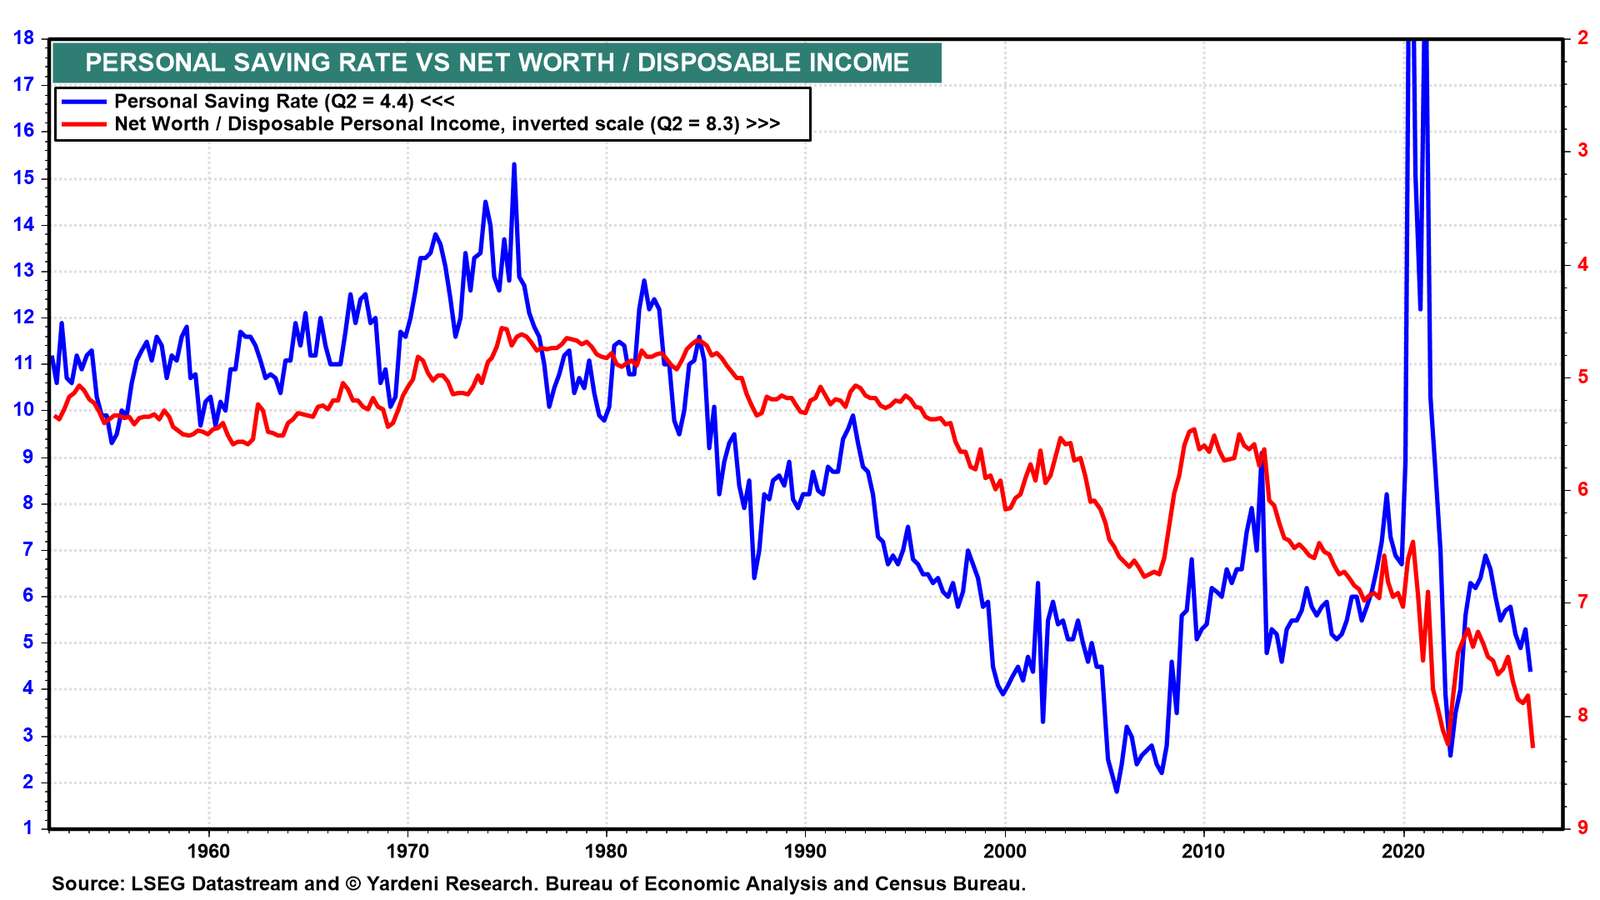
The surge in household net worth relative to disposable income is causing consumers, especially Baby Boomers, to reduce their savings rate (chart). August’s saving rate was revised meaningfully higher, but still fell to 4.1%, the lowest since November 2022. We expect it to decline further as more Boomers retire. Their labor income drops to zero when they do so, but their sizable accumulated wealth lets them keep spending.
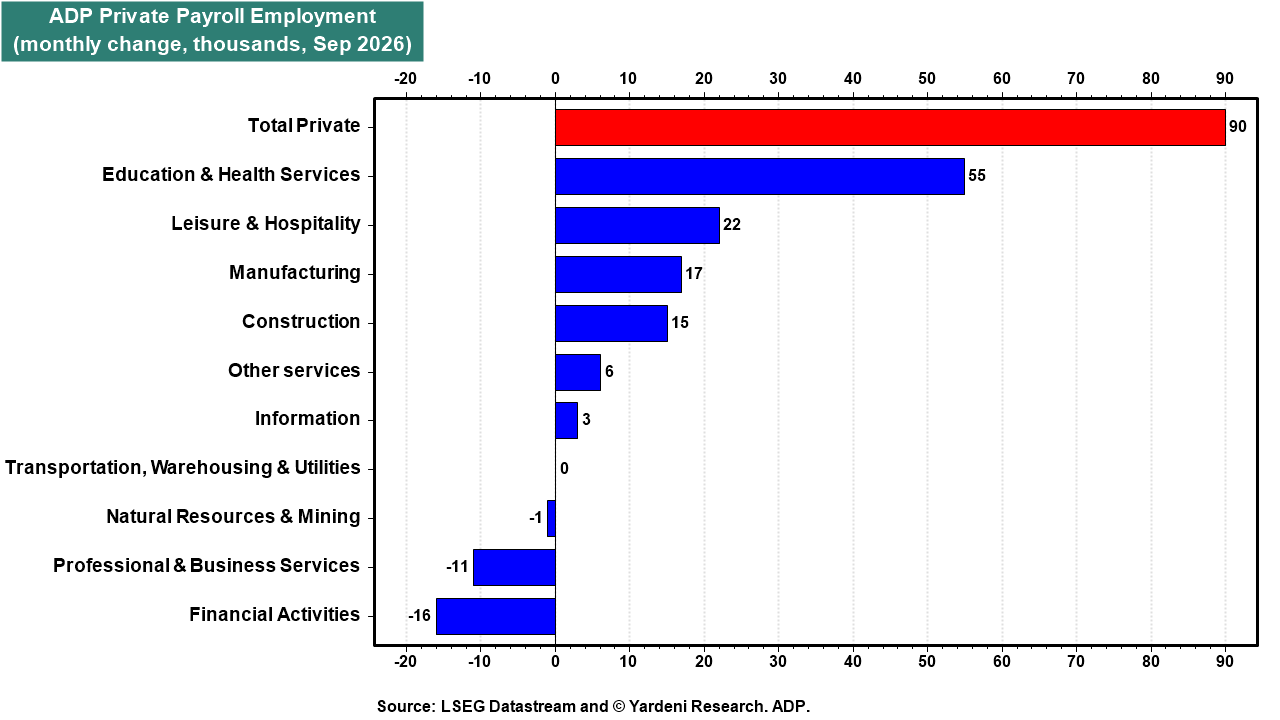
(3) Labor market. Another key driver of consumer spending is the strong labor market. ADP private payrolls rose by 90,000 in September, with healthy gains across both goods-producing and service industries (chart). We expect Friday’s employment report to confirm that strength, with nonfarm payrolls likely to show a 100,000 increase in September.
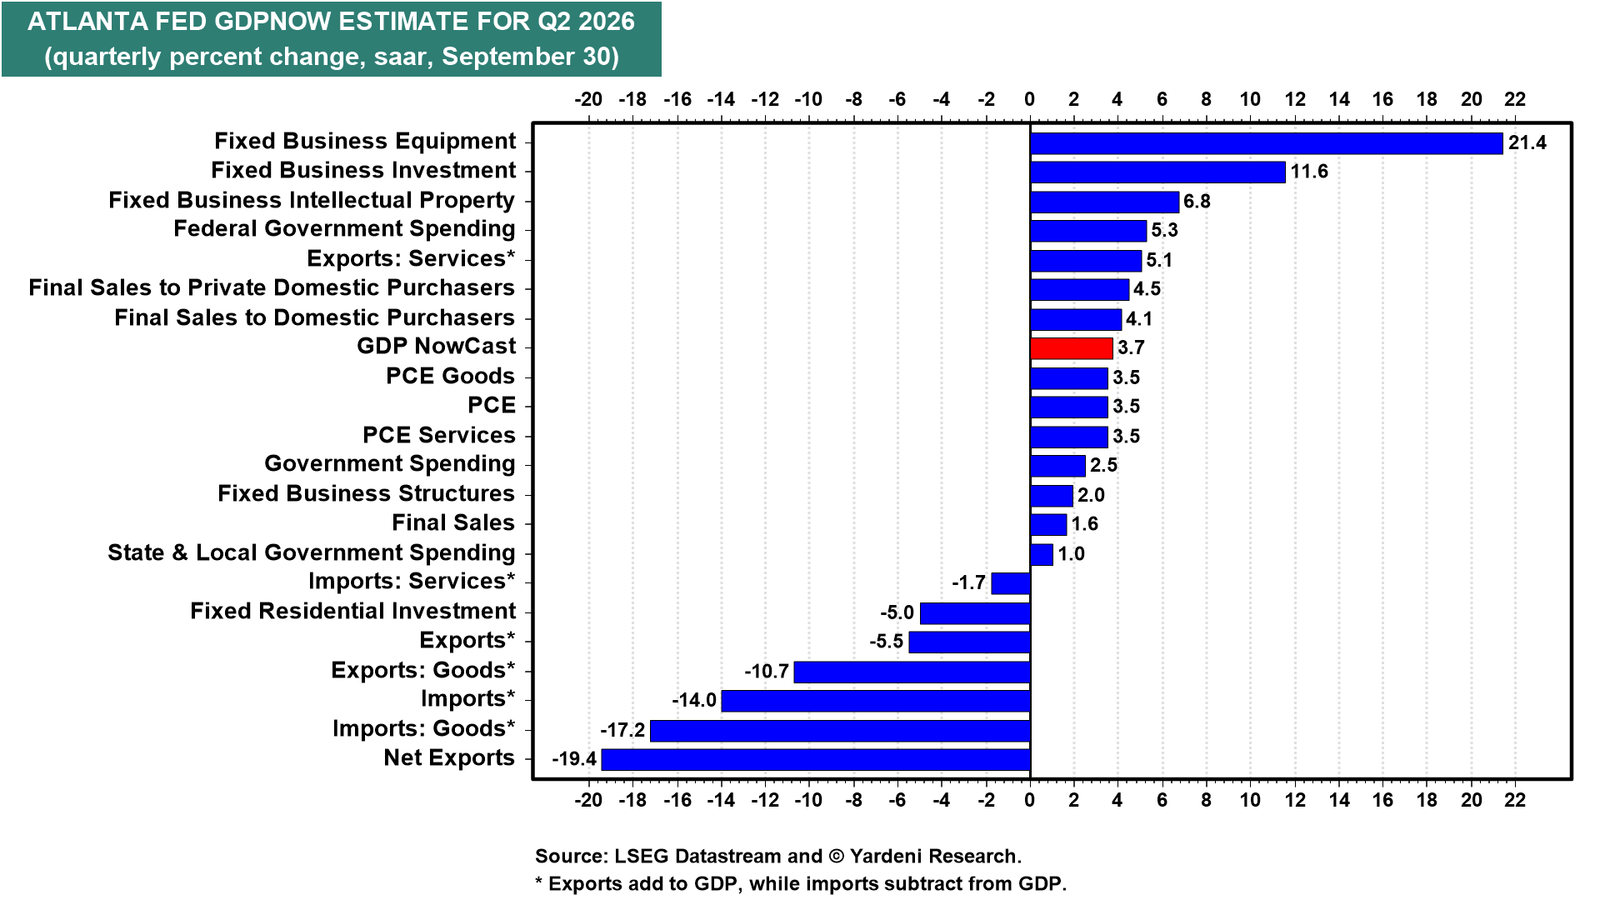
(4) GDP. Q2's real GDP growth was revised today from 1.5% saar to 2.2%. On the other hand, Q3's growth rate was revised down from 5.0% to 3.7% by the Atlanta Fed's GDPNow tracking model (chart). That was mostly attributable to the widening trade deficit. Final sales to private domestic purchasers was strong with a 4.5% gain.