The three major US stock market price indexes (i.e., the S&P 500, Nasdaq, and DJIA) rose to record highs again today. So did the Russell 2000. Leading the way higher were technology stocks. Driving stock prices higher was a report that the US and Iran have "mostly agreed" to extend their ceasefire by 60 days. The market ignored a warning from ExxonMobil that oil inventories will fall to record lows in the coming weeks, possibly pushing oil prices as high as $150 per barrel. Meanwhile, Dell's stock price soared by 39% in after-hours trading following the company's fabulous earnings momentum (FEMO) report.
The latest economic releases show that while elevated oil prices are boosting inflation, they aren't slowing the economy:
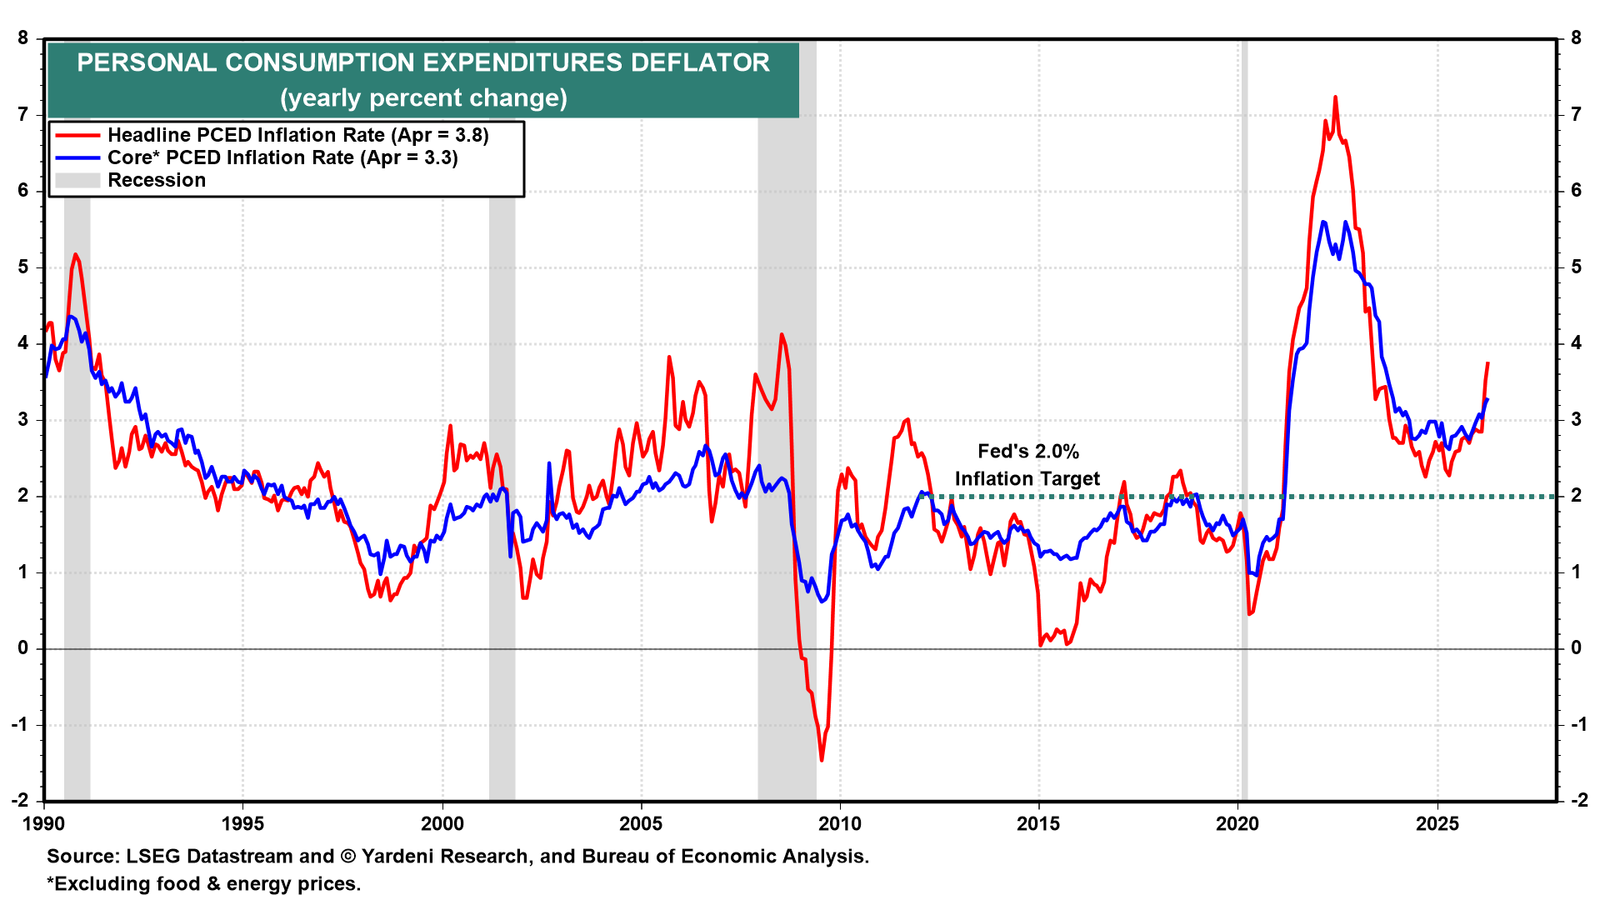
(1) Inflation. Today we learned that April's headline PCED rose 0.4% m/m in February, with the core PCED up 0.2%, both 0.1ppt below consensus. Headline PCED rose 3.8% y/y, its highest since March 2023. Core PCED climbed 3.3% y/y, its highest reading since November 2023 (chart).
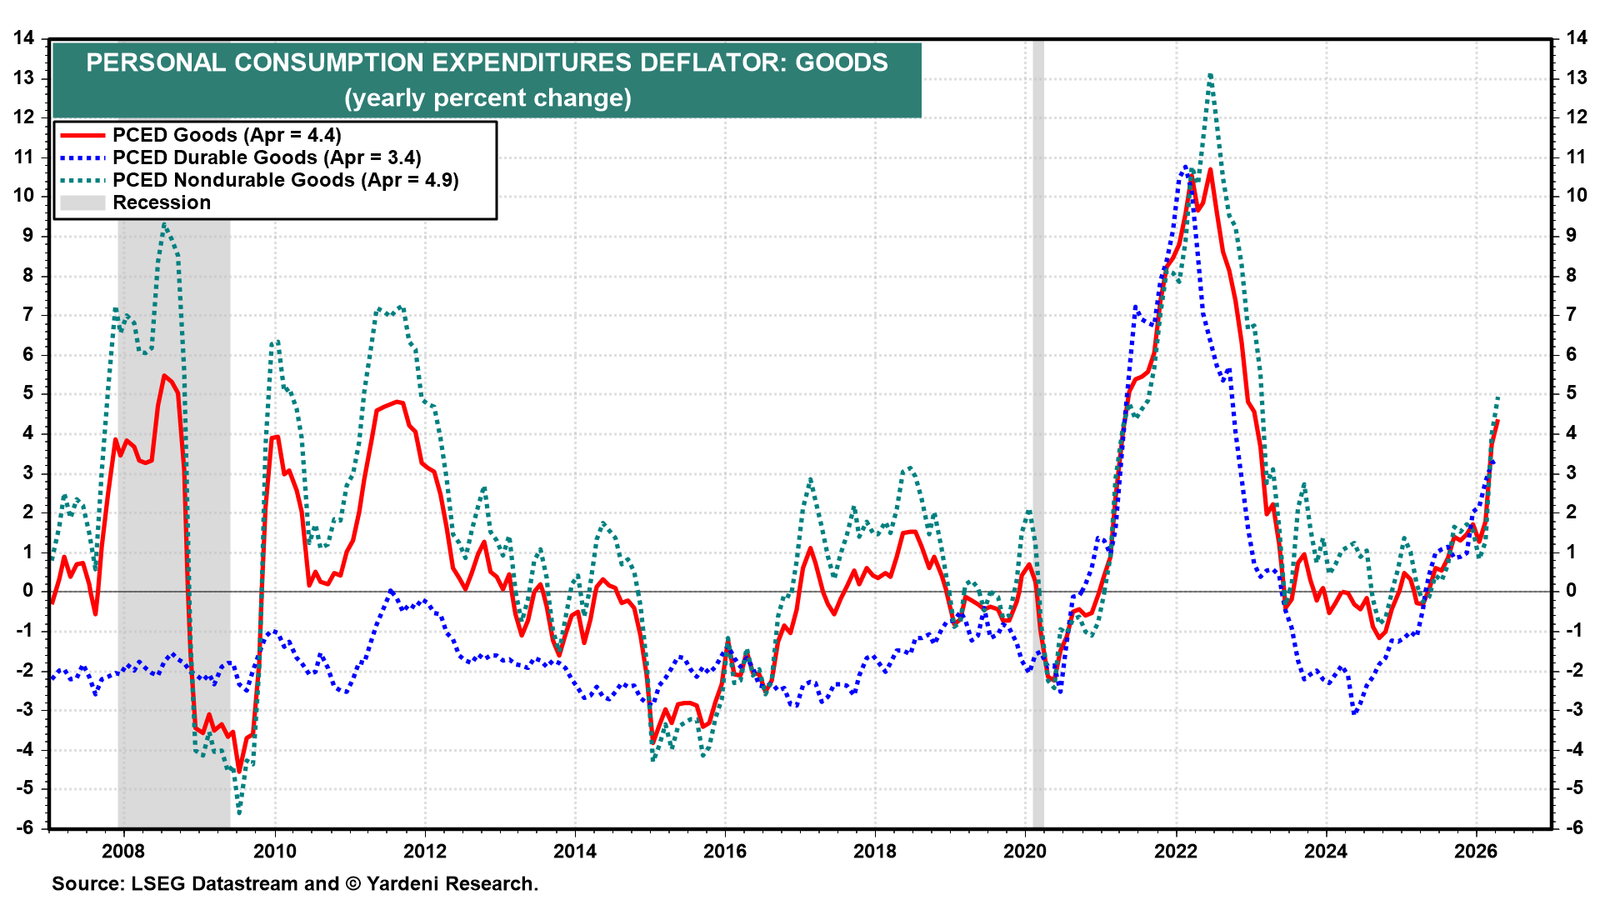
In April, all three measures of PCED goods inflation rose sharply (chart). PCED goods jumped 4.4% y/y, driven by a severe energy shock that pushed PCED nondurable goods up 4.9%. Concurrently, import tariffs continue to exert upward pressure on PCED durable goods, which rose 3.4% y/y. In his final press conference, Fed Chair Jerome Powell stated he expected the inflationary impact of tariffs to fade within two quarters. That's not happening yet.
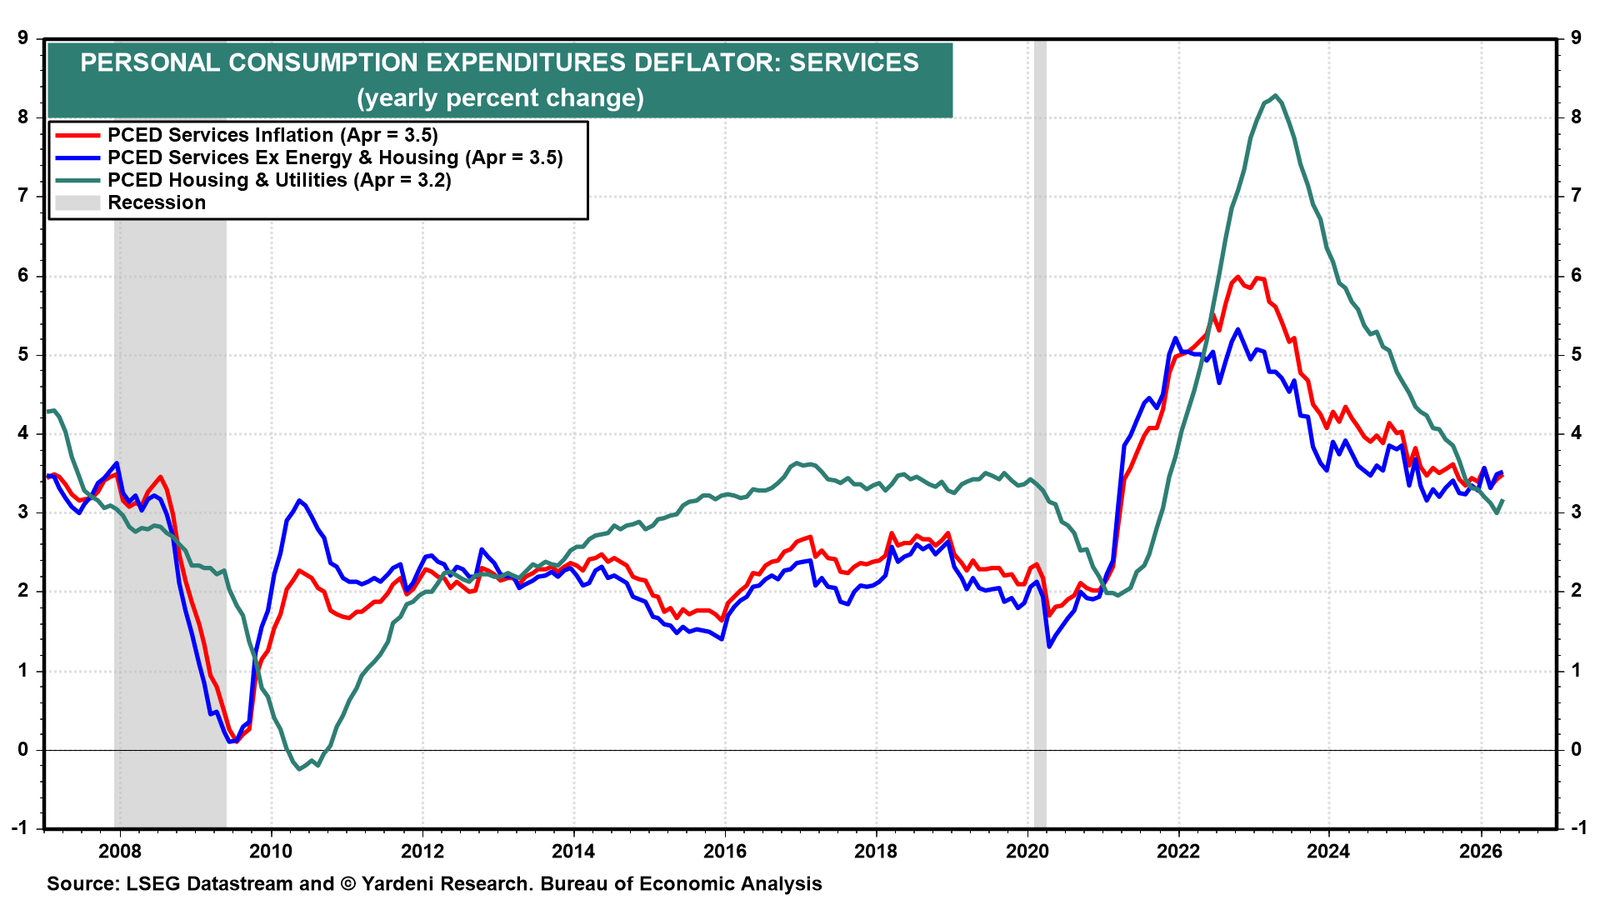
PCED services edged up 3.5% y/y. It remains stubbornly high. The wage-sensitive super-core measure of PCED services (i.e., excluding energy and housing) also rose 3.5%. The 3.2% y/y uptick in PCED housing & utilities was driven higher by shelter costs and a sharp rise in household energy utility rates (chart).
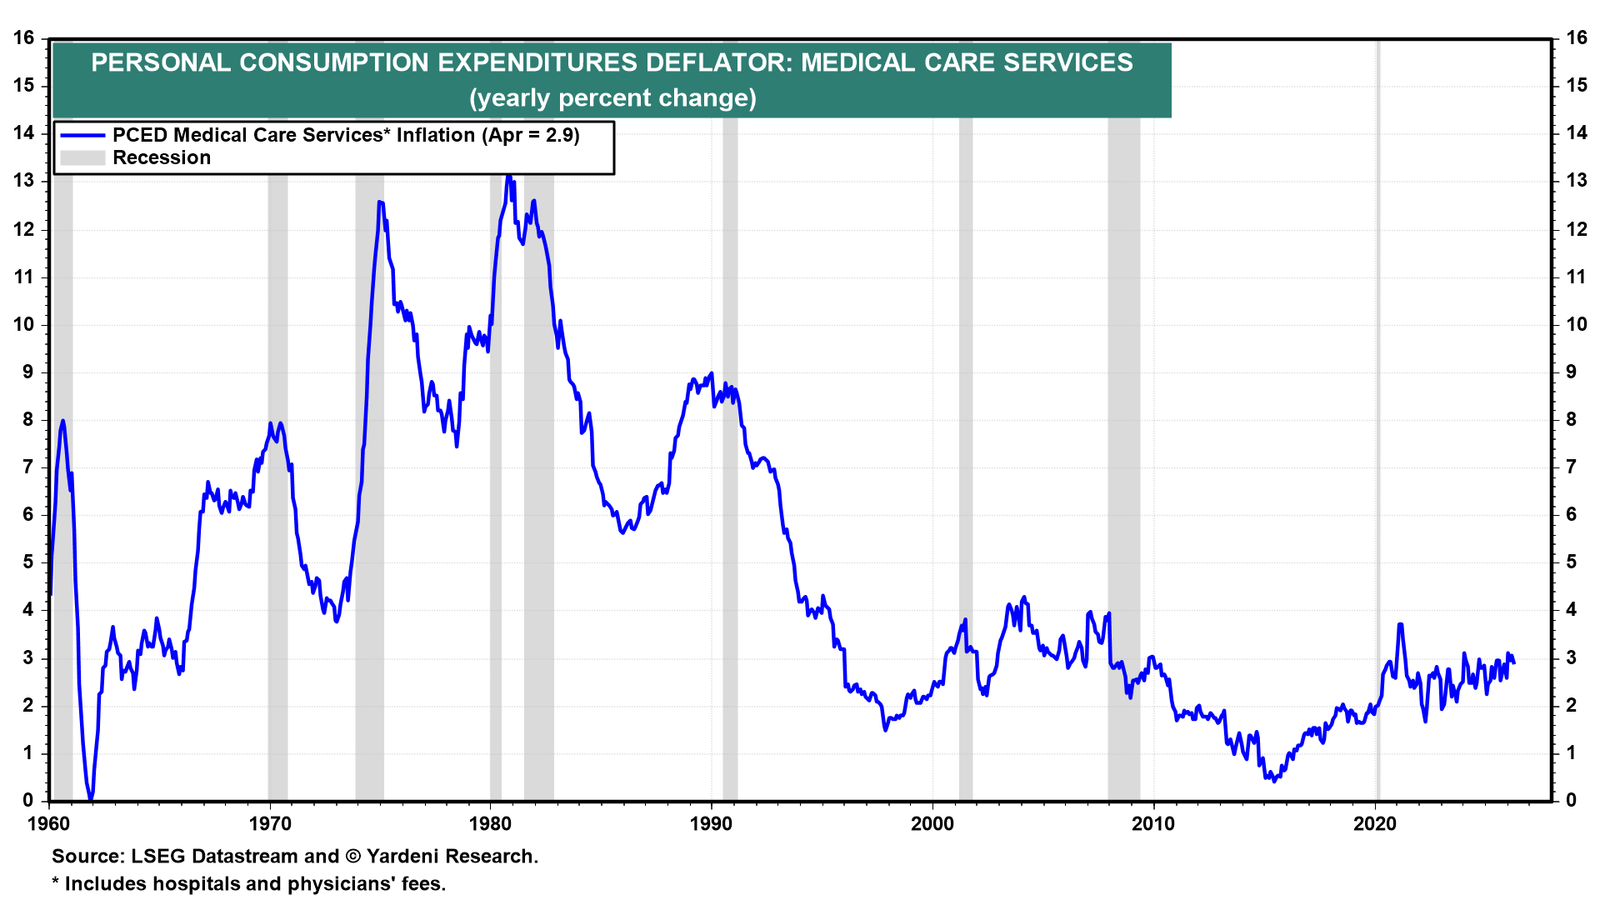
Medical care services inflation remains relatively low. It was 2.9% in April, but it has been trending higher in recent years (chart).
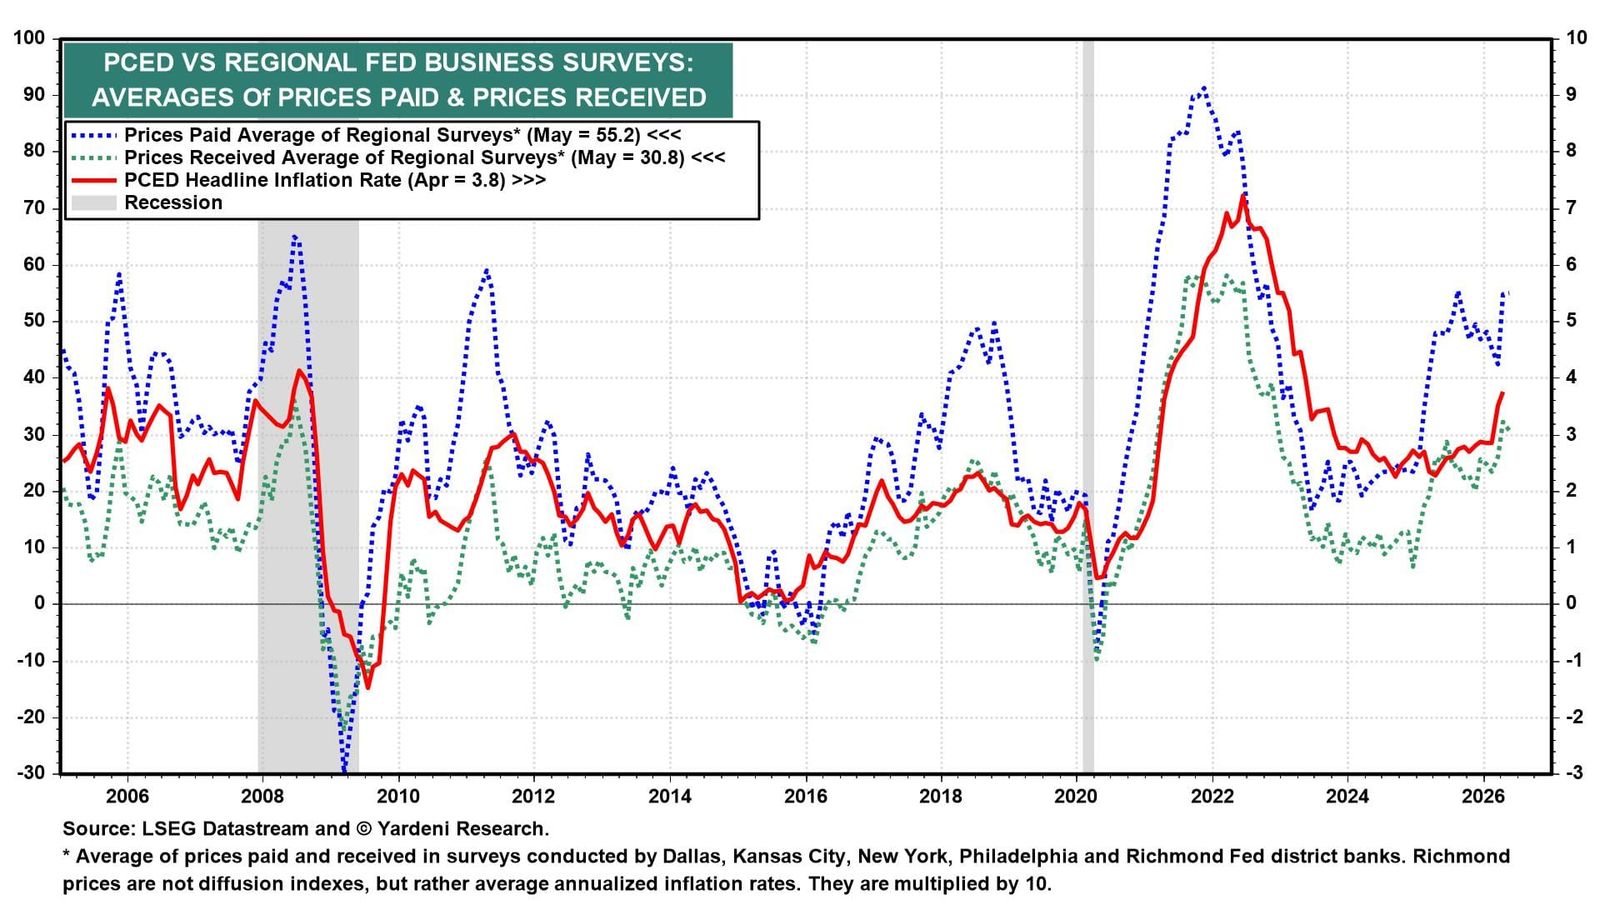
The averages of regional Fed surveys for prices paid and prices received both have increased sharply in recent months, signaling that pipeline inflationary pressures are building rather than abating (chart).
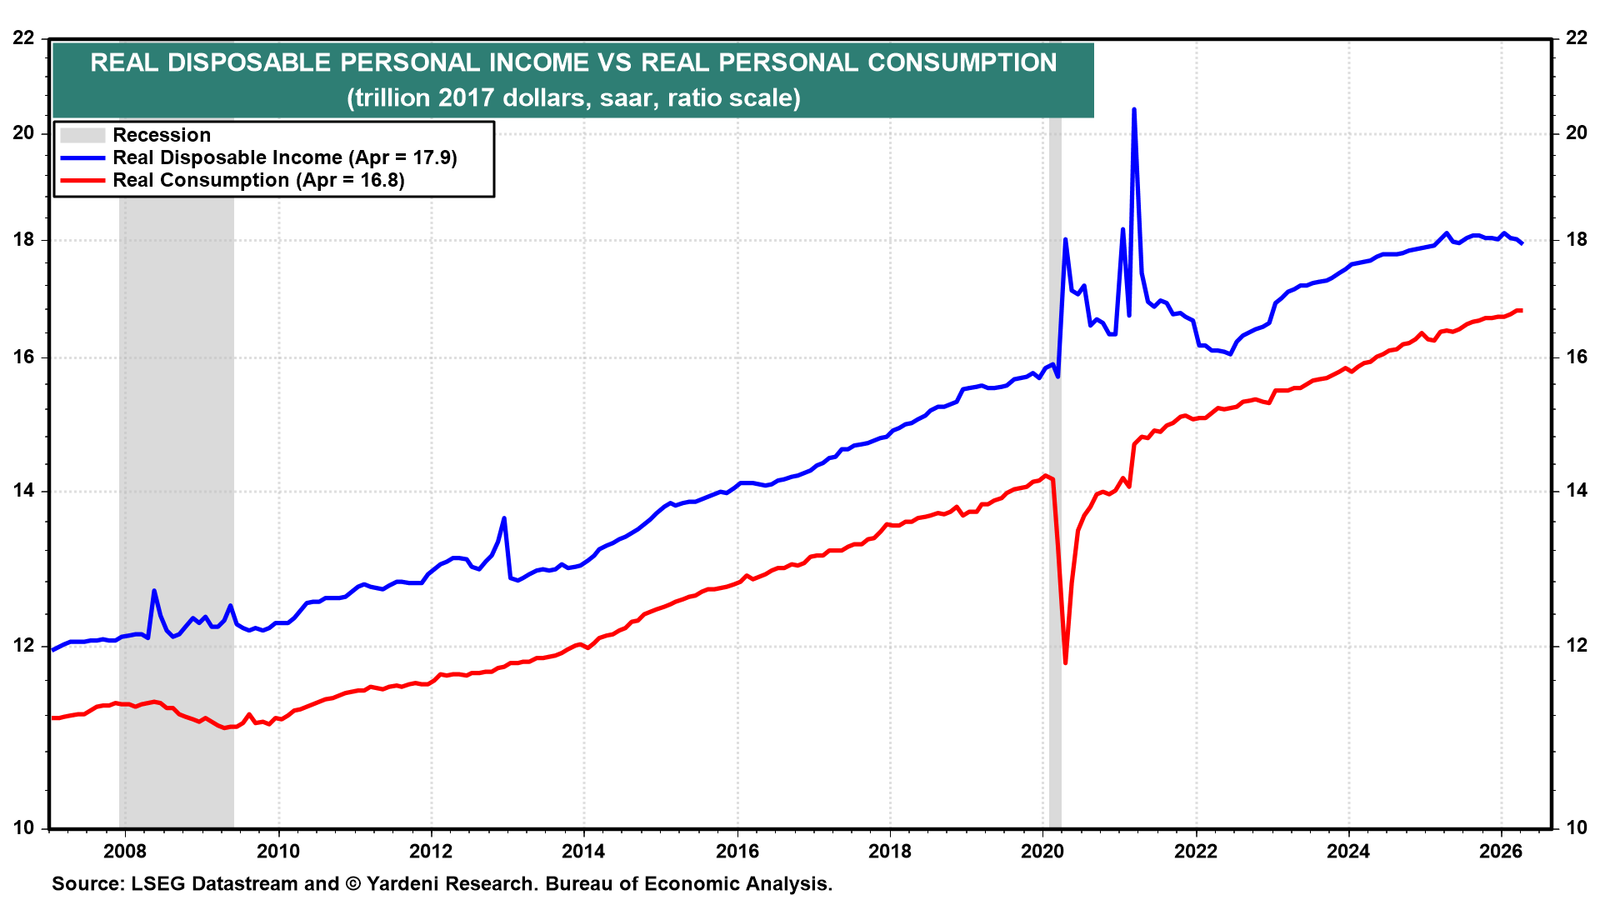
(2) Consumer spending. Real consumer spending rose 2.2% y/y in April. Real disposable personal income fell 0.2% y/y (chart). Consumer prices have been rising faster than wages in recent months. The former was boosted by energy cost increases resulting from the Middle East War. The retirement of Baby Boomers is also weighing on disposable personal income. But they will continue to spend their substantial retirement funds even without earned income.
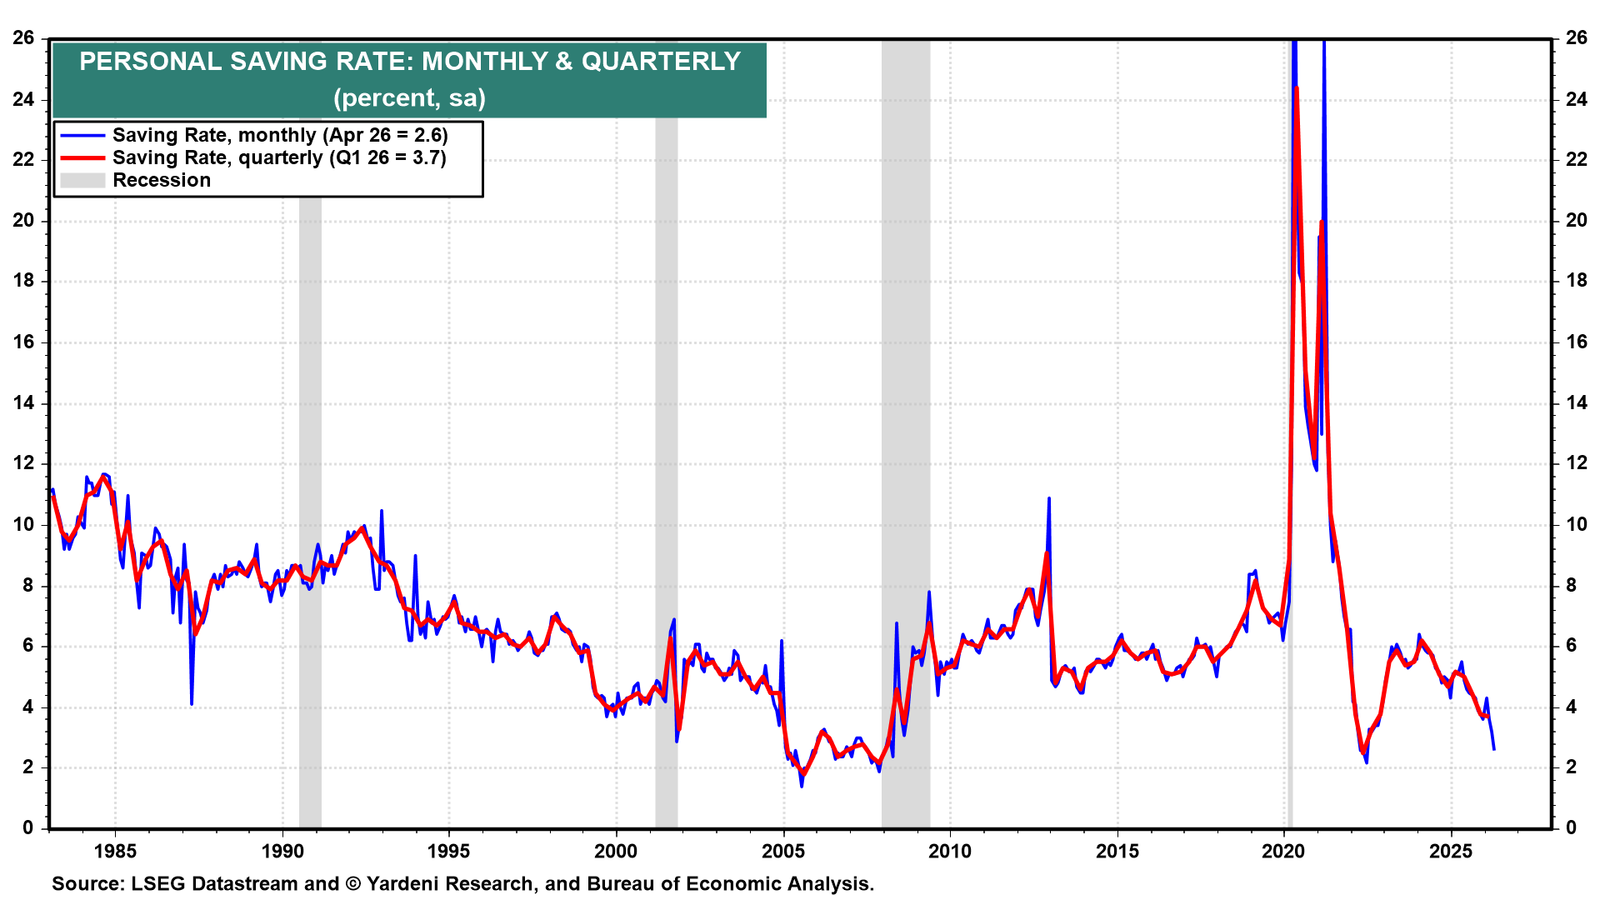
The saving rate dropped to 2.6%, its lowest since June 2022 (chart). We are not alarmed. Indeed, we've been expecting the saving rate to decline as the Baby Boomers retire.
The apparent weakness in April income was also attributable to two temporary factors. First, the y/y comparison is distorted by the exceptionally large wave of retroactive Social Security payments distributed in April 2025 following the enactment of the Social Security Fairness Act. Second, farm proprietors' income collapsed after the Farmer Bridge Assistance Program deadline closed in April, cutting off temporary government support payments.
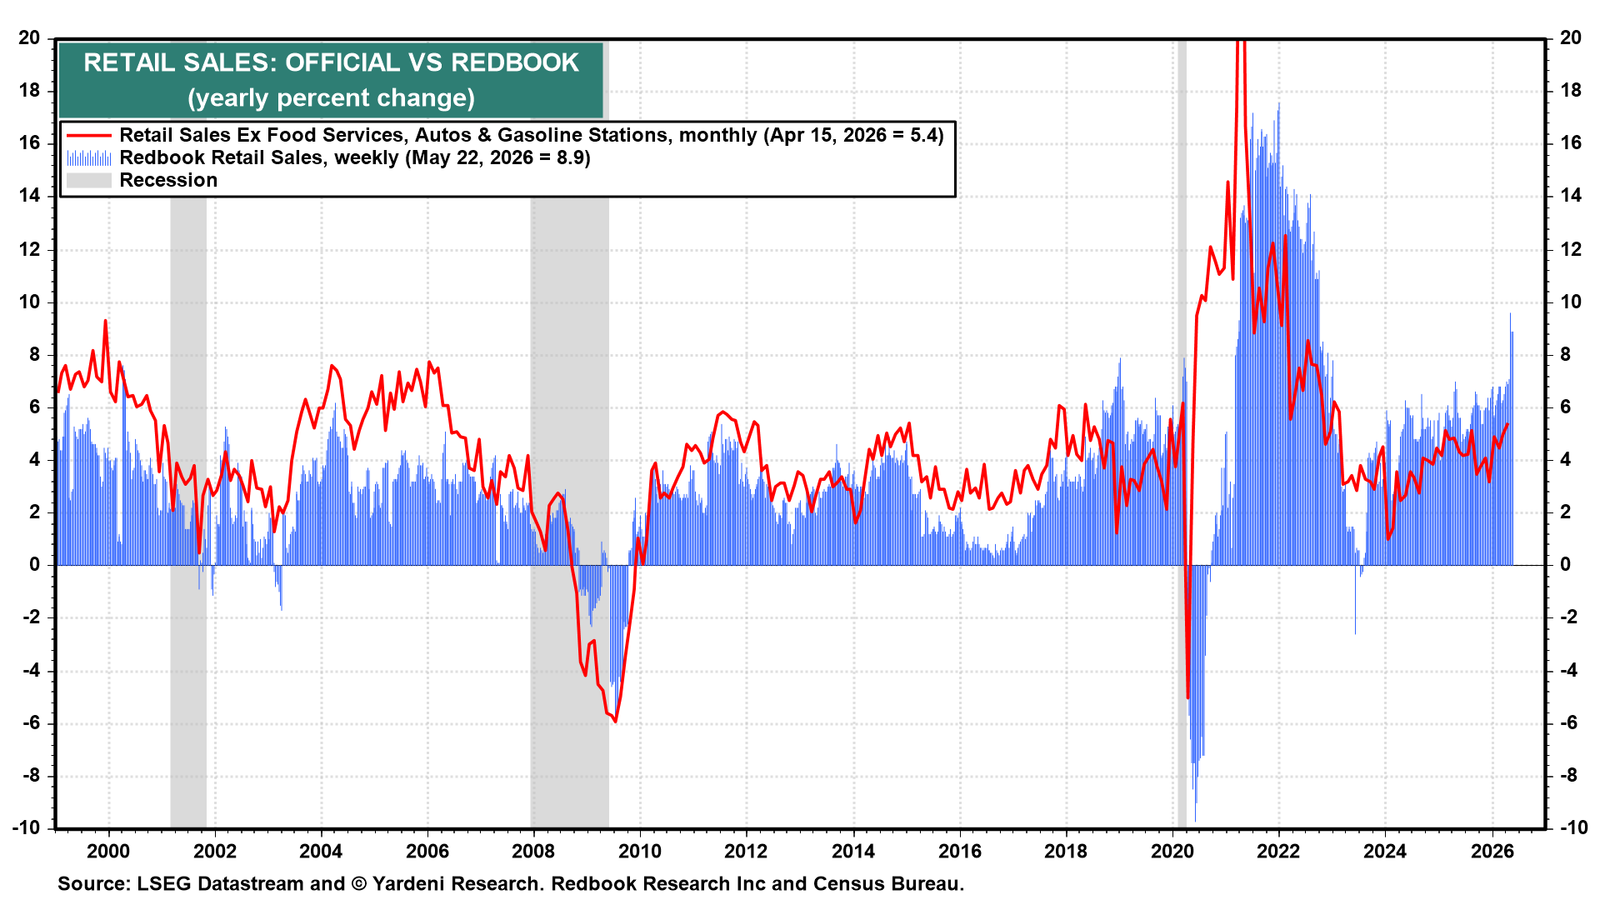
The latest Redbook Retail Sales Index confirms that consumer spending remained strong through May. It rose 8.9% y/y during the week ending May 22, well above the 2025 full-year average of 5.8% (chart).
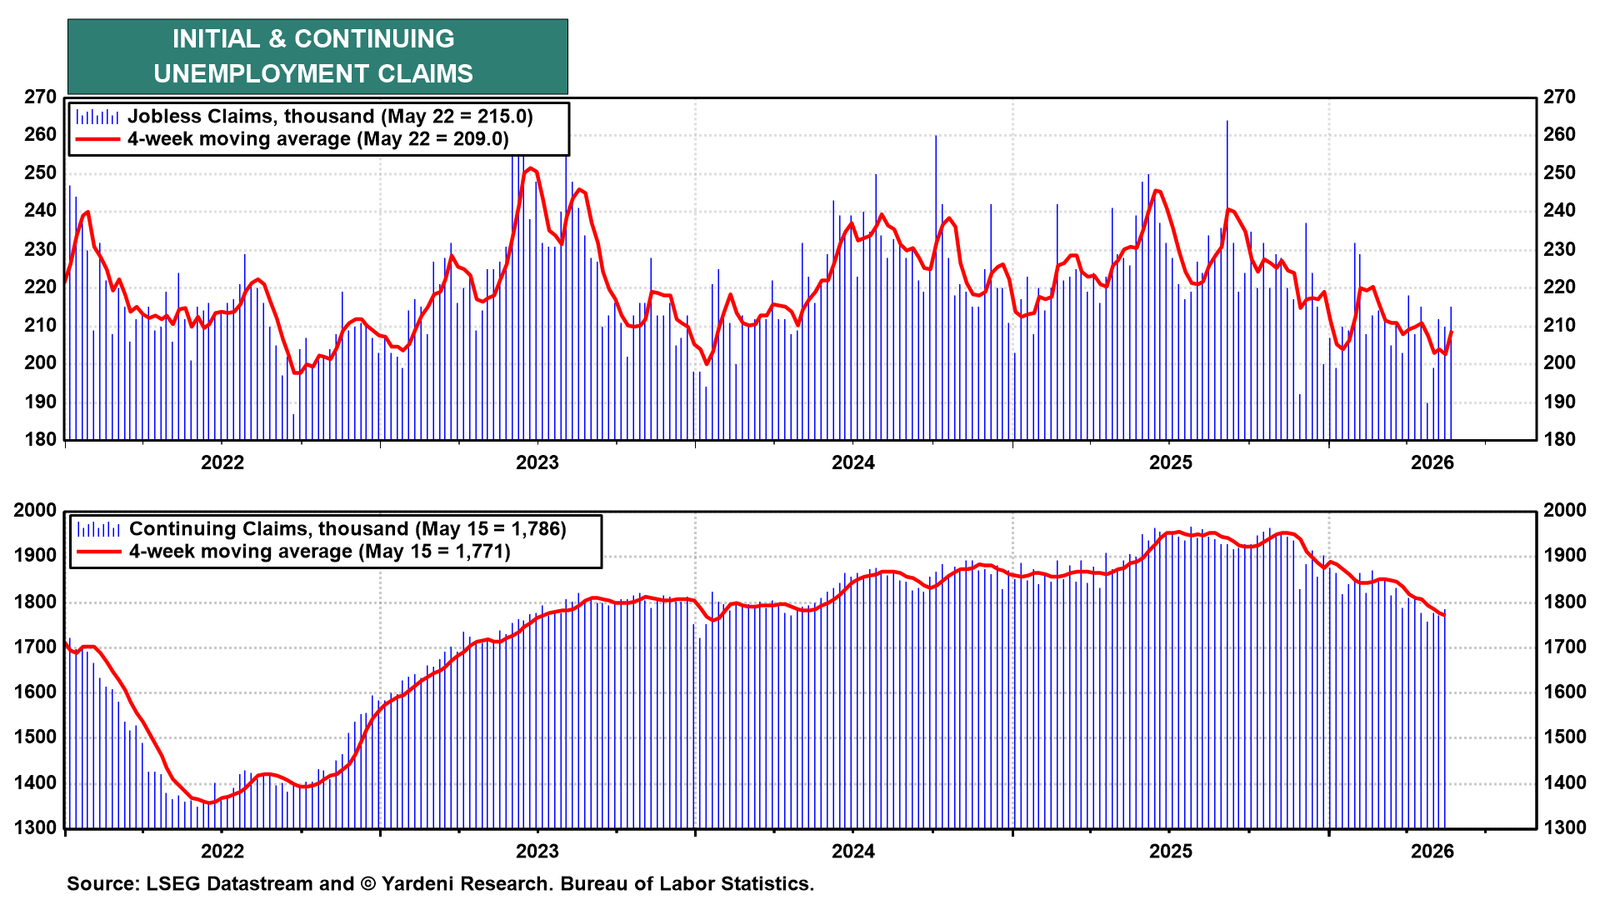
(3) Labor market. Initial unemployment insurance claims rose 5,000 to 215,000 during the week ending May 23, while continuing unemployment insurance claims increased 15,000 to 1,786,000 during the week ending May 16. Both measures remain at historically low levels, consistent with a labor market in which layoff activity remains subdued and finding a job may be taking less time (chart).
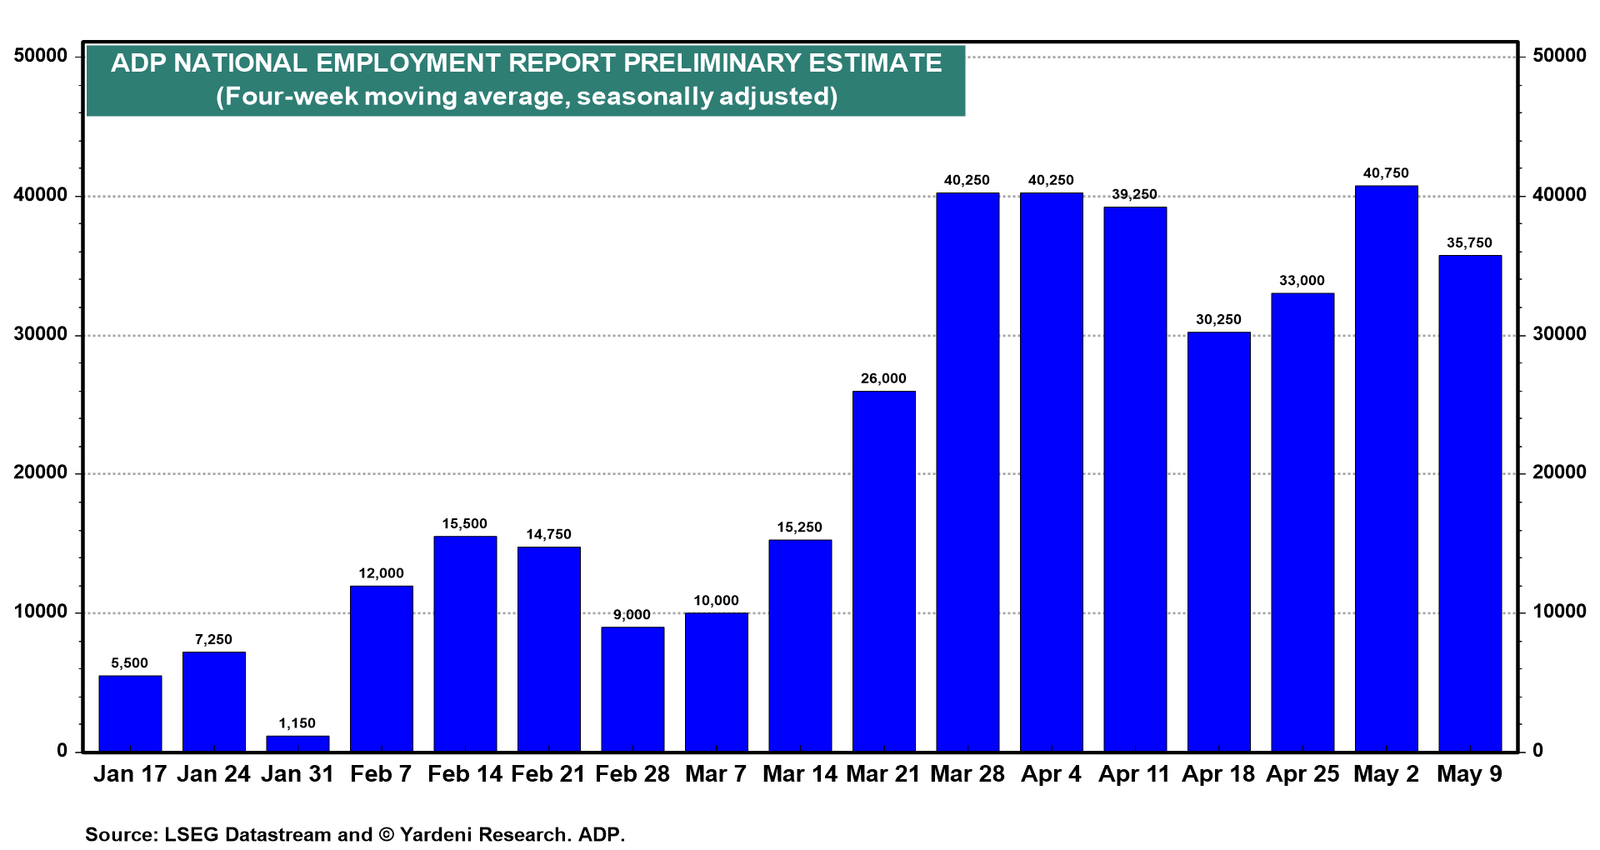
The ADP NER Pulse shows private employers added an average of 35,750 jobs per week over the four weeks ending May 9, implying a solid monthly pace of approximately 143,000 net new private-sector jobs (chart).
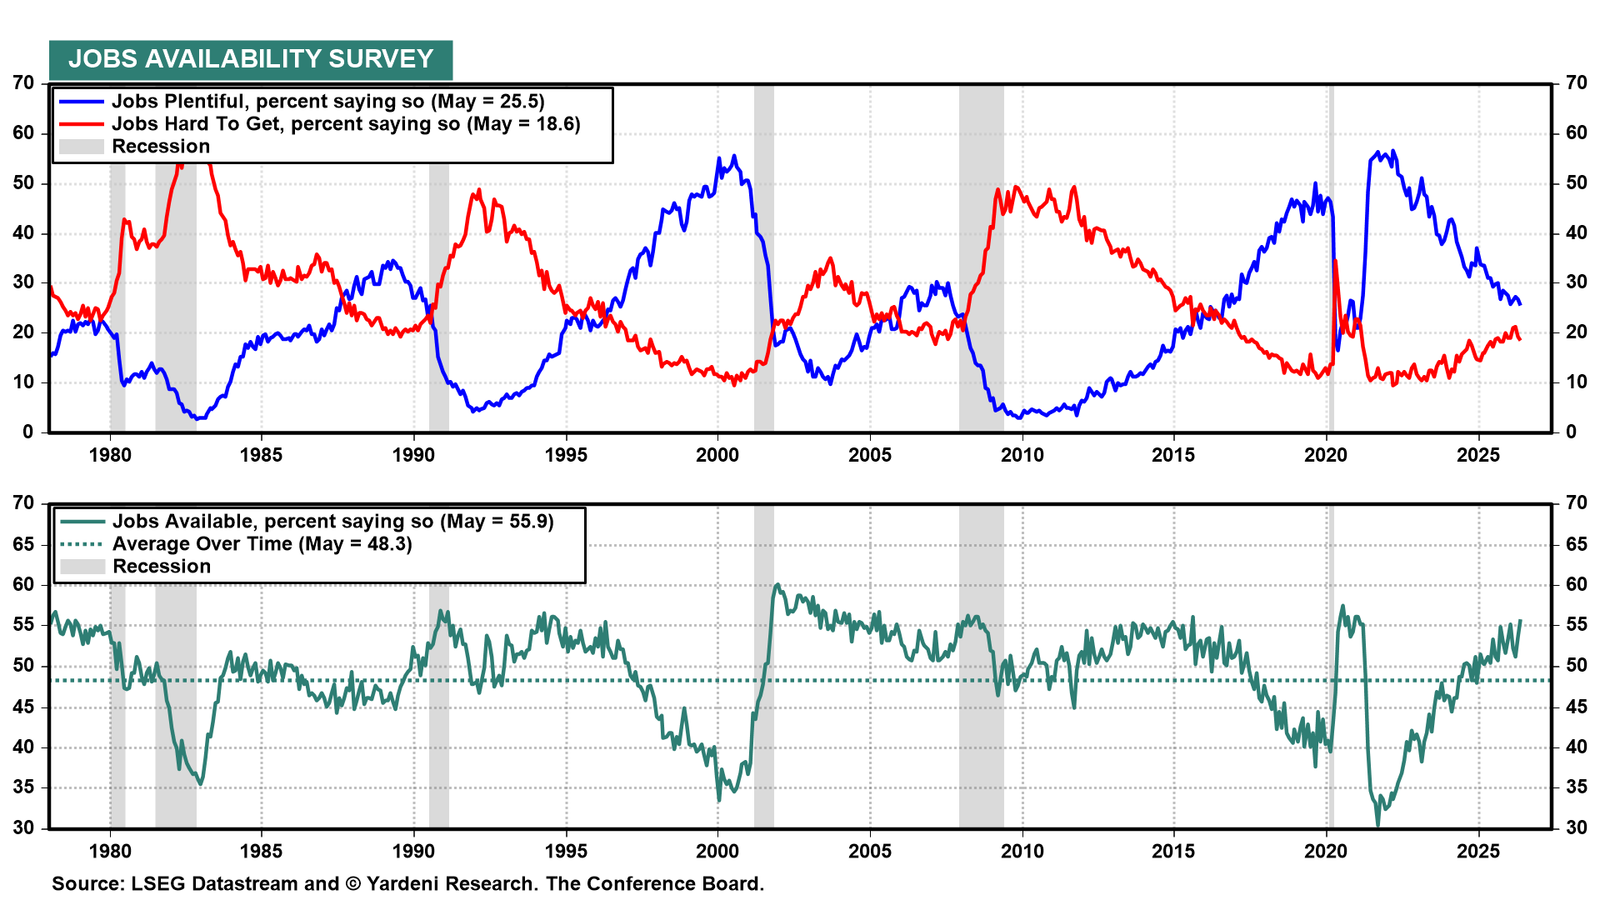
May's Conference Board data show 55.9% of respondents say jobs are available, above the long-run average of 48.3%. Those saying jobs are hard to get fell from 19.4% to 18.6%, consistent with a gradual improvement in labor market conditions (chart).
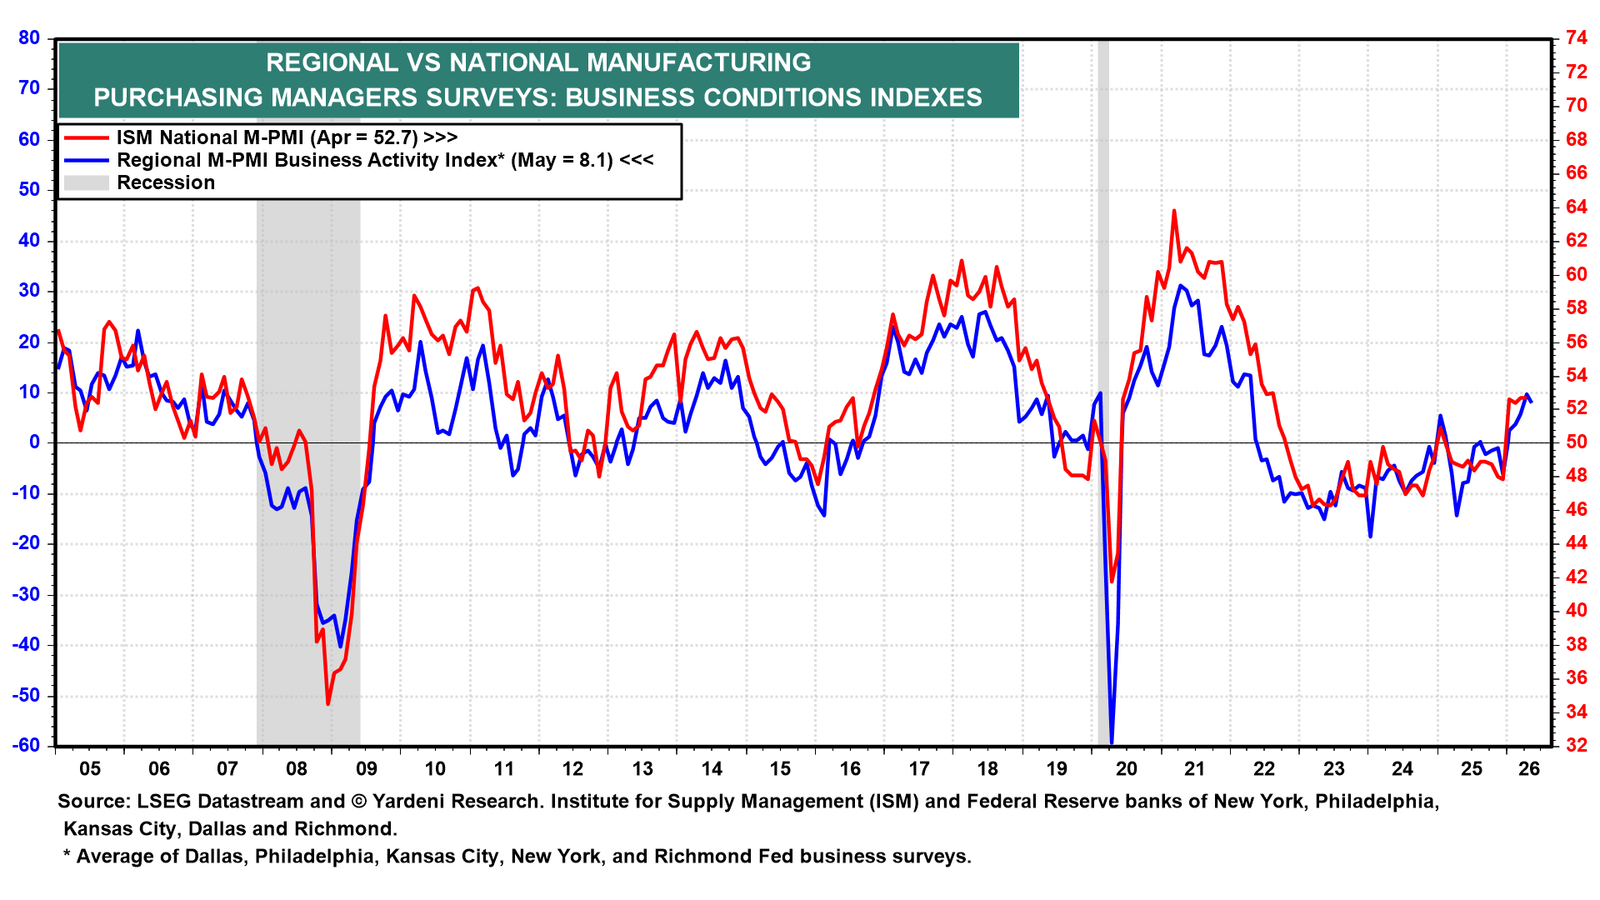
(4) Manufacturing. The manufacturing sector continues to show signs of revival. The ISM manufacturing index remained in expansionary territory at 52.7 during April. It probably remained that high during May, according to the average of the regional M-PMI indexes (chart).
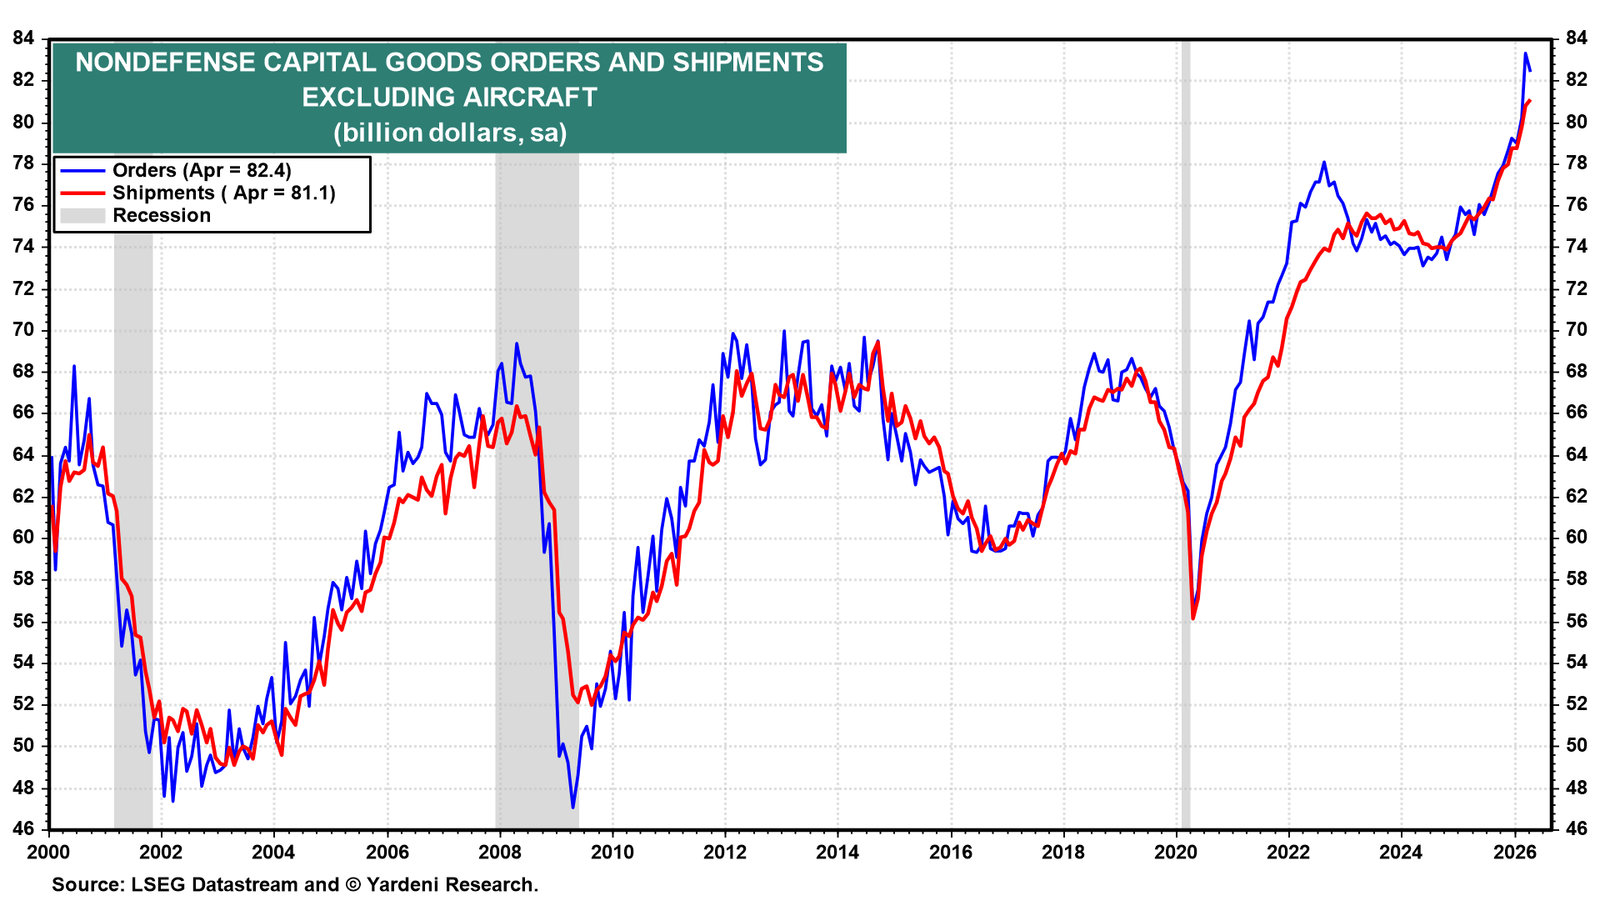
Nondefense capital goods orders and shipments surged to record highs in an almost vertical trajectory in recent months (chart). We attribute this development to the ongoing AI infrastructure boom, which is broadly lifting manufacturing activity.
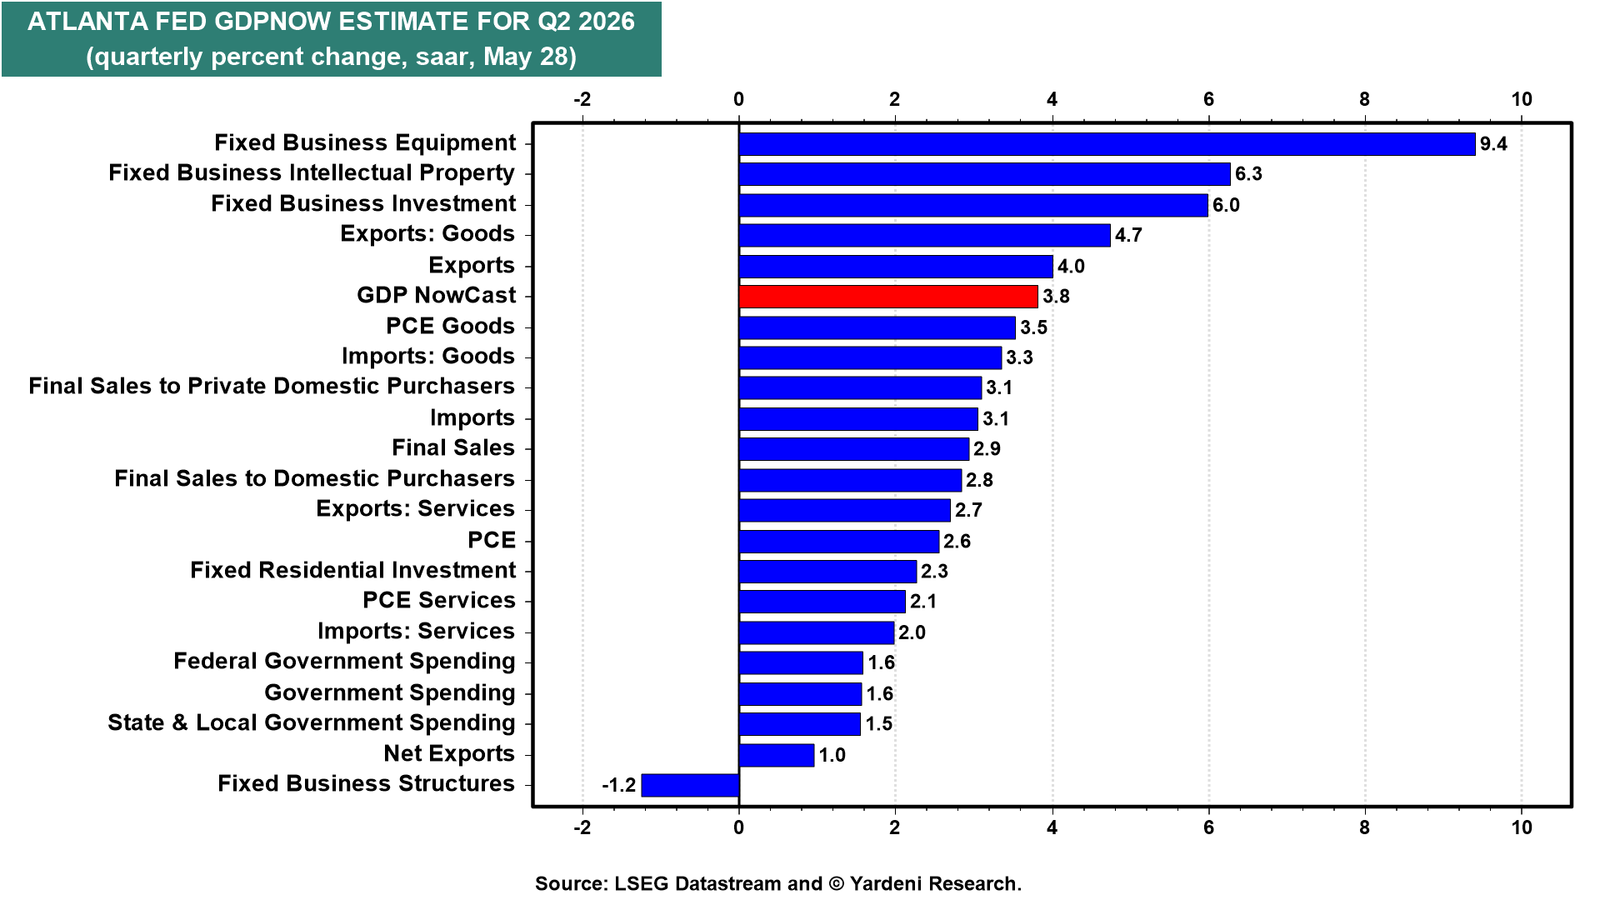
(5) GDP. The Atlanta Fed GDPNow model estimate for Q2-2026 real GDP growth was revised modestly lower today, from 4.3% to 3.8% (chart). The “nowcast” for real consumption growth was trimmed from 2.9% to 2.6% and real gross private domestic investment from 11.4% to 10.4%. Even after the revision, these numbers are consistent with an economy growing at a healthy pace, driven by robust consumer spending and investment.