The global economy has been hit by two shocks this year and absorbed them well. The war that started in March pushed oil prices higher and disrupted global supply chains. The AI trade then took a dive in July, with Asian semiconductor stocks hit the hardest. Neither the initial shocks nor the aftershocks seem to have damaged the global economy so far.
President Donald Trump said on Saturday that he will hold off on a fresh attack on Iran if a deal can be reached quickly to reopen the Strait of Hormuz and end Iran's nuclear program. The price of a barrel of Brent crude oil is down $4 this evening to $84. Last week on Thursday, Samsung reported a 19-fold increase in Q2 operating profit to 89.5 trillion won, telling investors the memory shortage is set to run into 2028. AI-related stocks rebounded.
Here's more:
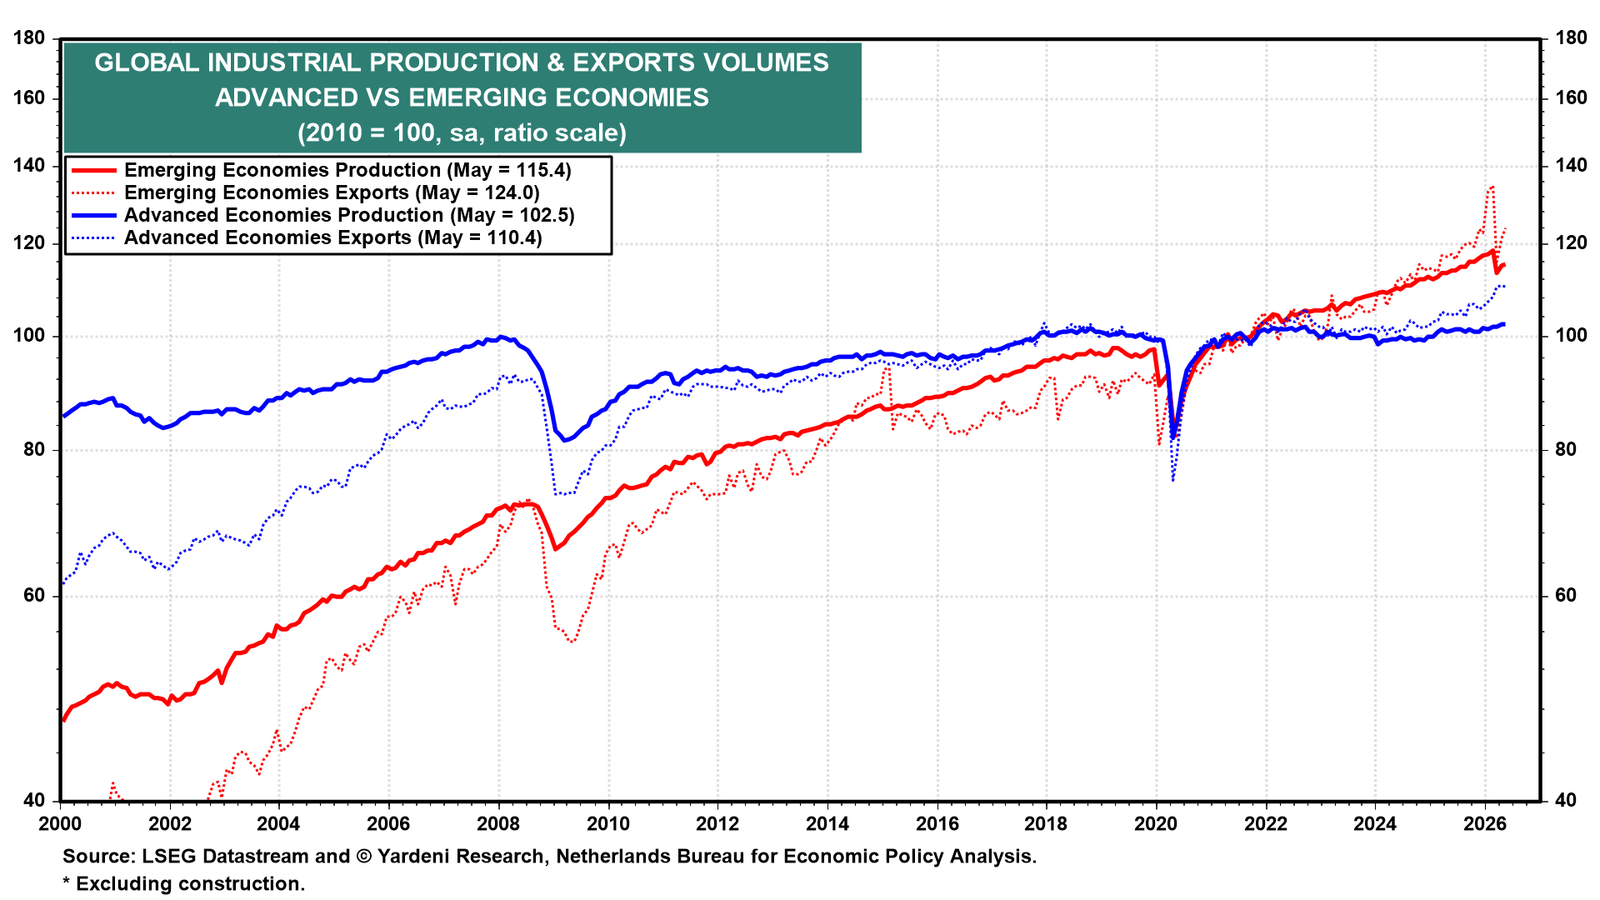
(1) Global Economy. Emerging economies took the war on the chin. Their industrial production fell sharply following the beginning of the war, but since has stabilized, while production in the advanced economies barely registered the shock (chart). Export volumes tell the same story with more volatility. Hardest hit, of course, were the Middle East countries that rely on safe passage for commercial shipping through the Strait.
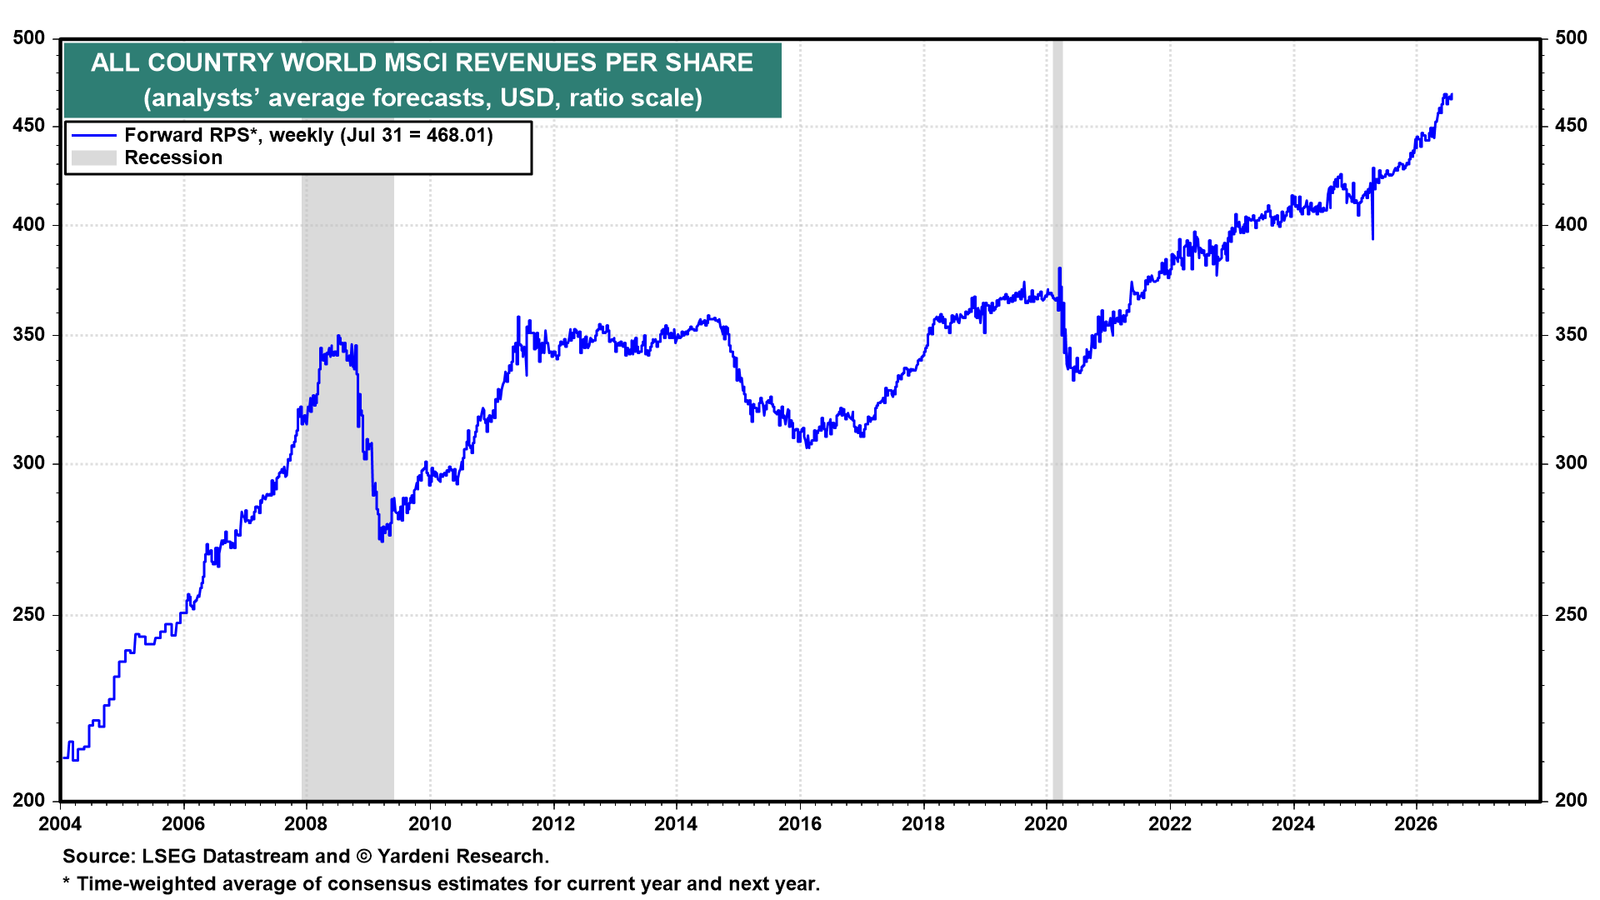
Forward revenues per share of the All Country World MSCI is at a record high (chart). There's no sign of a global recession or even a slowdown in this series.
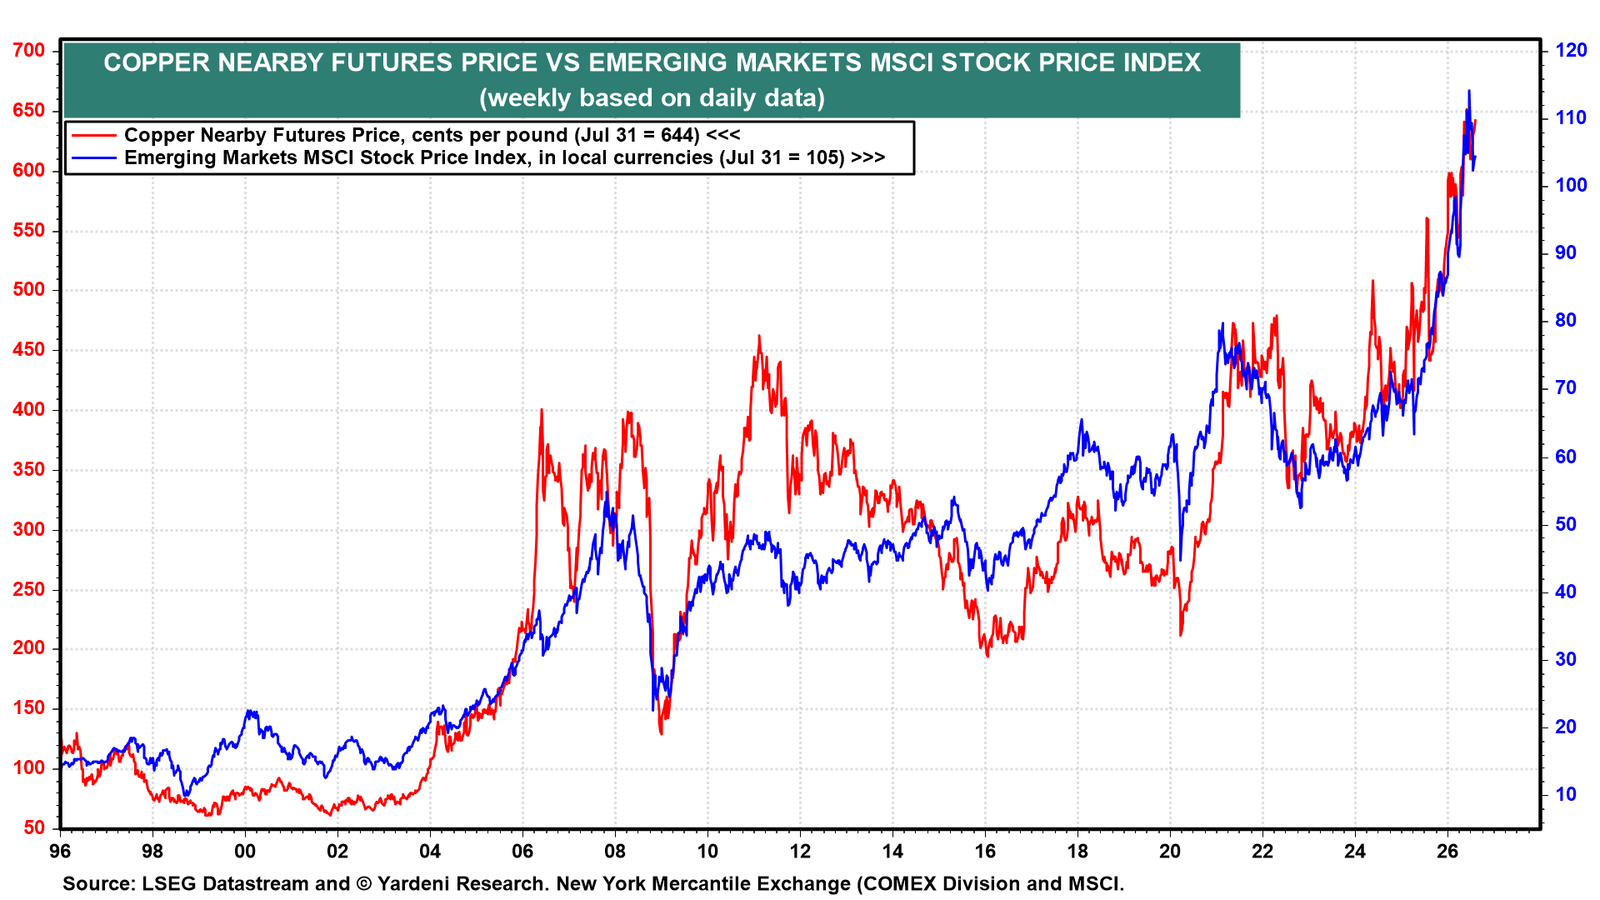
Copper is at a record high (chart). It has tracked the Emerging Markets MSCI (in local currency) closely for many years (chart). It is a sensitive indicator of global economic activity, which is getting a strong boost from the AI boom, requiring lots of copper.
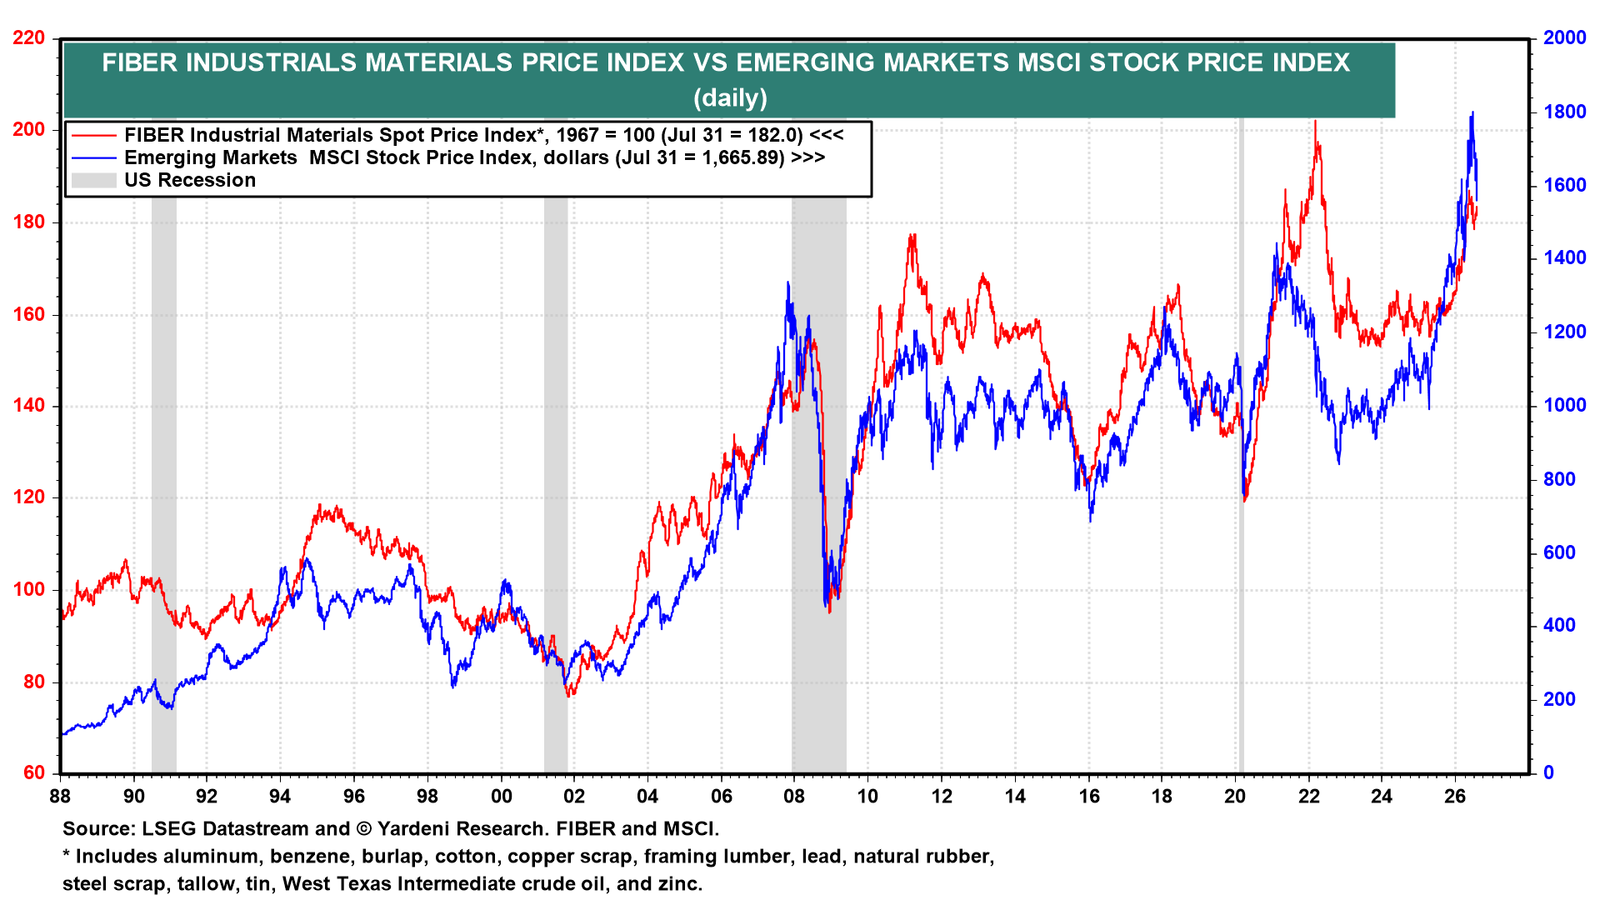
The FIBER Industrial Materials Spot Price Index is near its recent cyclical high (chart). It too is highly correlated with the Emerging Markets MSCI (in dollars). This is another sign that the global economy is performing well.
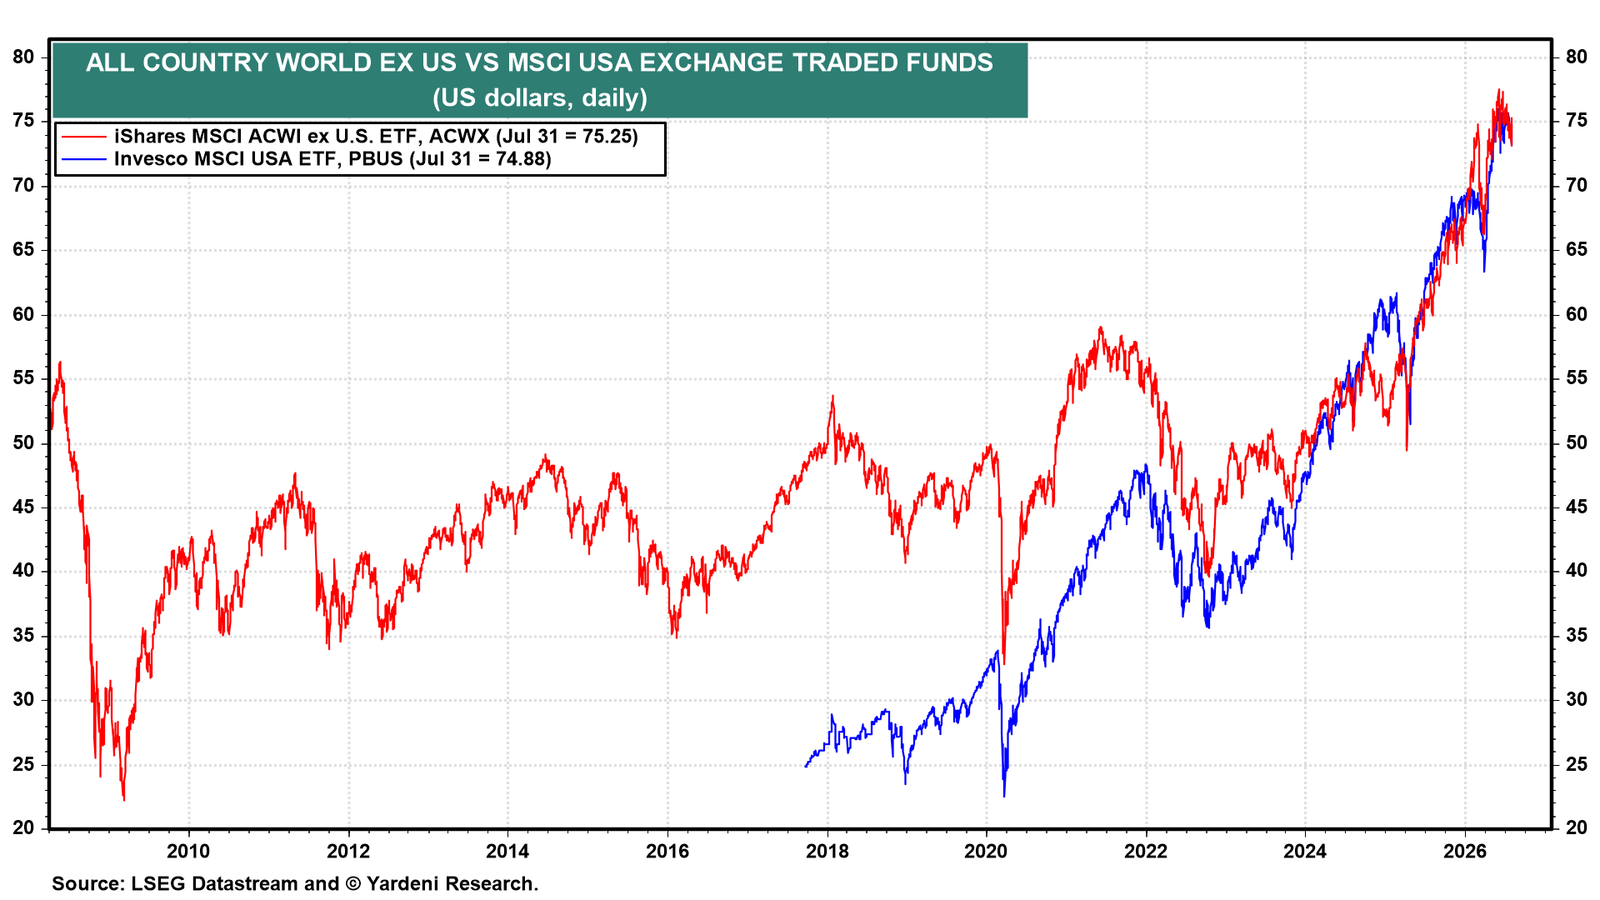
(2) Stay Home vs Go Global. The All Country World ex-US ETF and the US MSCI ETF have moved stride for stride this year, both marginally below their recent highs (chart).
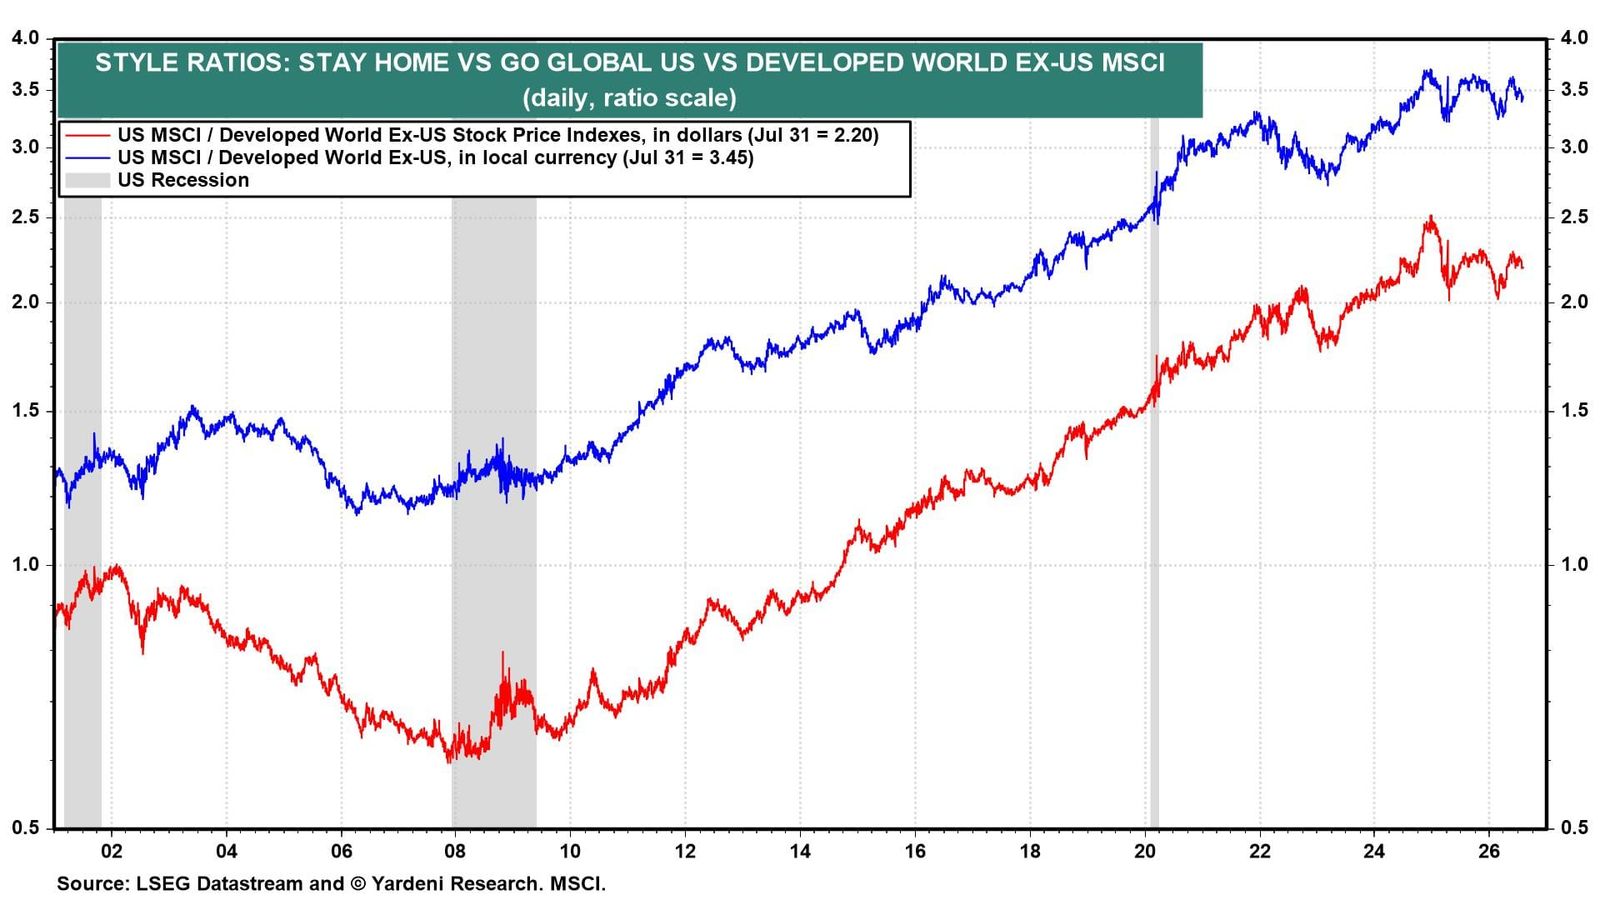
The ratios of the US MSCI to the Developed World MSCI have been relatively flat since early 2025 (chart).
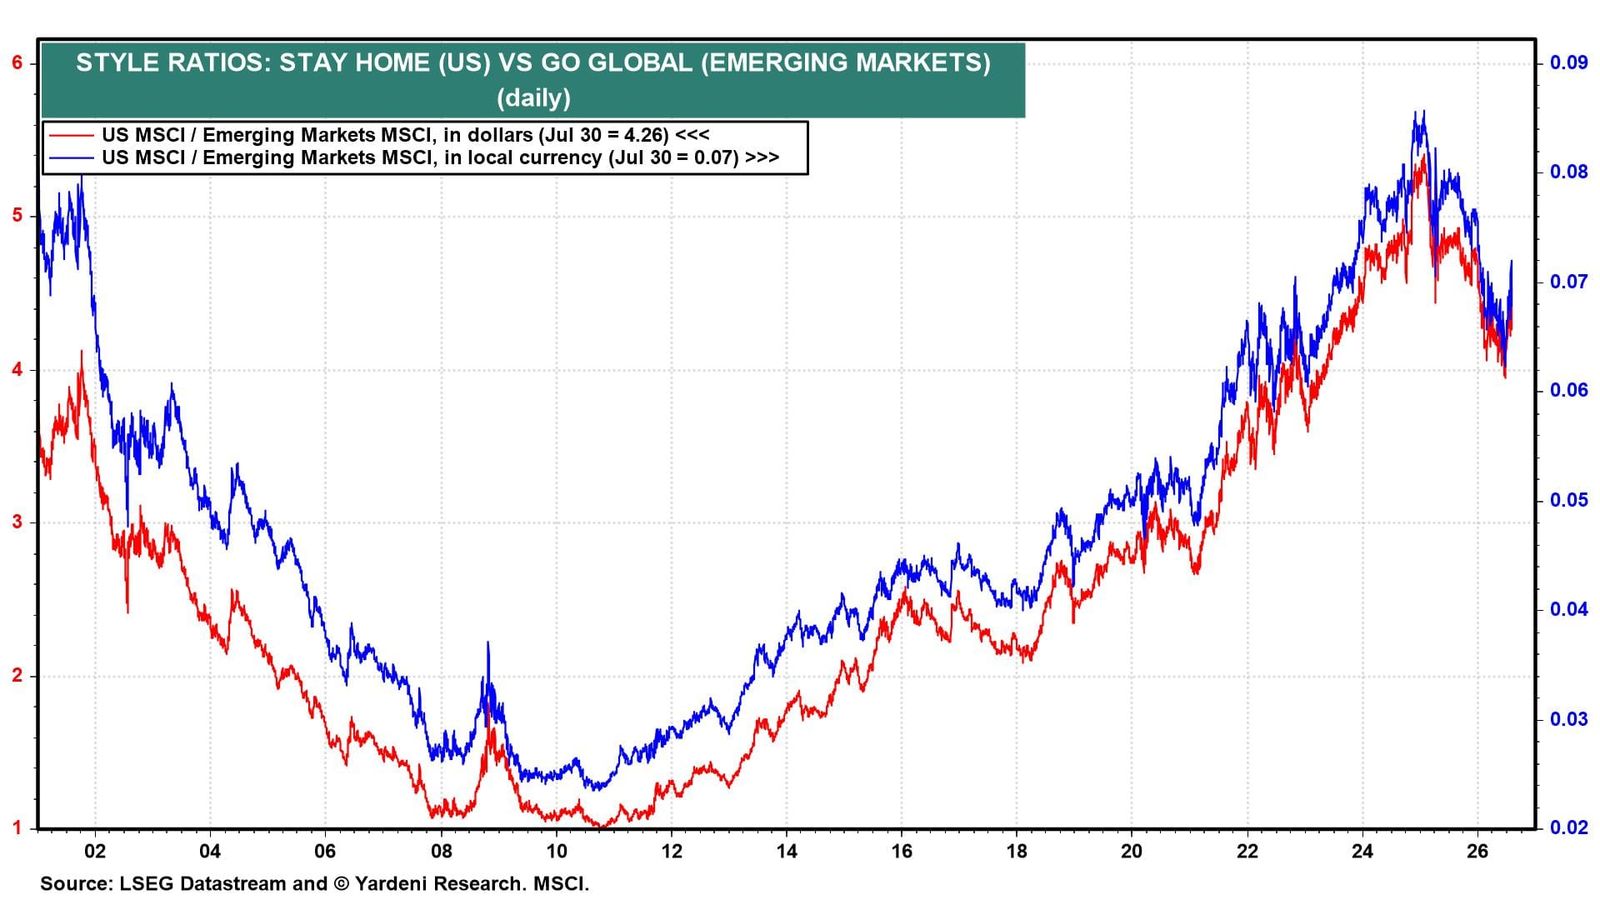
The ratios of the US MSCI to the Emerging Markets MSCI have declined sharply since early 2025. Both rose sharply in July as South Korea and Taiwan were hard hit by corrections in their AI trades (chart).
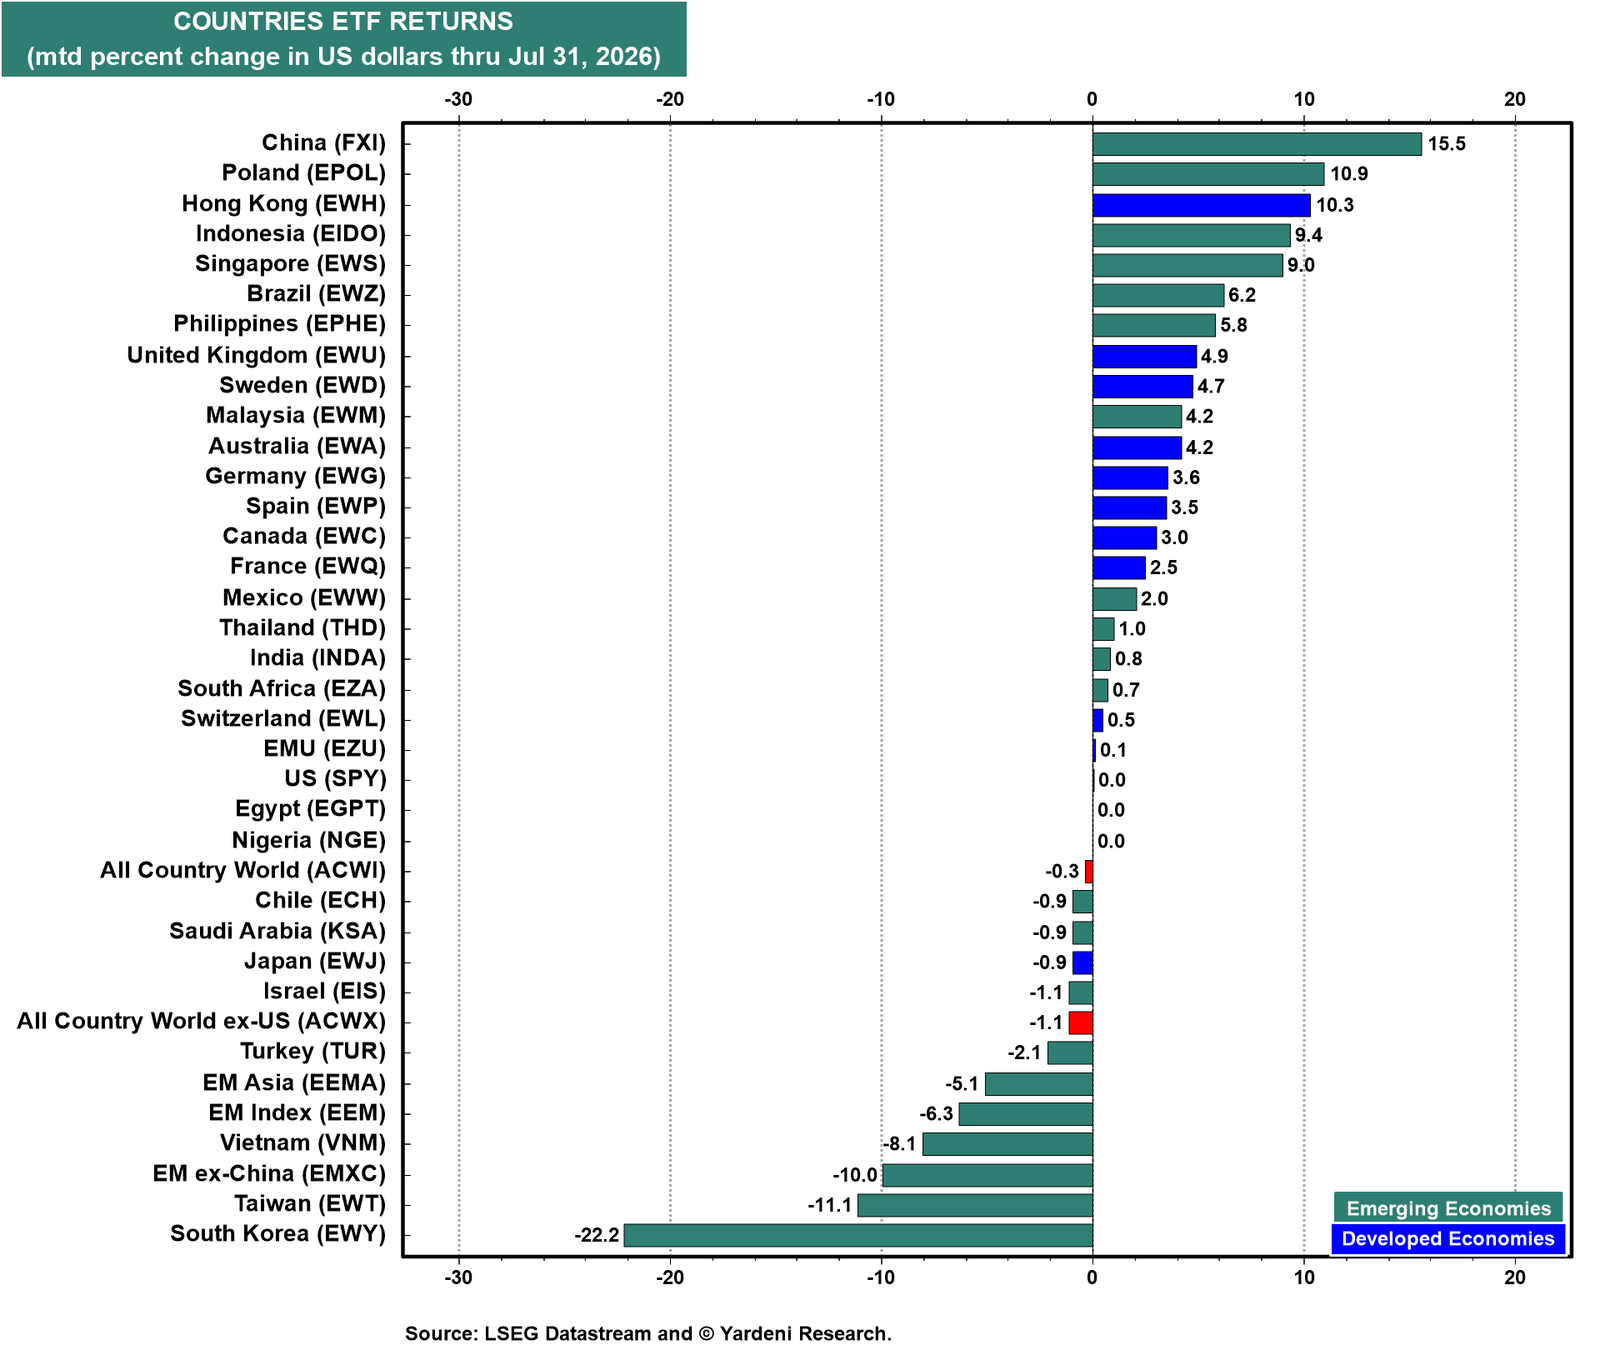
(3) Performance. China led all country ETFs in July with a 15.5% gain, with Poland, Hong Kong, Indonesia, and Singapore following as momentum shifted into the markets that had been left behind (chart). South Korea lost 22.2%, Taiwan 11.1%, and Vietnam 8.1% as the AI momentum trade faltered.
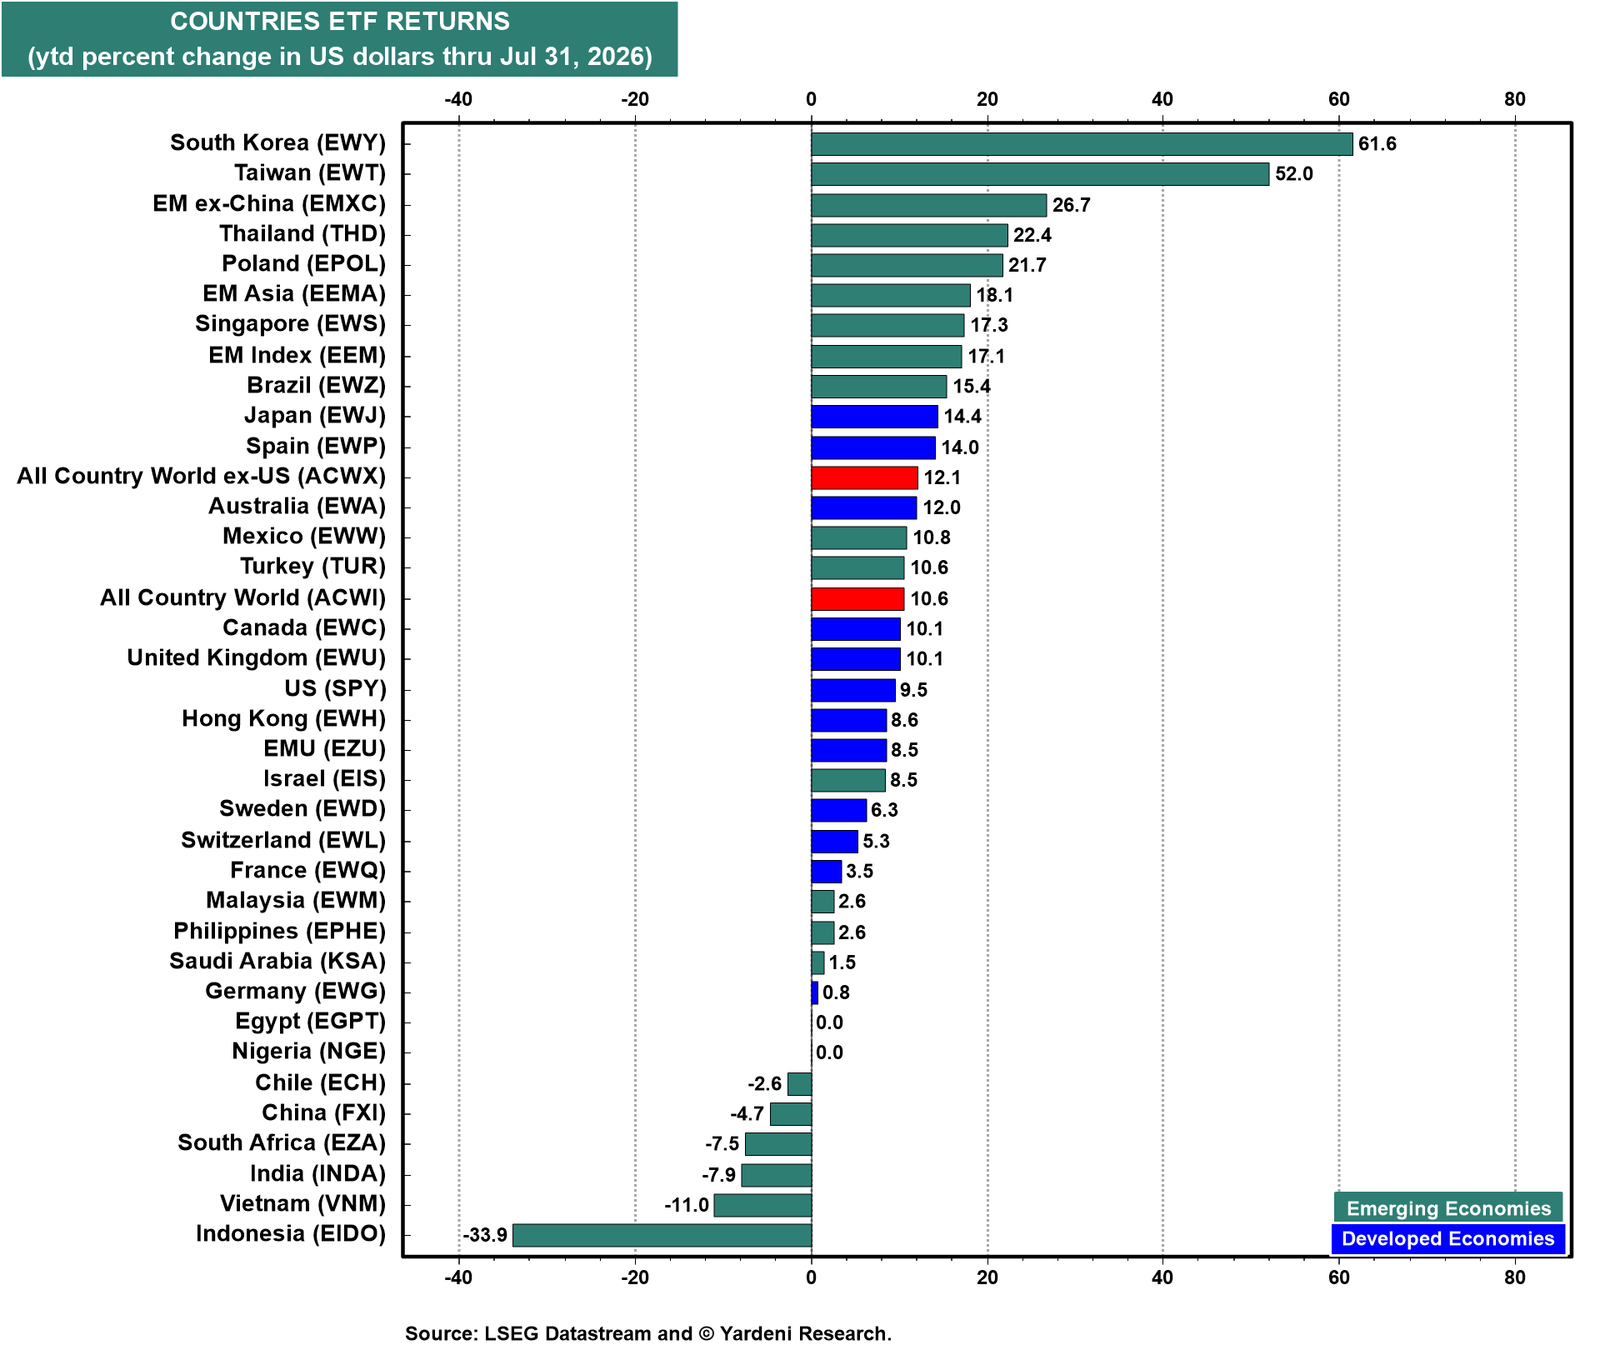
This year to date, the playbook remains the same. South Korea is up 61.6% with Taiwan up 52.0%. EM ex-China is up 26.7% versus 9.5% for the US (chart). China remains firmly negative.
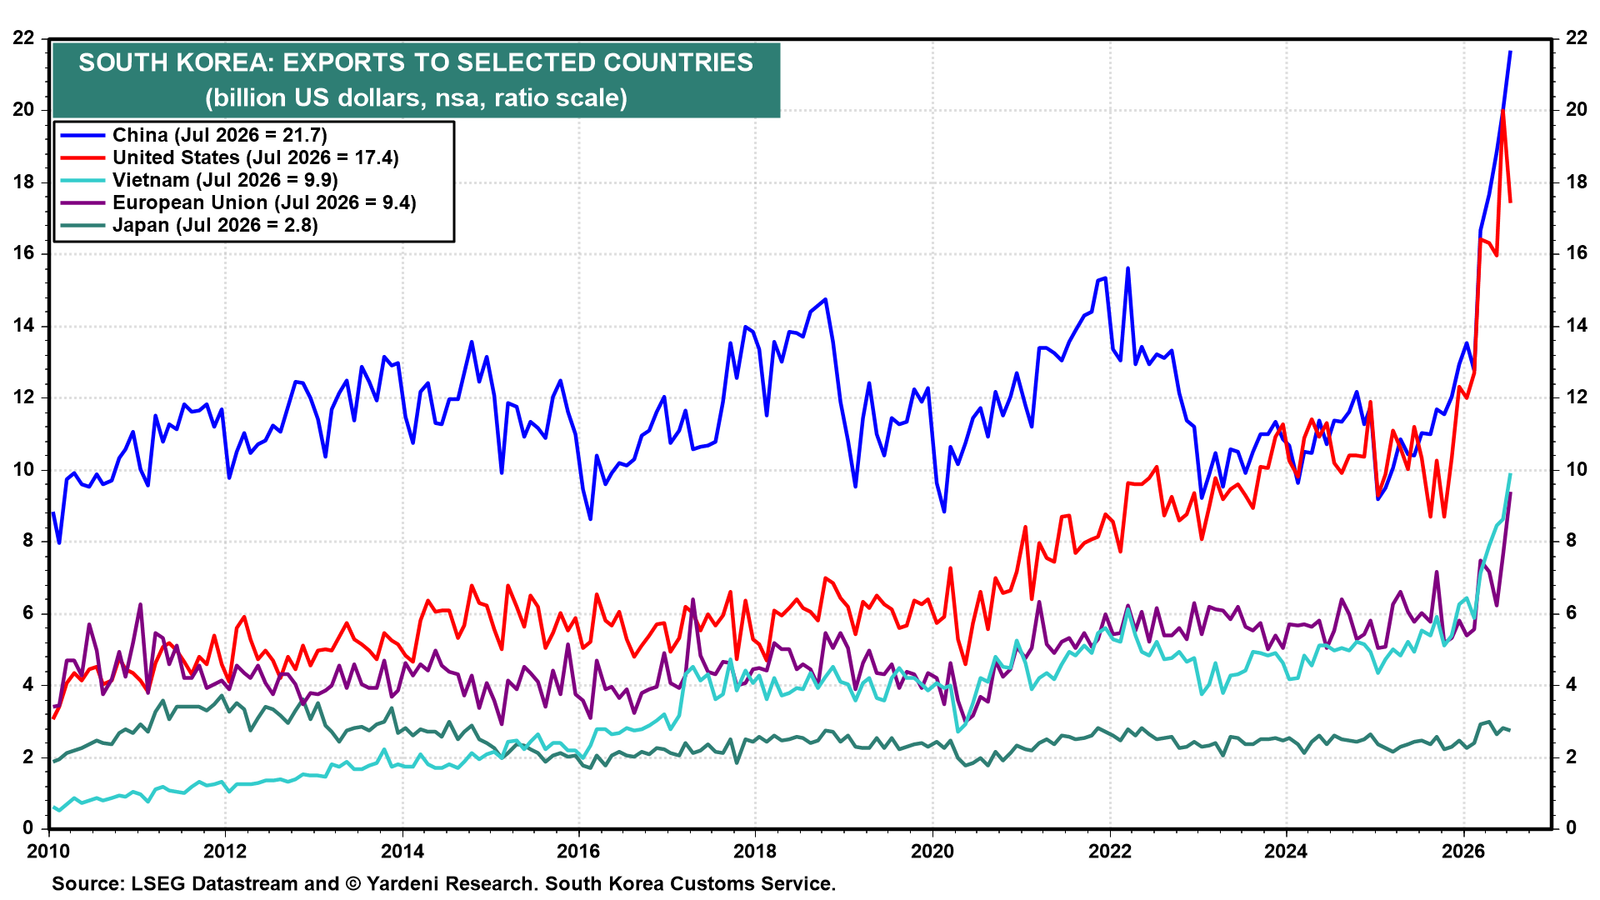
(4) South Korea. Korea leads the world’s stock markets ytd for a good reason: Its exports are booming (chart).
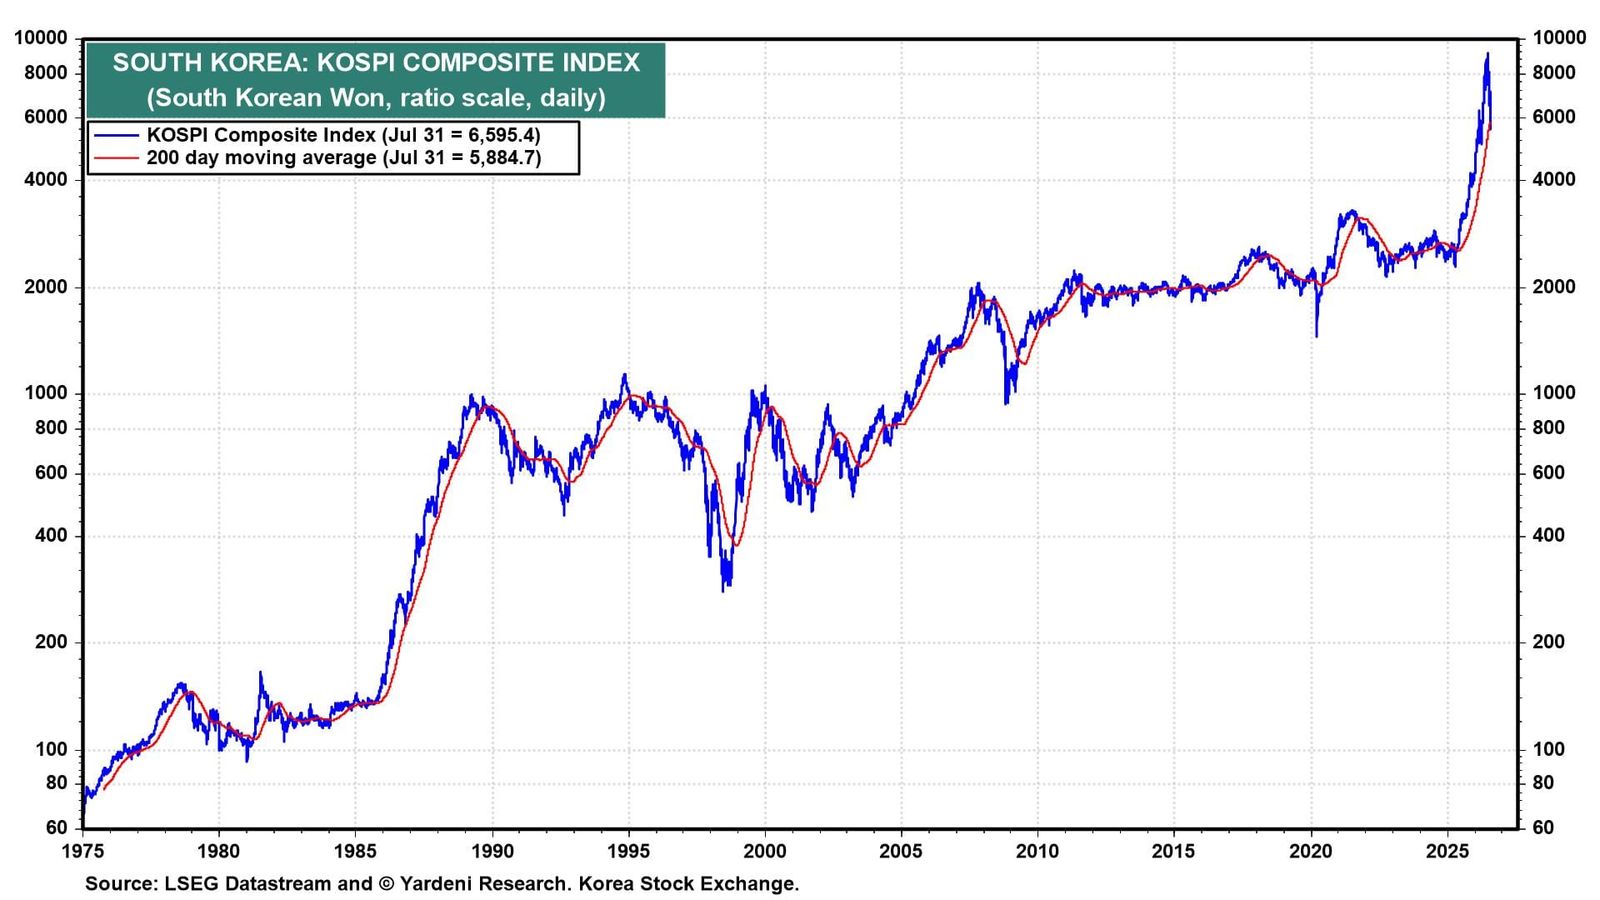
The KOSPI’s correction is a momentum unwind. The index closed July at 6,595.4 with support near its 200-day moving average of 5,884.7 (chart). Friday’s 17.91% gain shows buyers stepping in. It is still up 110% over the past 12 months.
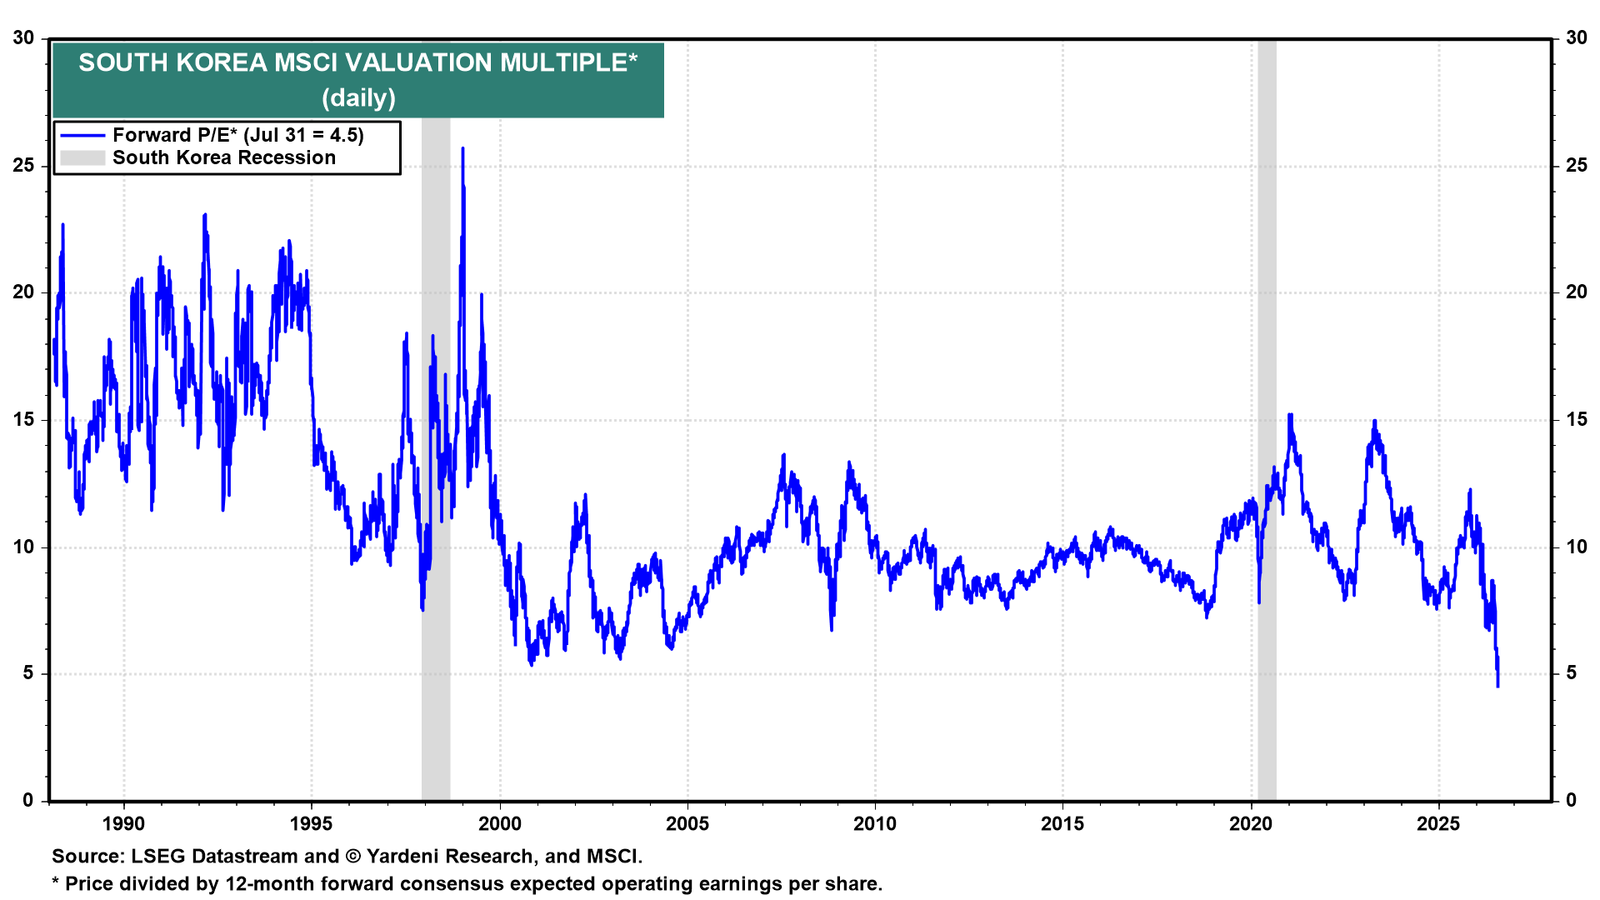
The South Korea MSCI is trading at a 4.5 forward P/E, the lowest reading in its history (chart).