The latest batch of economic data suggests that the US economy remains in remarkably good shape. Domestic demand is strong, and the labor market continues to show resilience.
Inflation isn't as picture-perfect. While June's PCED report provided some welcome relief, recent inflation shocks may spread in coming months. They include another round of tariffs, the AI building boom, high energy prices, and supply-chain disruptions. They will likely keep inflation above the Fed's 2% y/y target.
Let's review the recent batch of economic indicators:
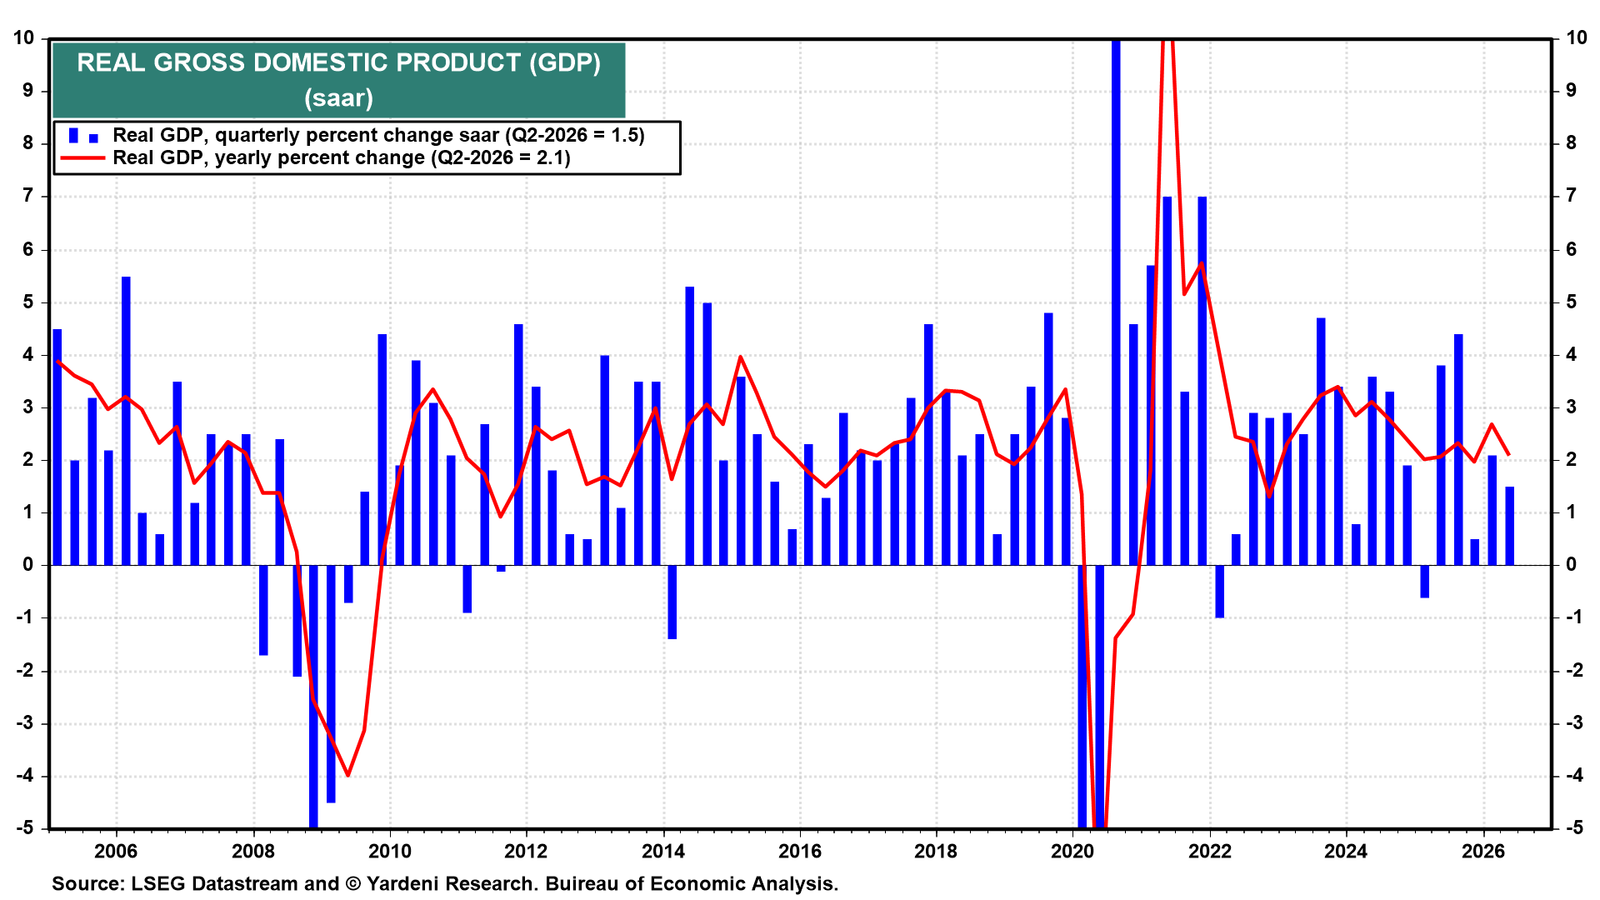
(1) GDP. The US economy expanded at a 1.5% annualized rate in Q2-2026, down from 2.1% in Q1 (chart). At first glance, the slower growth rate suggests that the economy lost some momentum during the quarter. A closer look suggests otherwise.
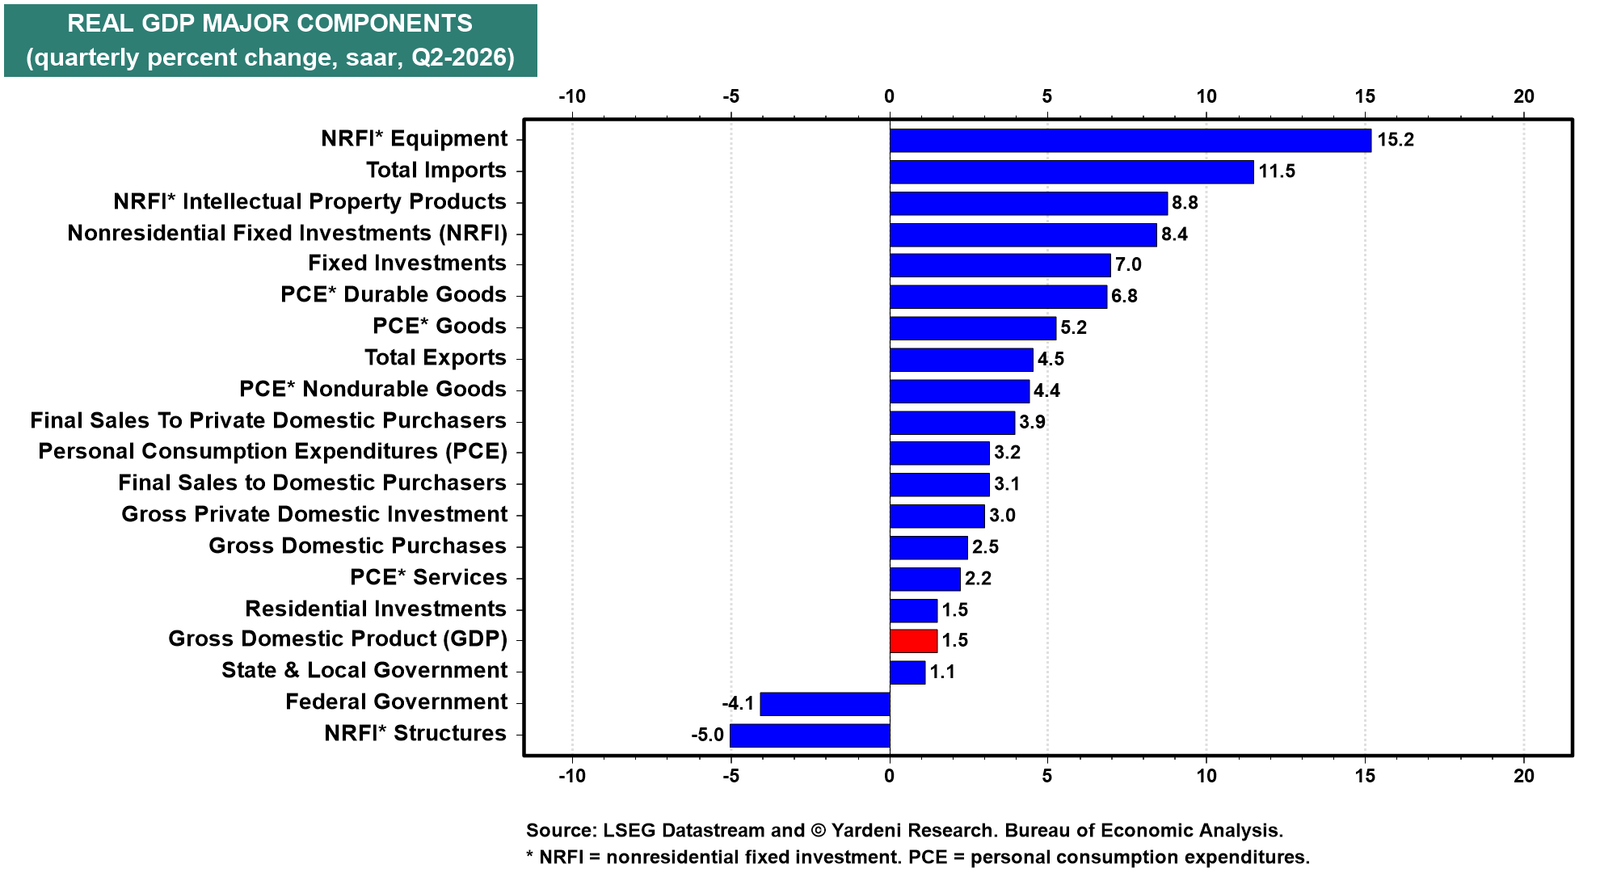
Underlying demand was quite strong. Final sales to private domestic purchasers, a key measure of underlying demand that excludes volatile trade and inventory swings, rose 3.9%, the strongest increase since Q1-2023 (chart)! Consumer spending increased 3.2%, up from 0.5% in Q1. Nonresidential fixed investments jumped 8.4%.The weakness in headline GDP largely reflected trade, as an 11.5% surge in imports caused net exports to subtract 1.5 percentage points from growth. AI-related imports have been especially strong.
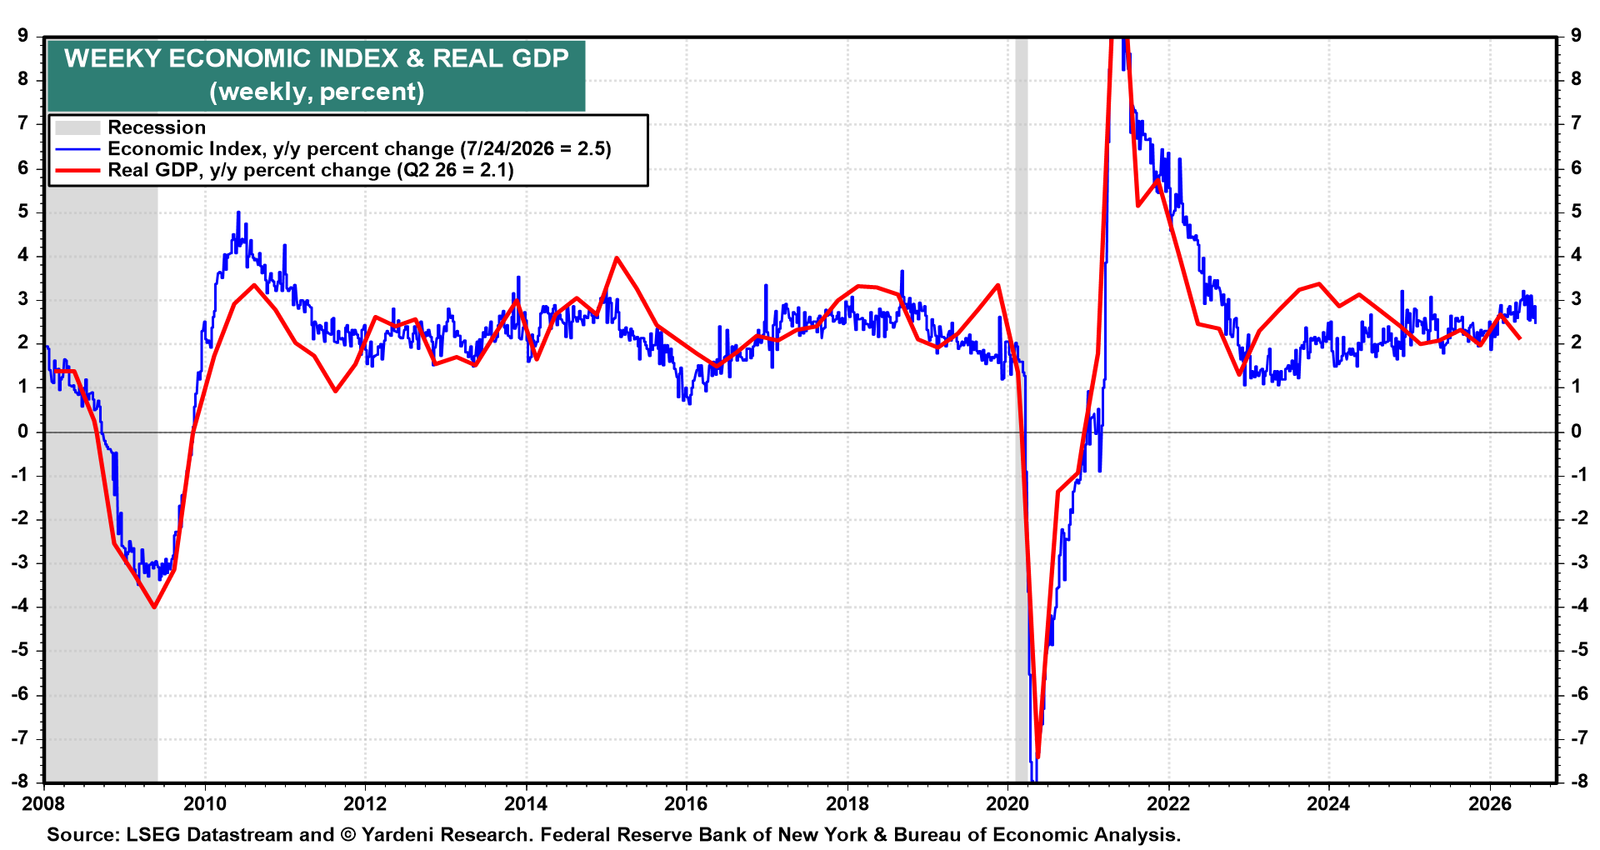
The Weekly Economic Index eased to 2.5% for the week ended July 24 but continued to signal a solid start to Q3 economic activity (chart).
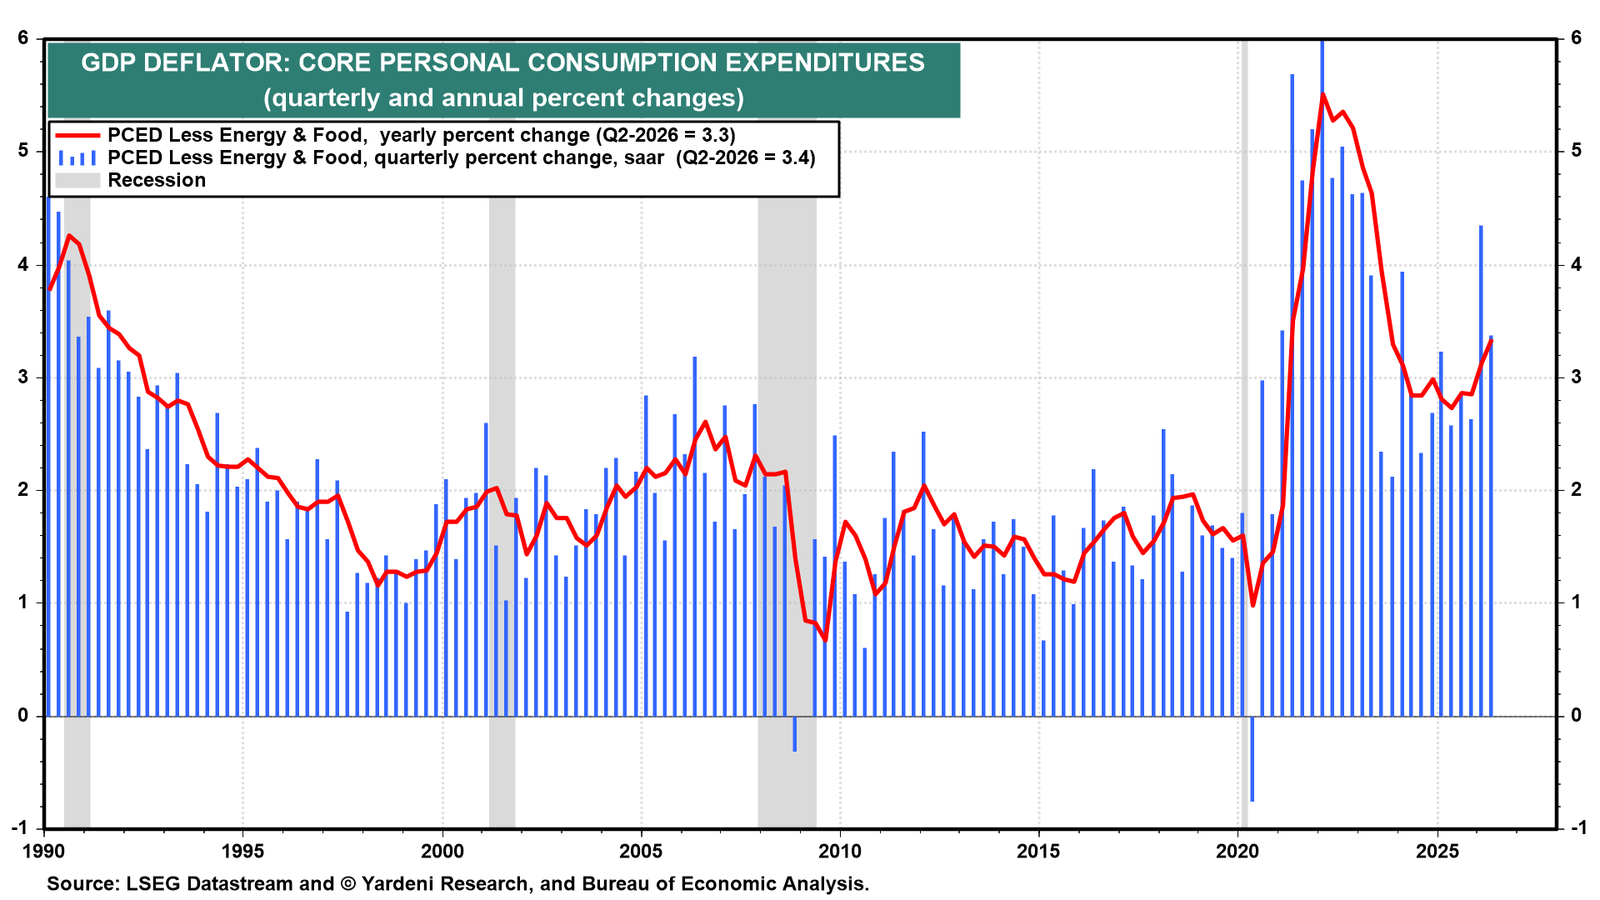
(2) Inflation. In Q2's GDP report, inflation remained troublesome. The core PCE rose at a 3.4% annualized rate, well above the Fed's 2.0% target (chart).
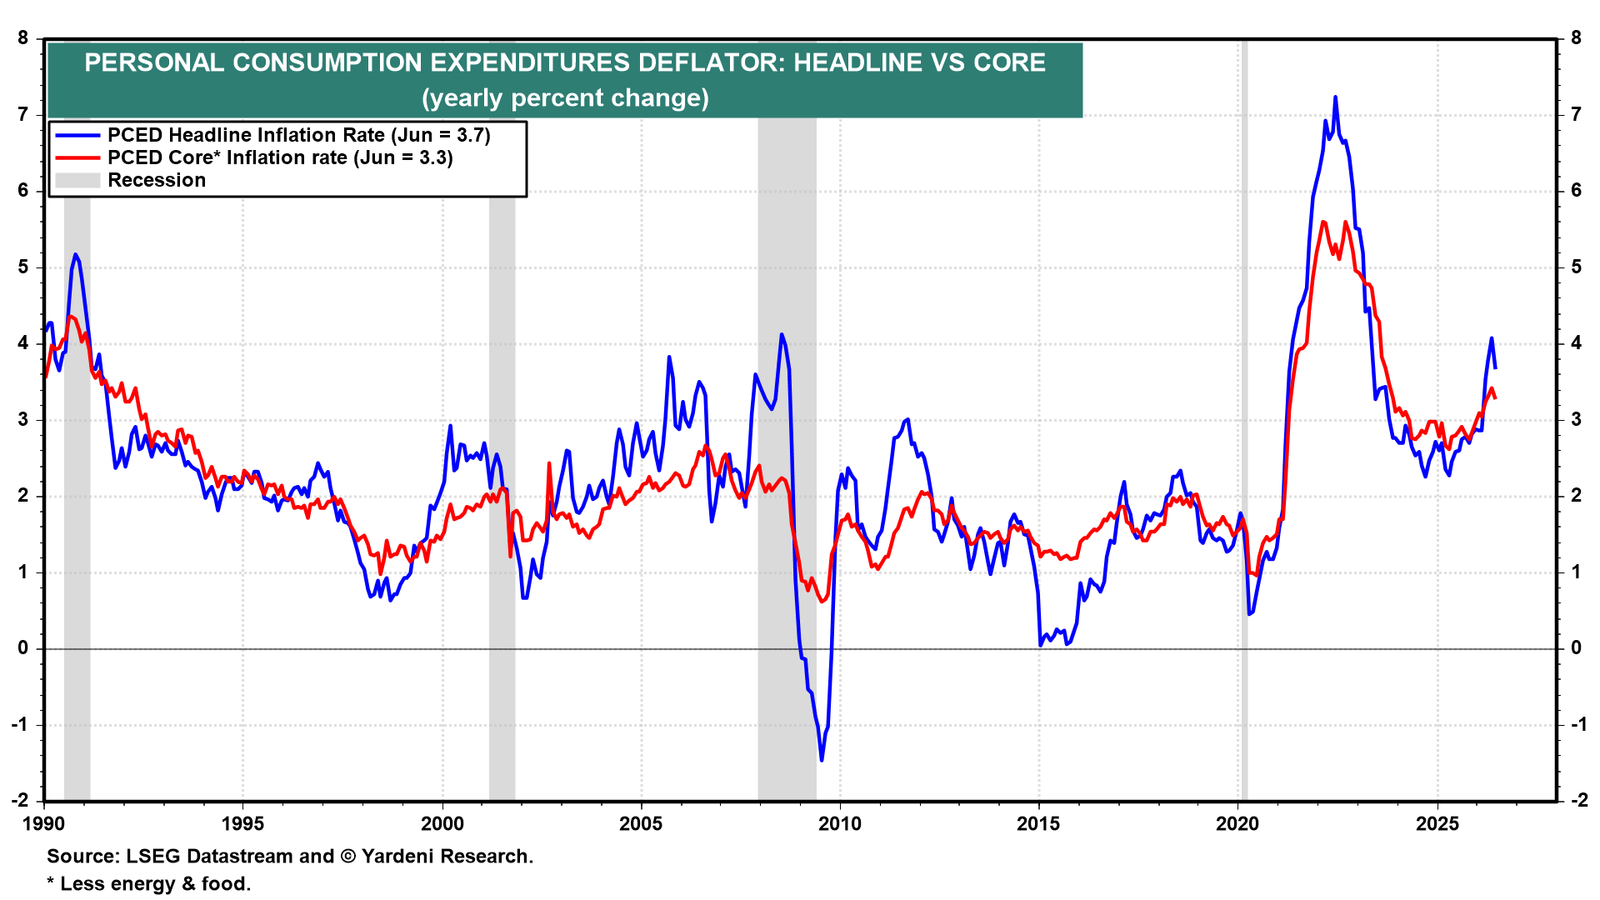
Headline PCED inflation declined 0.1% m/m in June, but was still up 3.7% y/y (chart). The core reading, which excludes volatile food and energy prices, was up 0.1% m/m and 3.3% y/y.
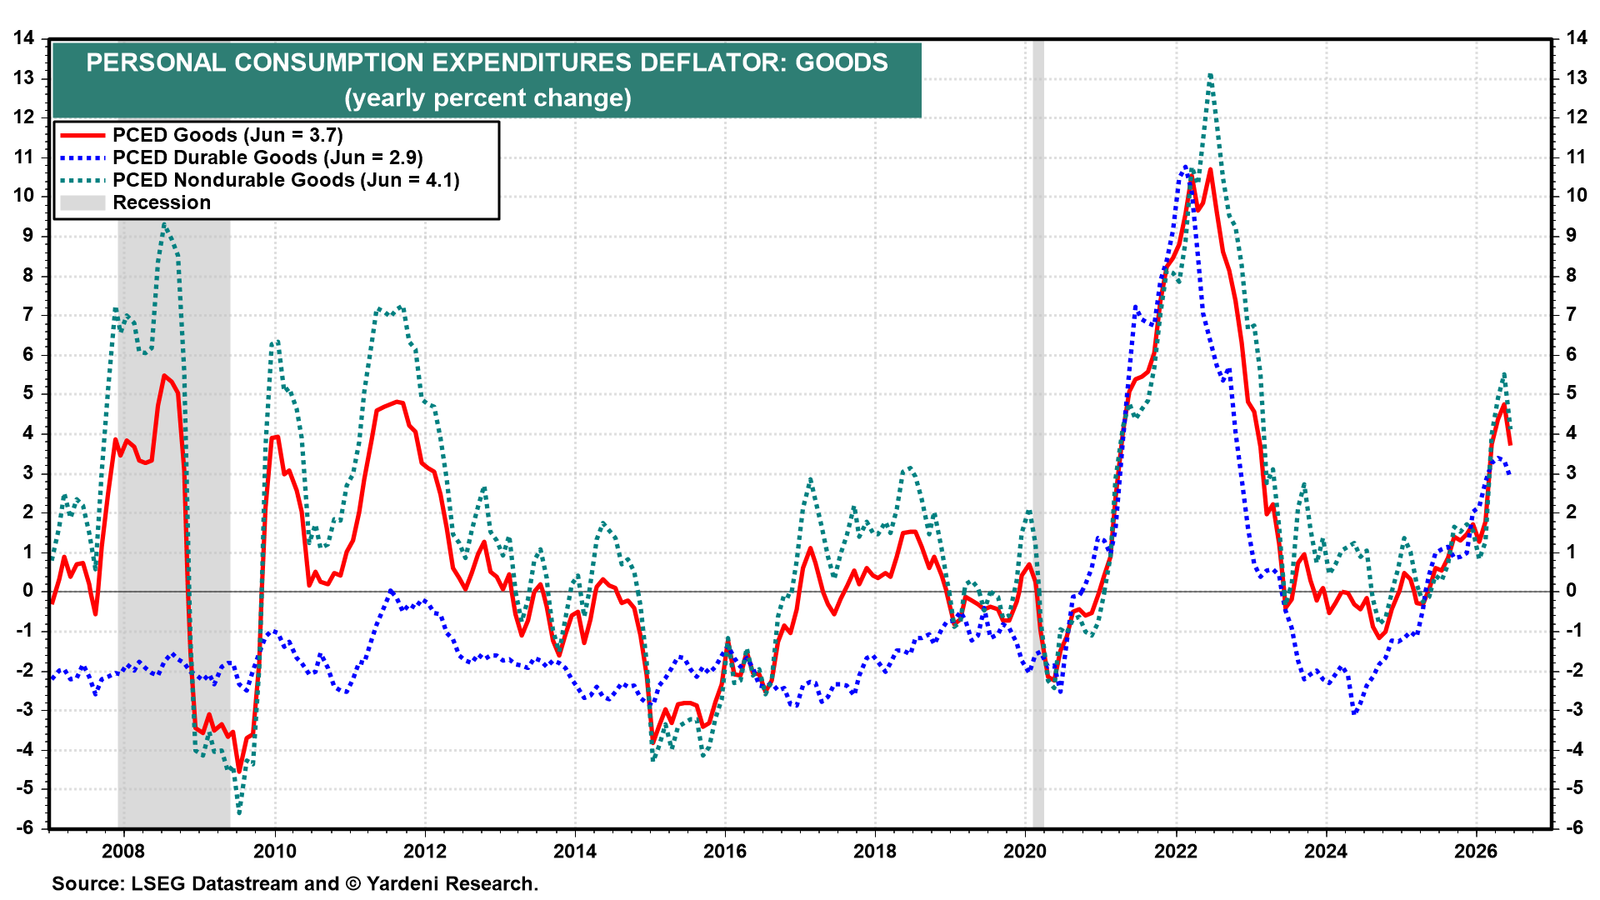
The PCED for goods eased to 3.7% y/y in June from 4.0% in May (chart). Much of the moderation reflected a 9.6% m/m drop in gasoline prices. Meanwhile, tariff-related price pressures have yet to fully fade, and the ongoing AI buildout should continue to boost inflation across the technology ecosystem. Together, these forces suggest that goods inflation will remain elevated in the months ahead.
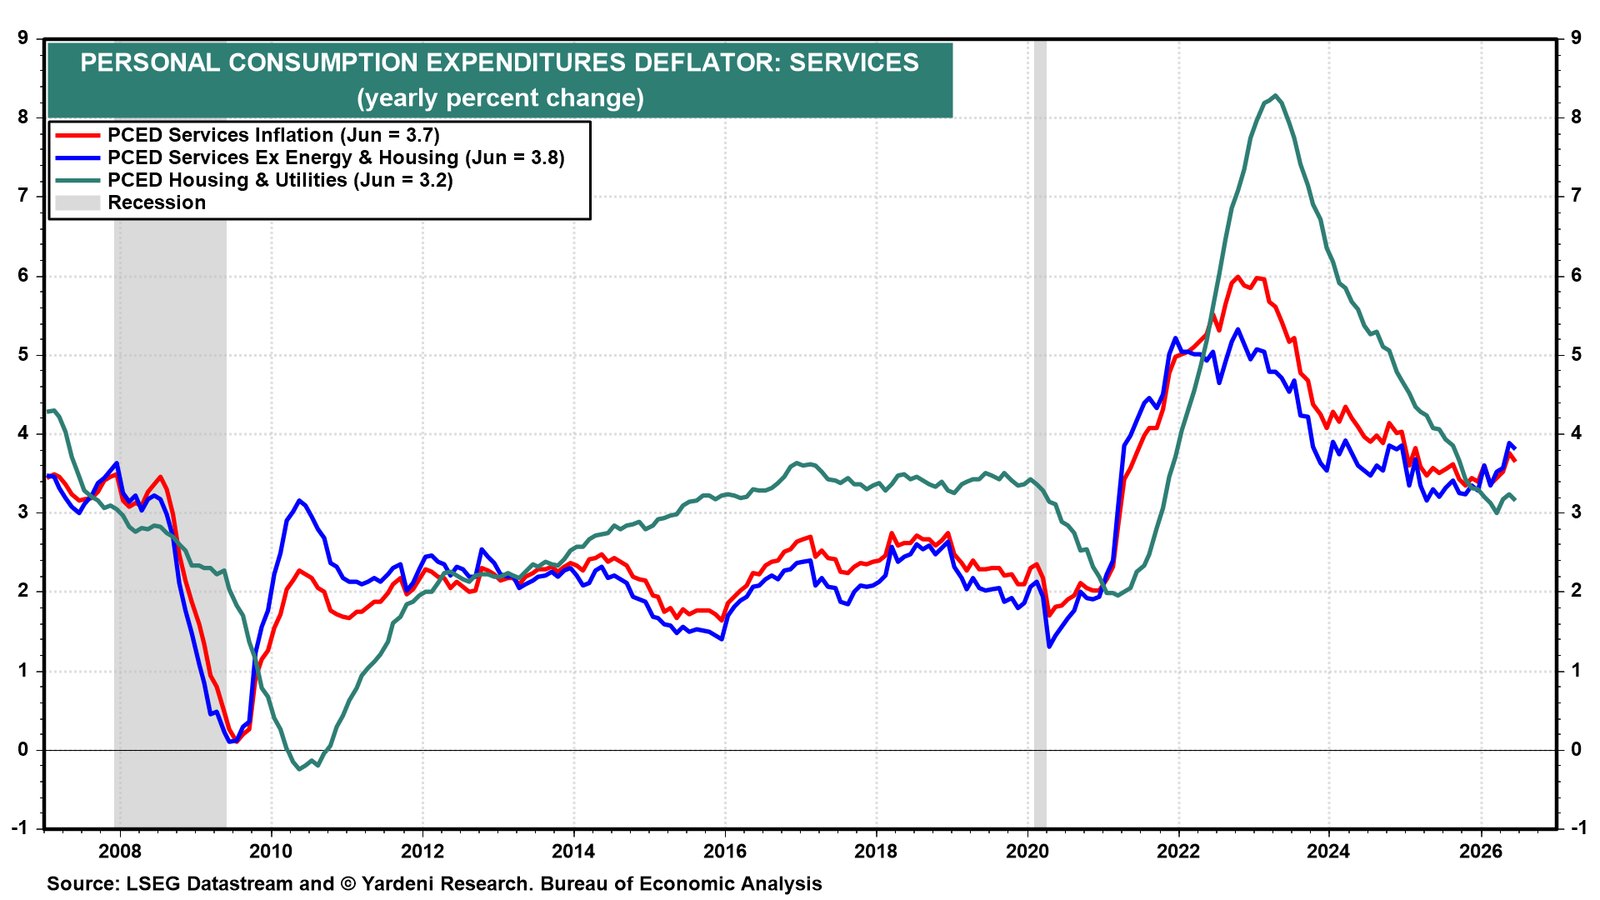
The PCED for services eased to 3.7% y/y in June (chart). "Supercore" PCED for services (excluding both energy and housing) edged down to 3.8% y/y (chart). Part of the improvement reflected weakness in volatile categories such as hotel accommodations and nonprofit services. It remains stuck above 3.0%.
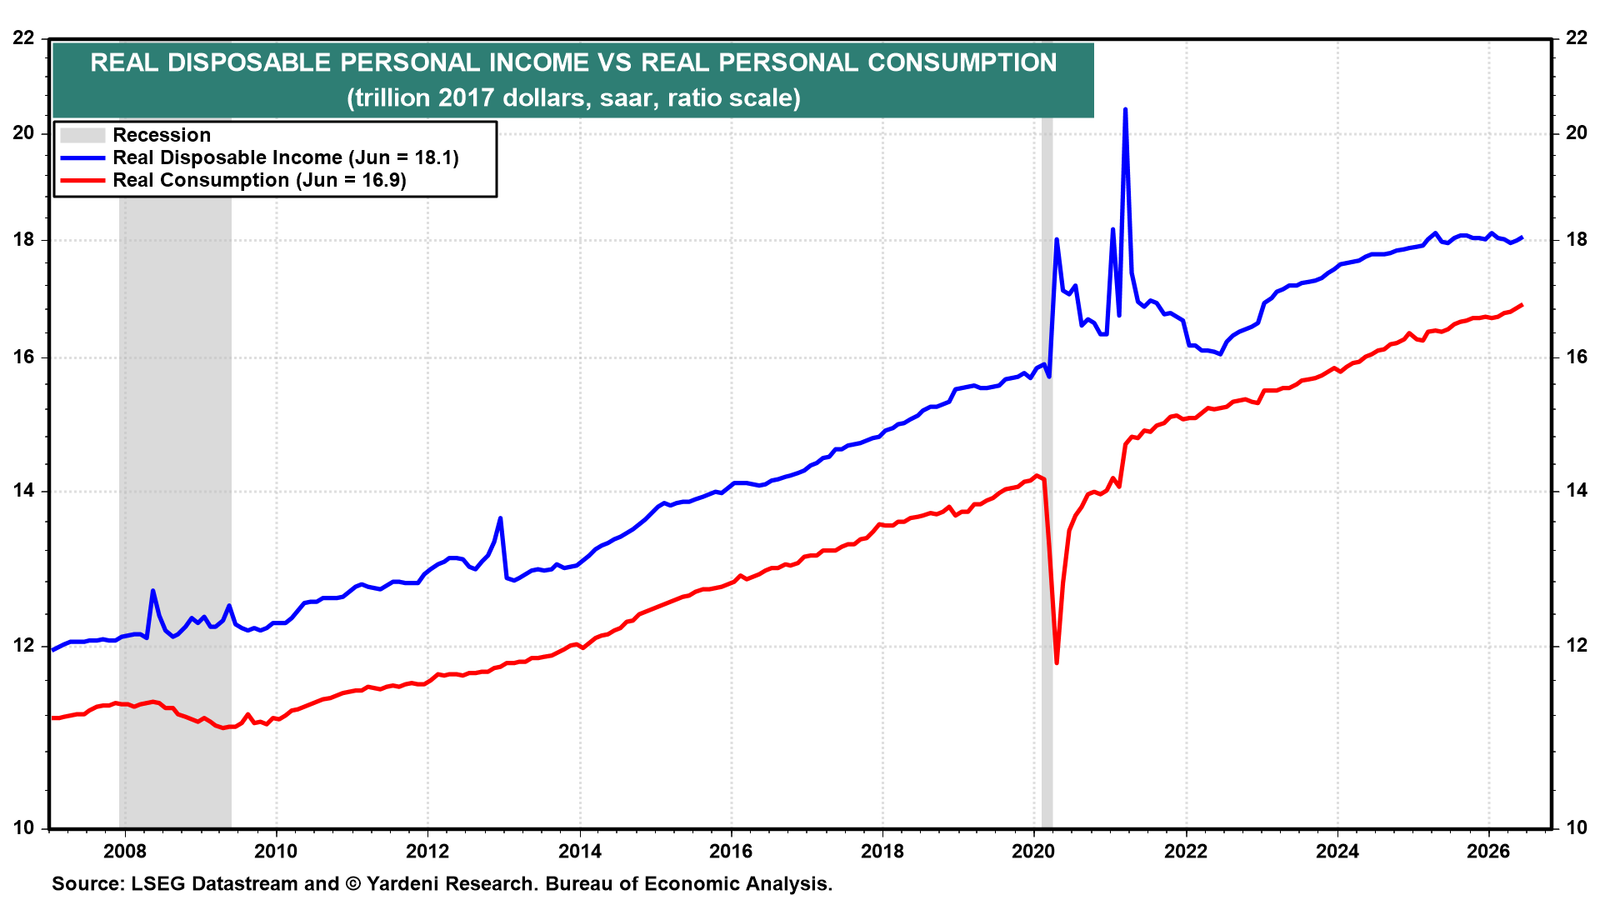
(3) Consumer spending and income. Americans continue to shop. Real consumer spending rose to another record high in June (chart). Real disposable personal income (DPI) posted its third monthly increase since January. Nevertheless, real DPI has been flat for over a year and should remain so with Baby Boomers continuing to retire.
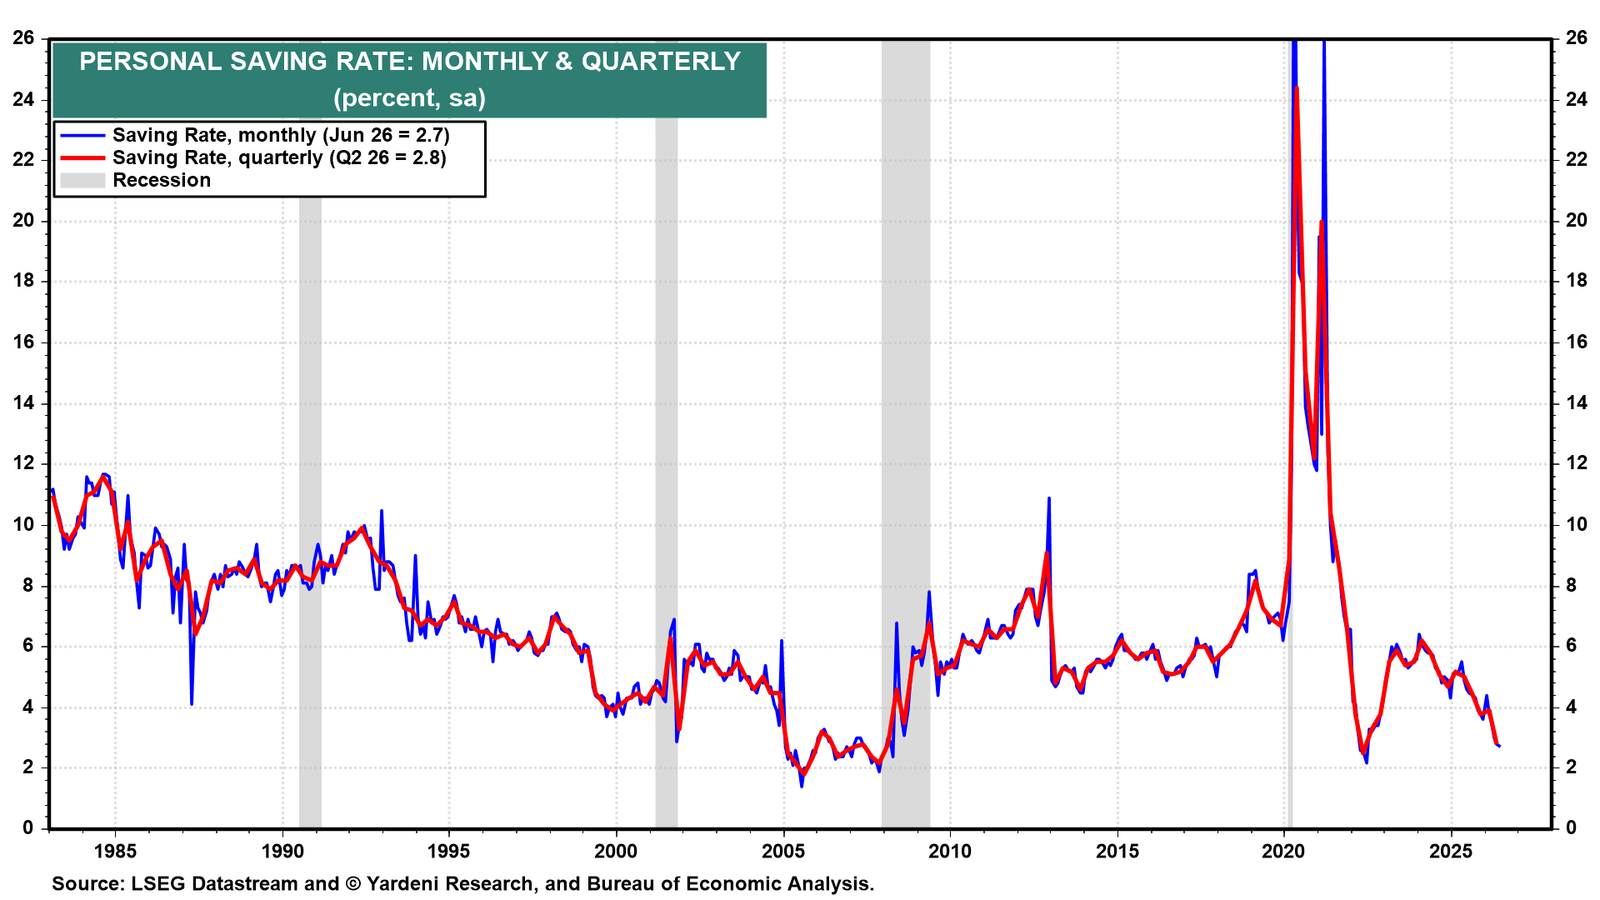
June's saving rate declined to 2.7%, the lowest since 2022 (chart). We expect it will continue to fall as more Baby Boomers retire. They no longer earn labor income, but they are continuing to spend their sizeable net worth.
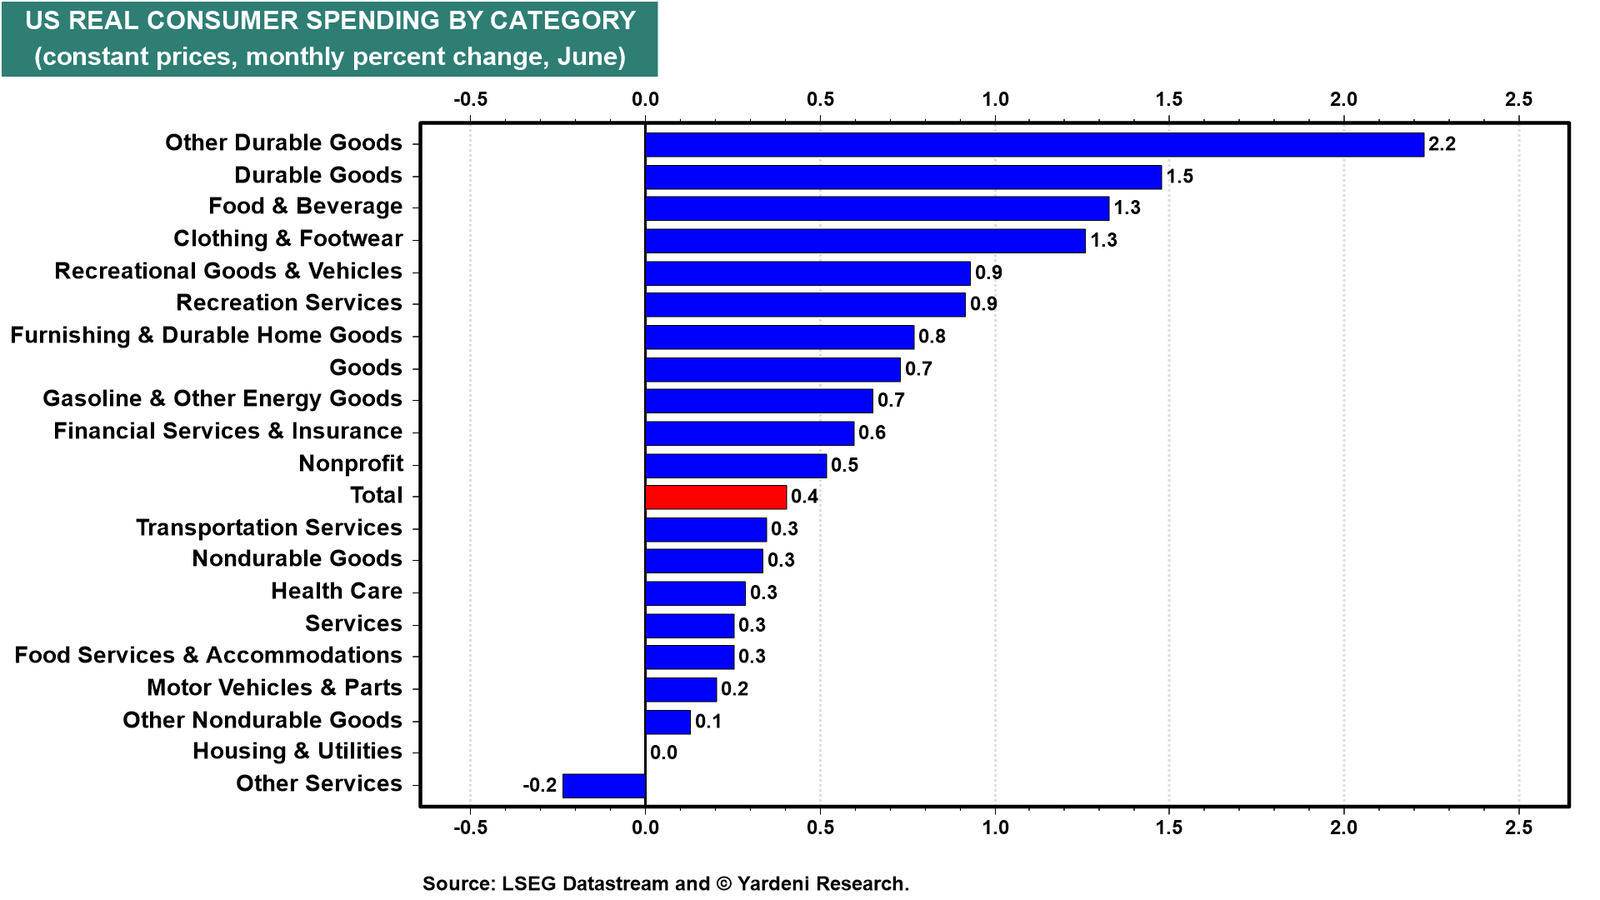
Real consumer spending rose 0.4% m/m in June, lifting the three-month average growth rate to its highest level since August 2025. Gains were broad-based, with particularly strong increases in discretionary categories such as restaurants and hotels, recreation, and apparel (chart).
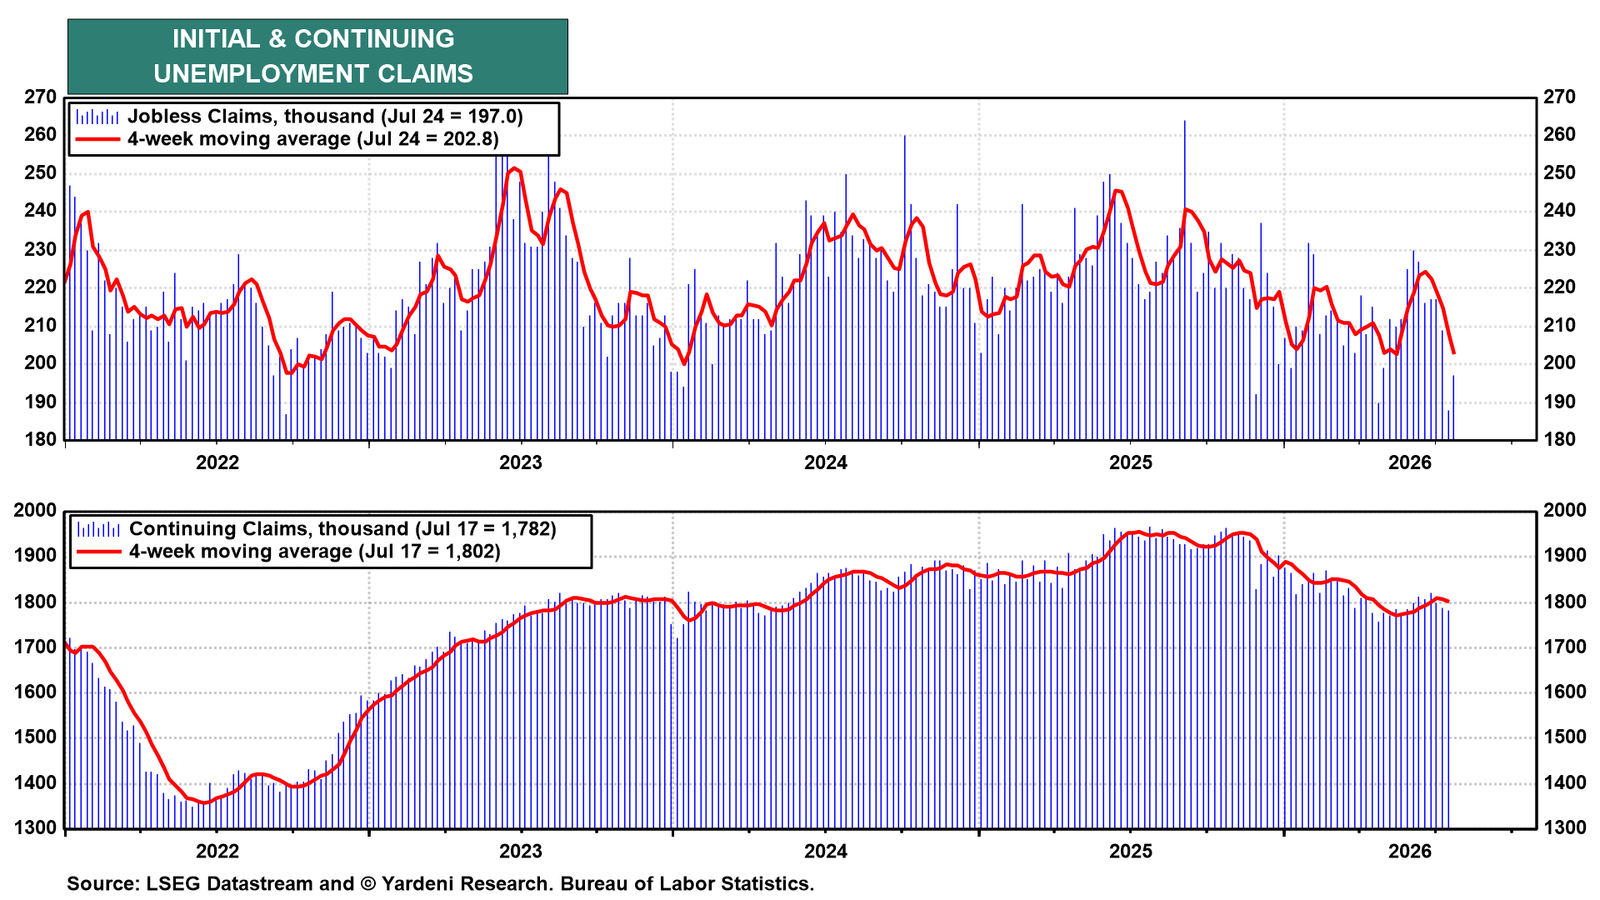
(4) Labor market. Initial unemployment insurance claims rose to 197,000 in the latest week, but the four-week average fell to its lowest level since January 2024. Continuing claims declined for a third straight week. These numbers underscore the labor market's resilience (chart).