I. Stocks, Bonds & Waller
Today, the S&P 500 had its best day in a month as Treasury yields edged lower and the dollar dropped to its lowest level since May. The policy-sensitive 2-year Treasury yield retreated to 4.34% after briefly rising to 4.41% on Tuesday. These moves reflect a decline in the probability of a September rate hike to about 50%, down from 70% earlier this week.
The catalyst was comments from Fed Governor Christopher Waller. While he said he's willing to hold the policy rate steady if progress toward the Fed's 2% inflation target continues, he also stressed that it would not take much evidence of persistent inflation pressures to support a hike. With recent data showing "some signs of disinflation," the burden of proof is now on the inflation data to justify a hike.
The financial markets concluded that Waller is an owl, i.e., an FOMC voter watching incoming inflation data before deciding whether to vote for a hike at the Committee's September 15-16 meeting. We reckon that of the 12 voters on the FOMC, five are hawks (i.e., ready to hike), while six are owls. That's why bonds and stocks rallied today when Waller joined the latter birdies.
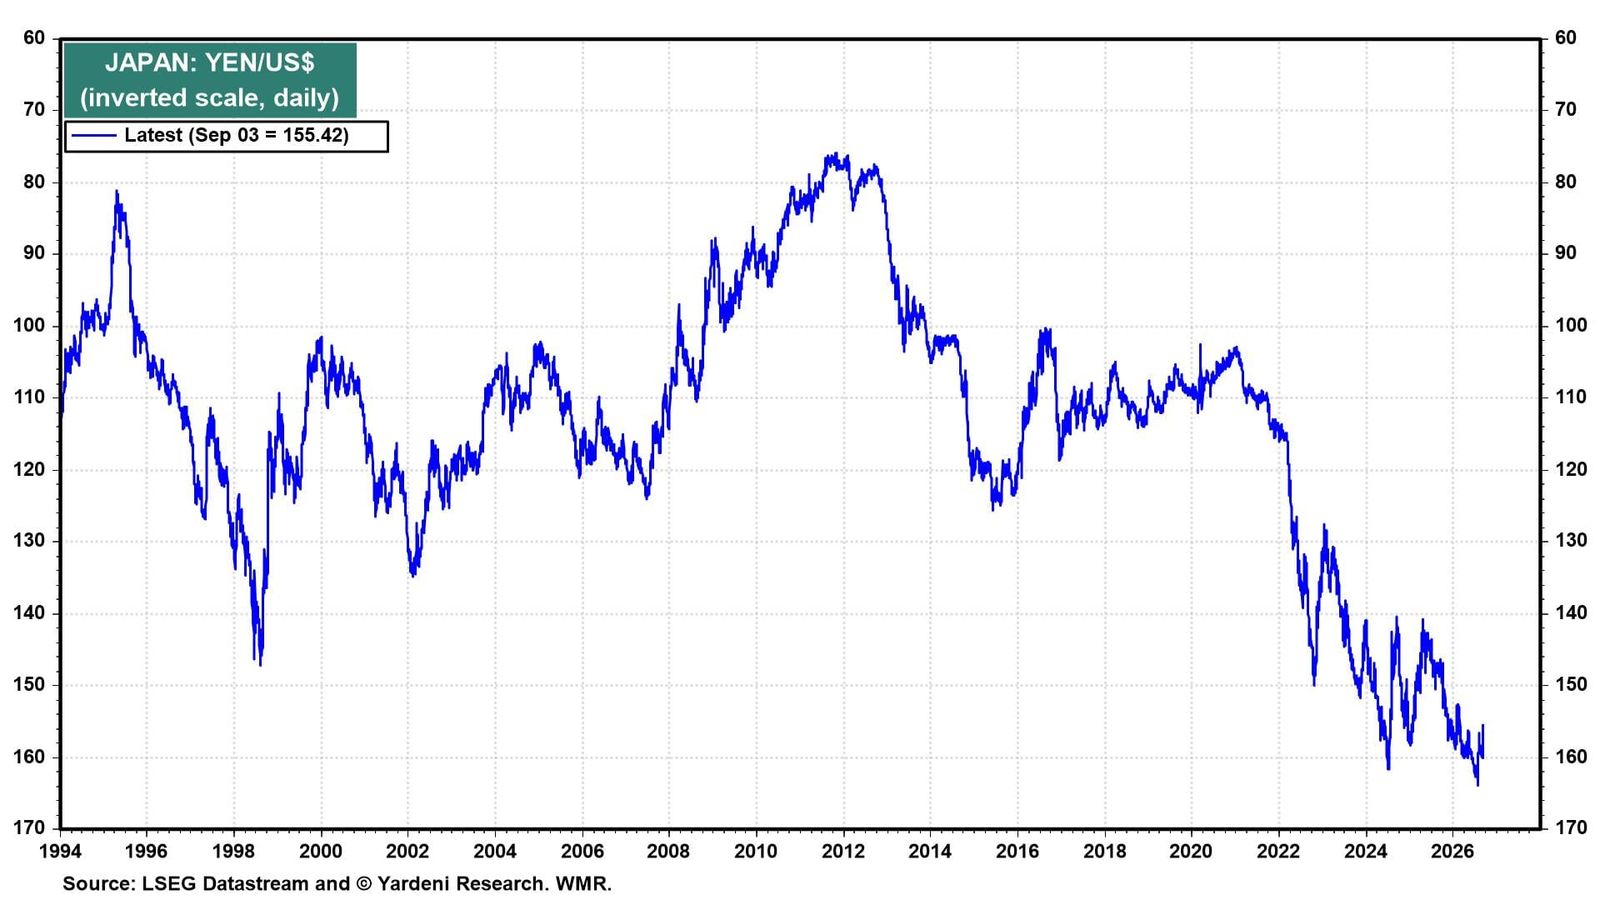
They also rallied today because the yen rebounded, without any intervention by the Bank of Japan, on expectations that the central bank will soon raise its policy rate and on second thoughts about a Fed rate hike (chart).
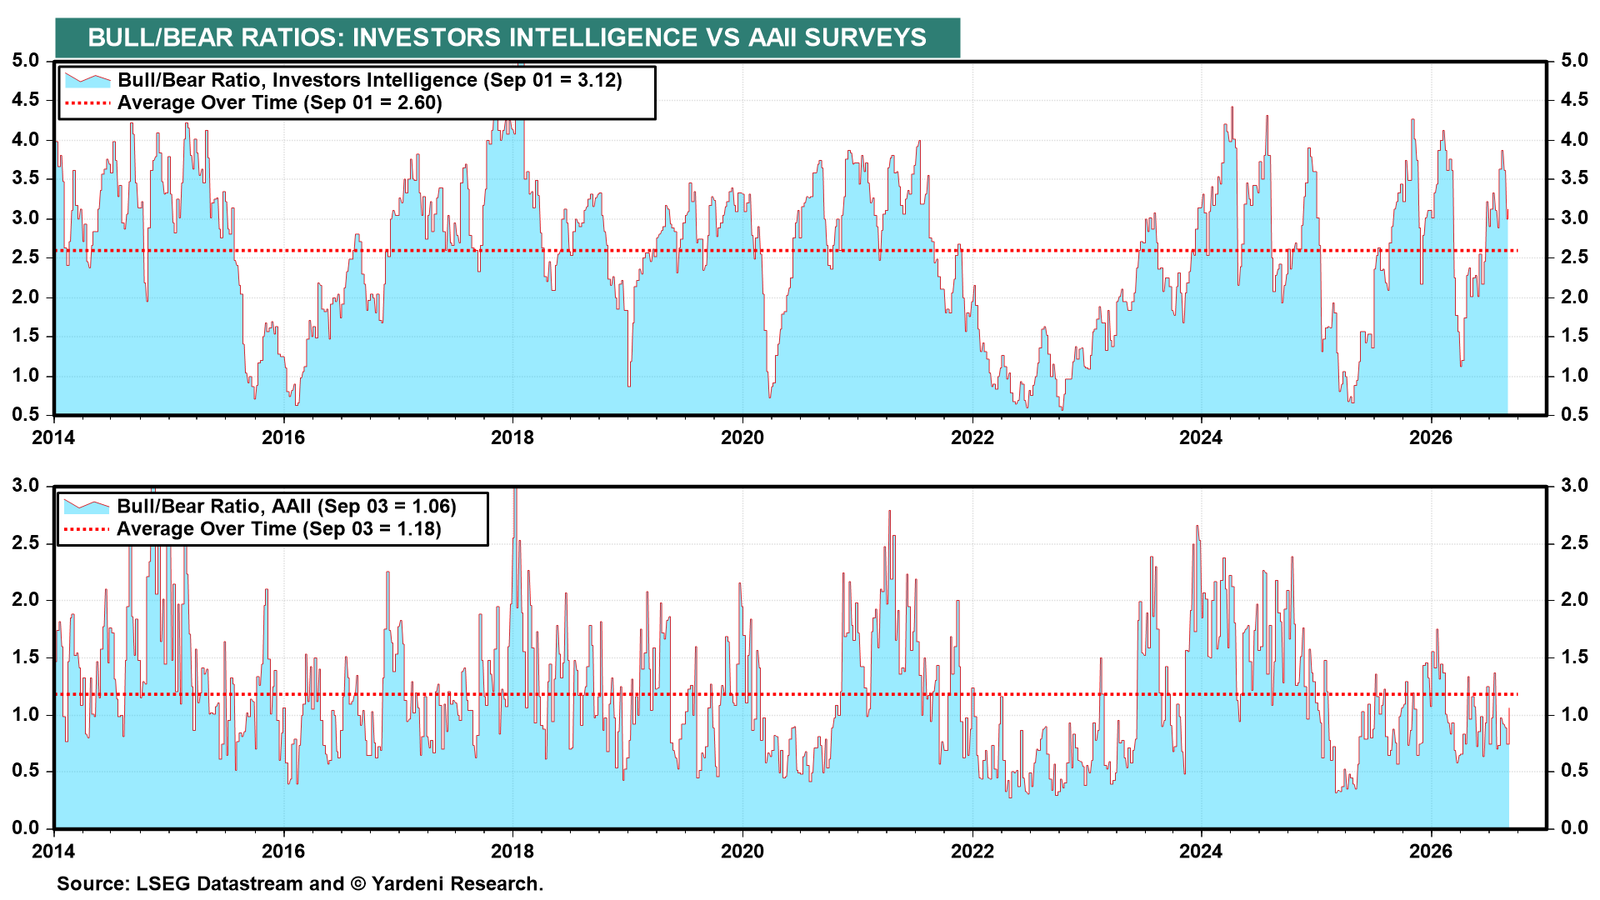
The good news is that stocks should do well, as Fabulous Earnings Momentum (FEMO) reported by Broadcom, Dell, and Snowflake continues to support the bull market. Our two favorite bull-bear ratios remain relatively neutral, providing neither a strong buy nor sell signal (chart). FEMO, however, is sending a loud buy signal!
II. GDP & Bonds
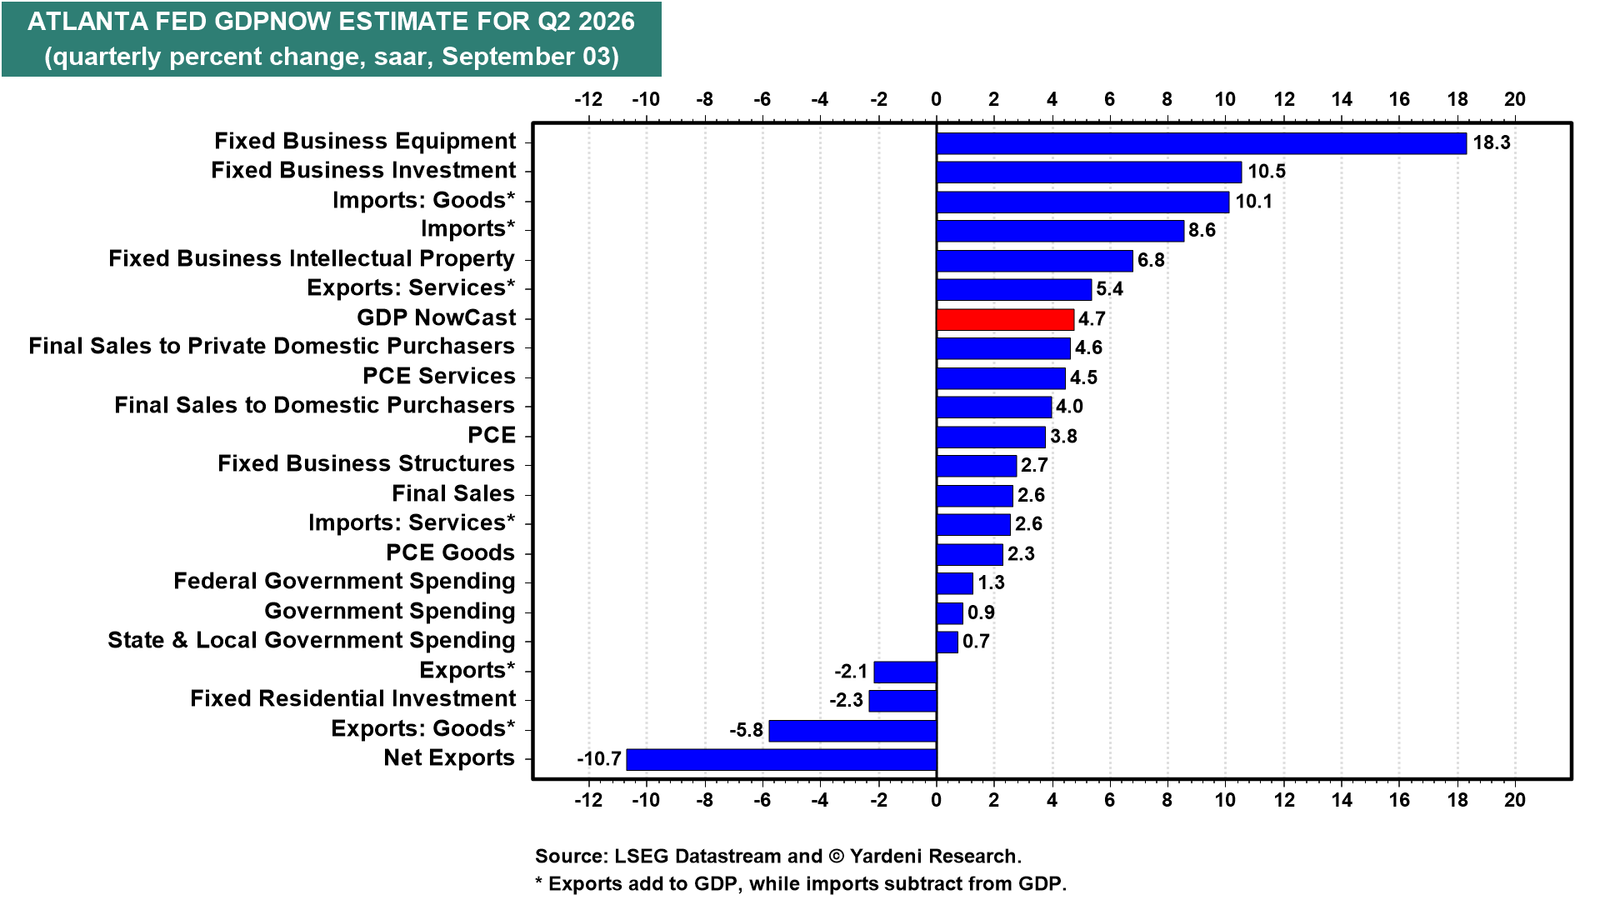
Earnings are strong because the economy is booming. The Atlanta Fed's GDPNow model is projecting real GDP growth of 4.7% (saar) in Q3 (chart). Consumer spending is expected to rise 3.8%, while AI-driven business investment remains strong, with equipment spending projected to increase 18.3% and intellectual property investment 6.8%. Final sales to private domestic purchasers are running at 4.6%.
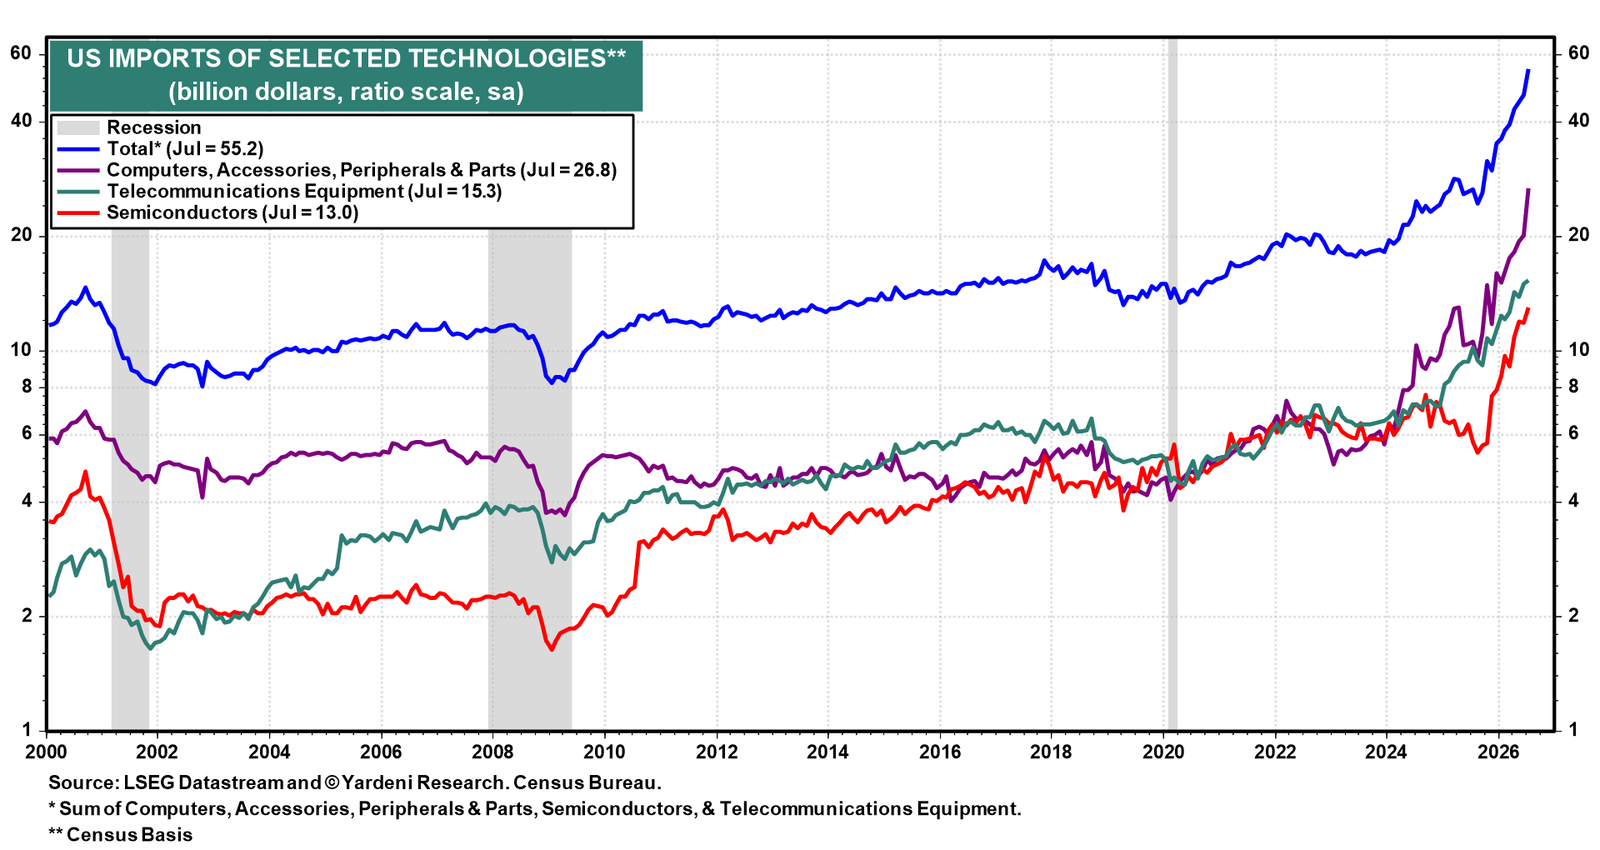
That's impressive, given that the trade deficit has widened as US imports of computer hardware, components, and accessories soar amid the AI building boom (chart).
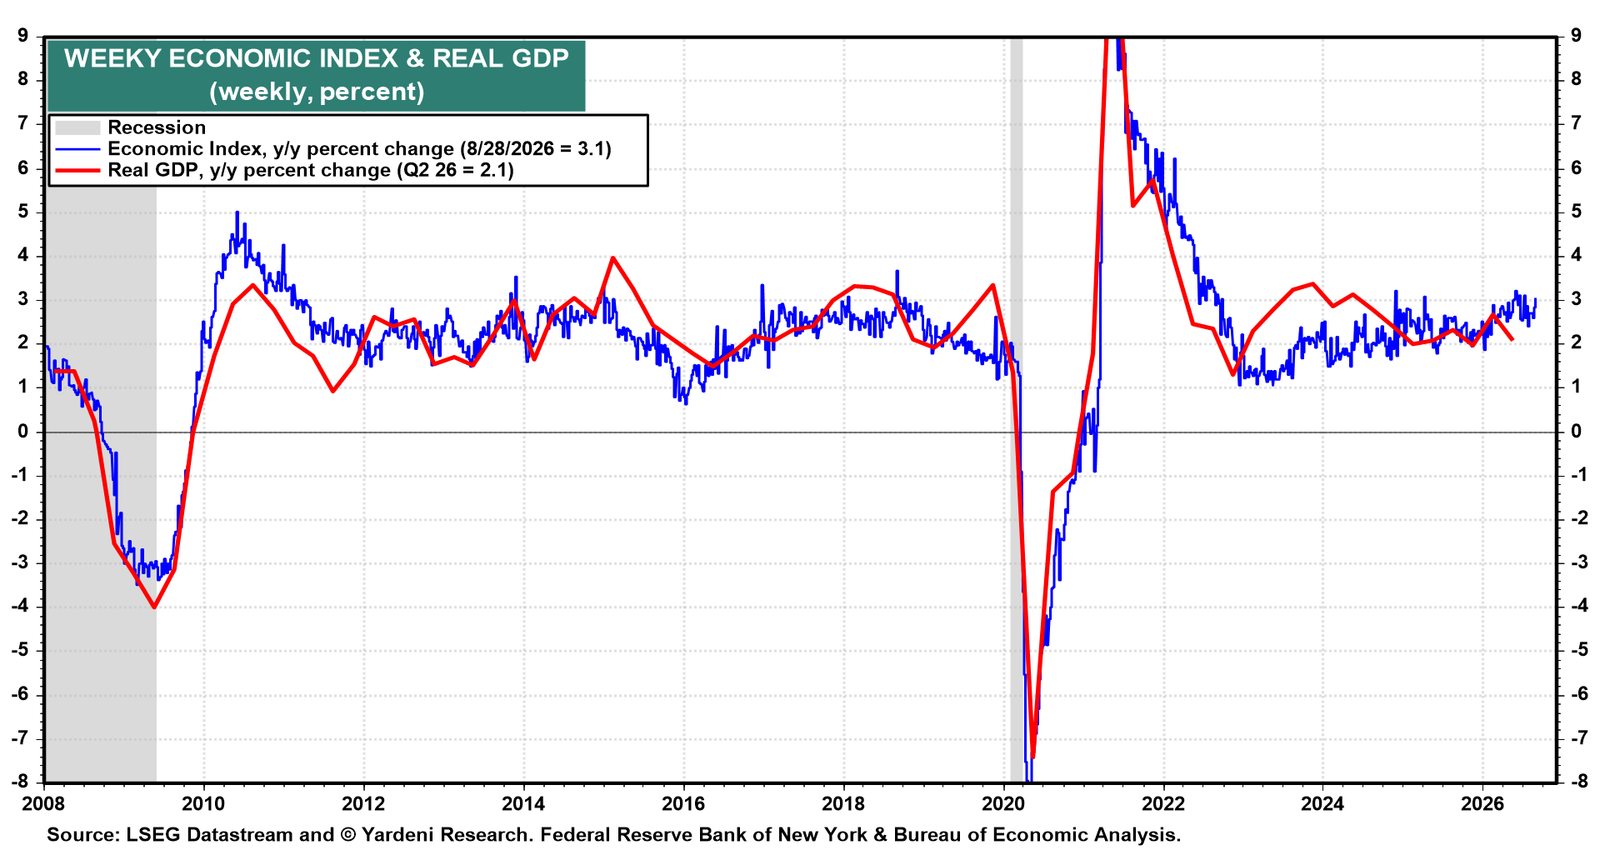
The Weekly Economic Index (WEI) rose to 3.1% in the week of August 28, its highest reading since early July (chart). The index combines 10 measures of consumer activity, labor markets, and production. It is scaled to real GDP growth and reinforces the Atlanta Fed's strong readings.
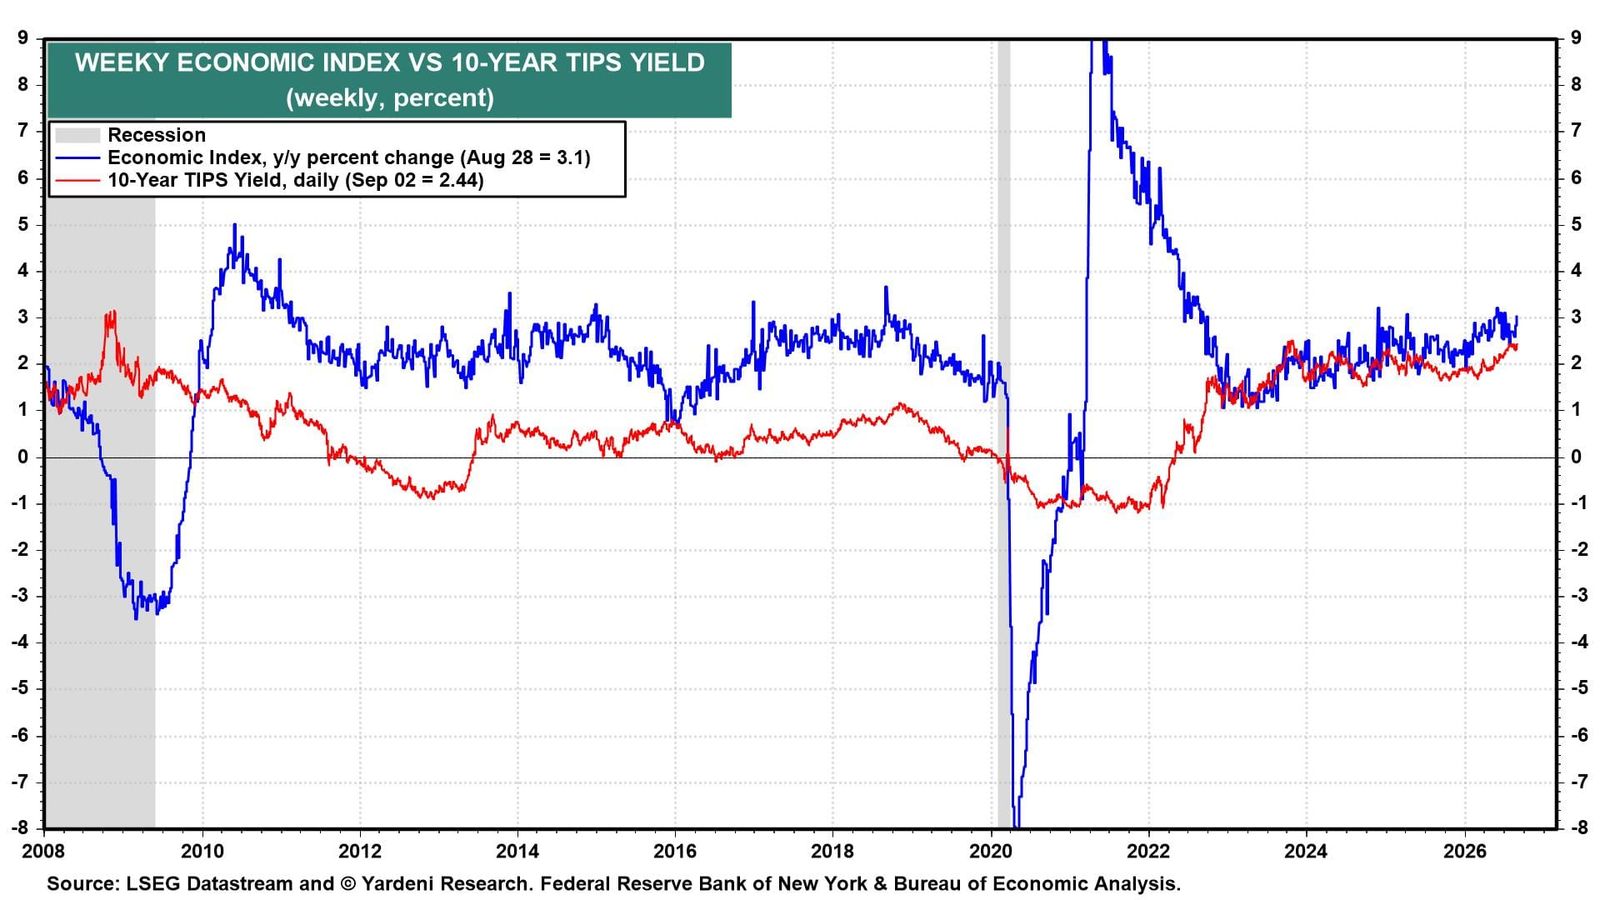
The recent increase in the 10-year TIPS yield has closely tracked the Weekly Economic Index, suggesting that higher Treasury yields reflect stronger economic fundamentals, not bond vigilantism (chart).
III. NM-PMI
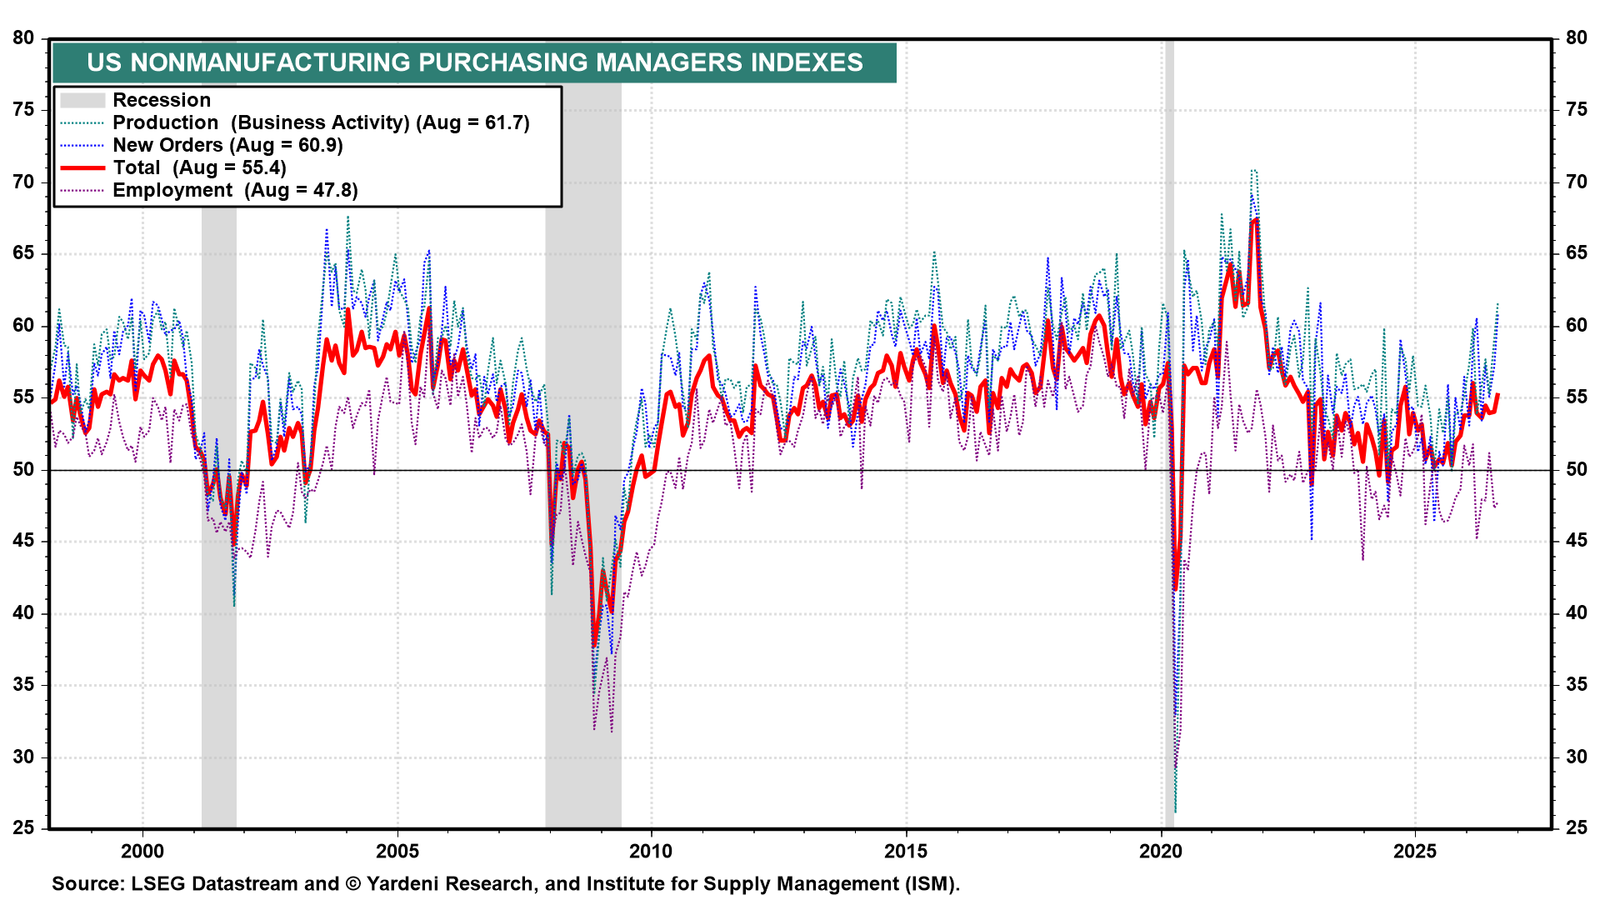
The service sector continues to expand at a solid pace. The ISM NM-PMI rose 1.3 points to 55.4 in August, its highest reading since February (chart). All major components except employment remain in expansion territory, i.e., greater than 50.0.
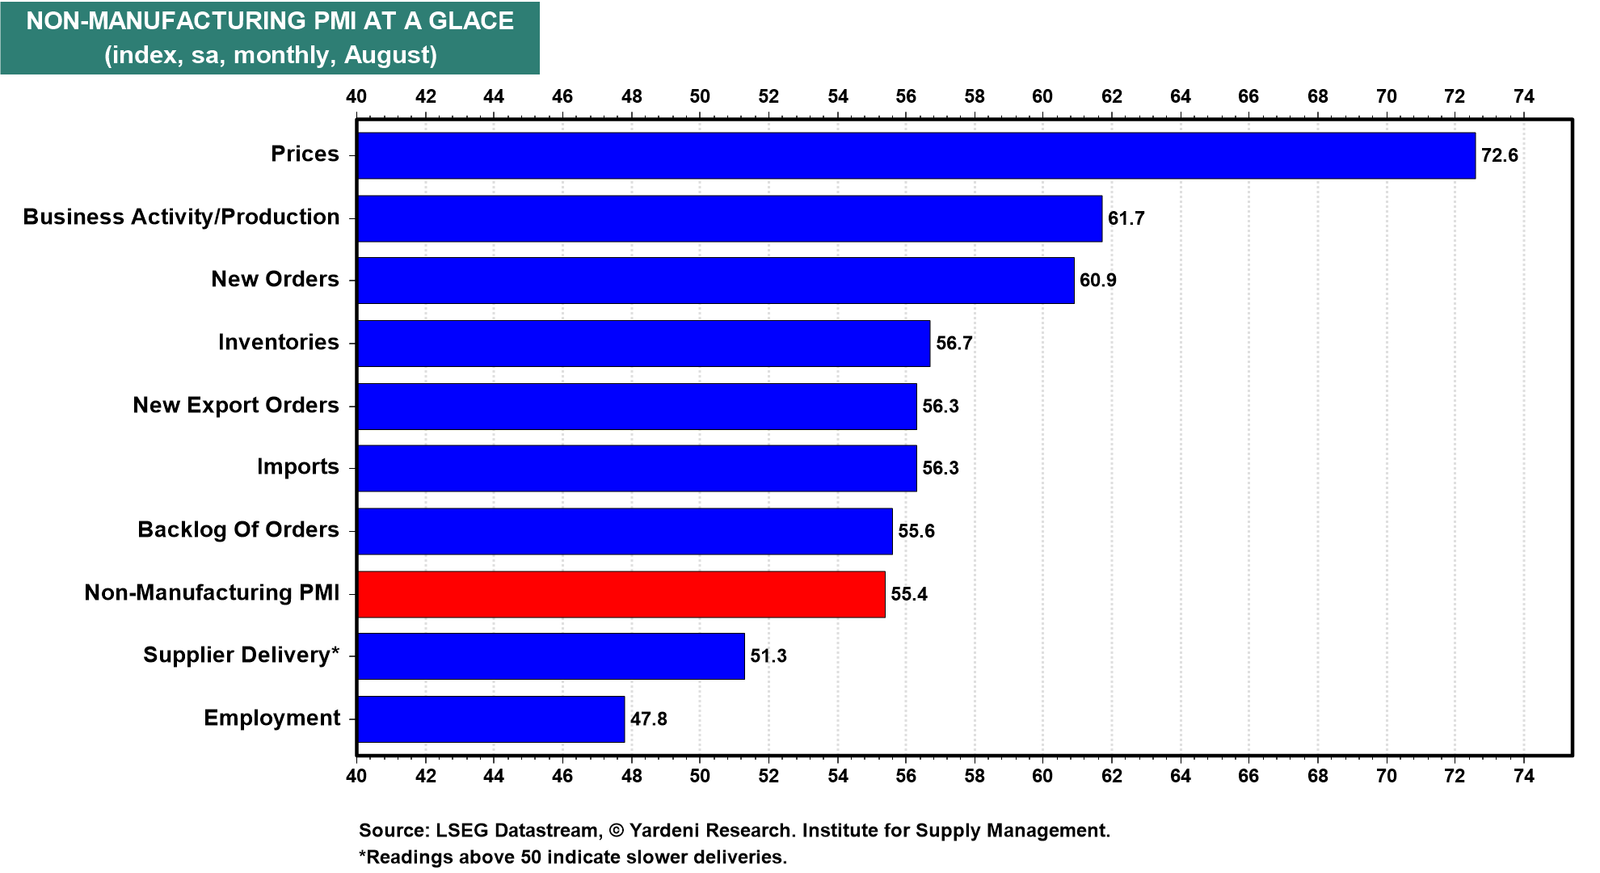
New orders growth accelerated to the fastest pace since early 2023, while a measure of business activity was the strongest since 2022 (chart).
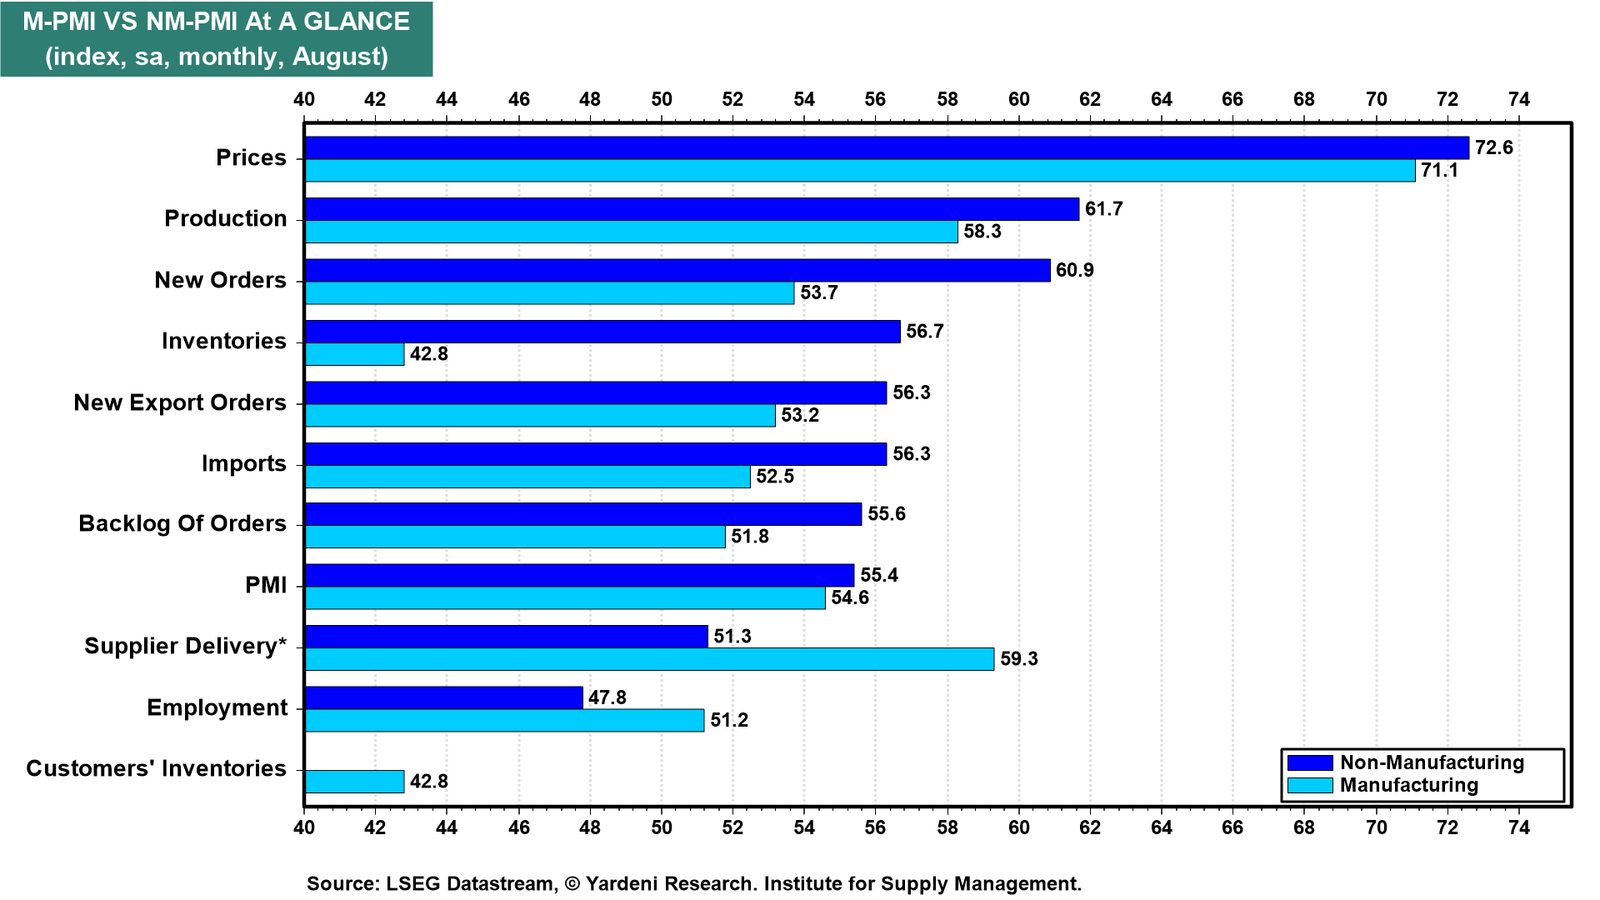
The August ISM PMI surveys suggest both manufacturing and services remain in good shape. Services continued to lead, with stronger business activity and new orders, while manufacturing stayed firmly in expansion territory with a PMI of 54.6 (chart). Prices paid remained elevated in both sectors, while growing backlogs and export orders suggest economic growth remains broad-based.
IV. Inflation
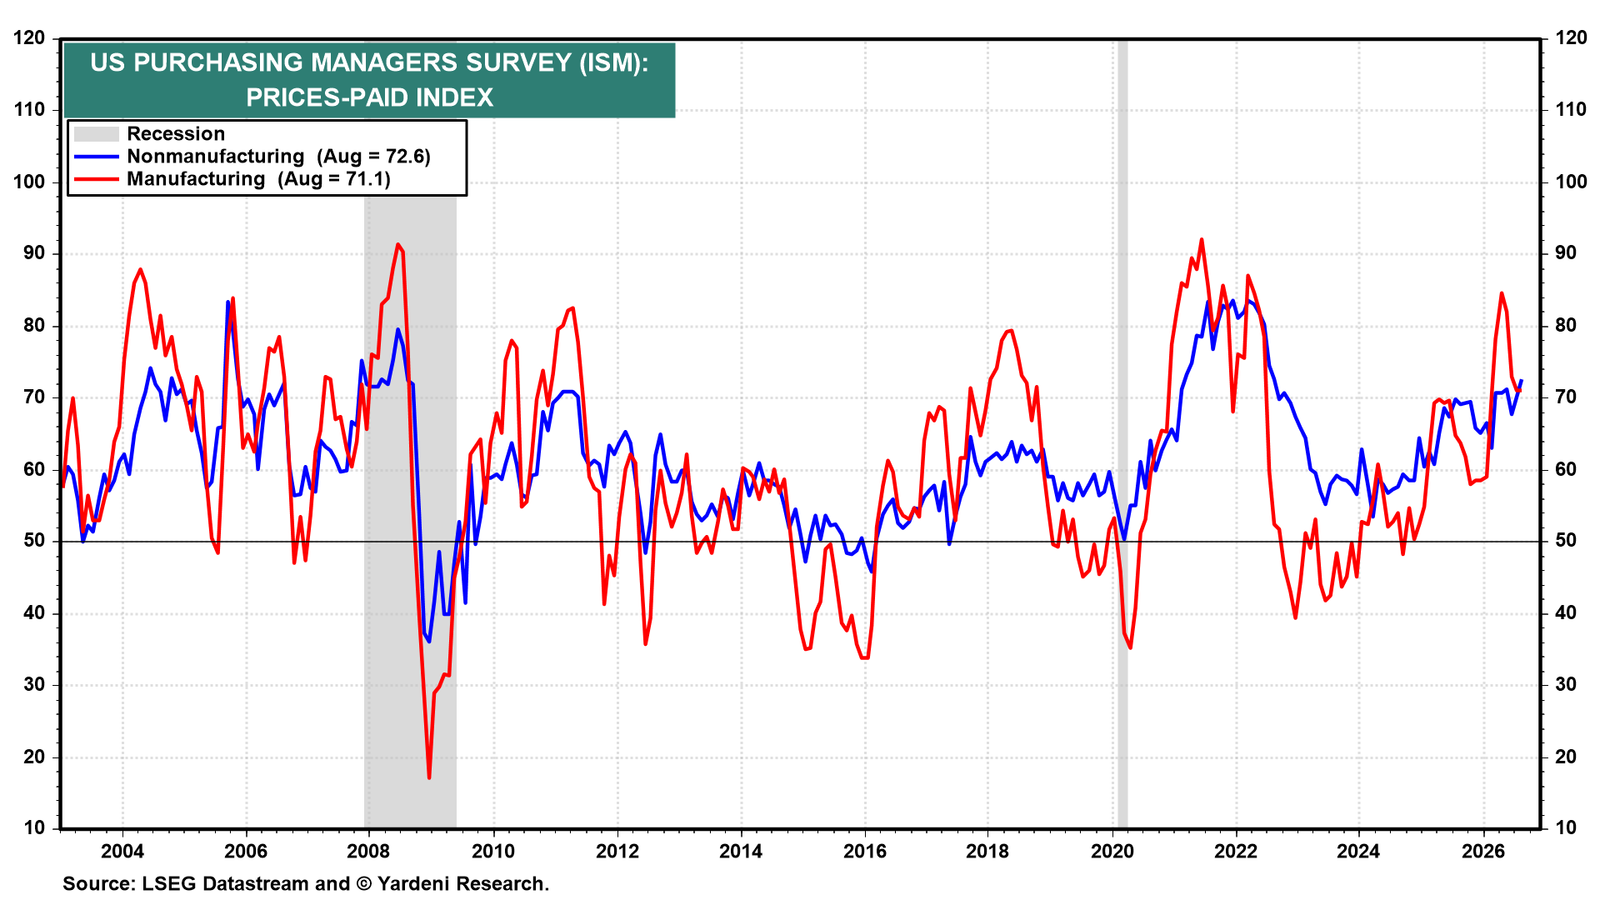
Meanwhile, inflation remains an issue. Prices-paid indexes stayed elevated in August, with the services measure jumping to 72.6, its highest reading since August 2022 (chart).
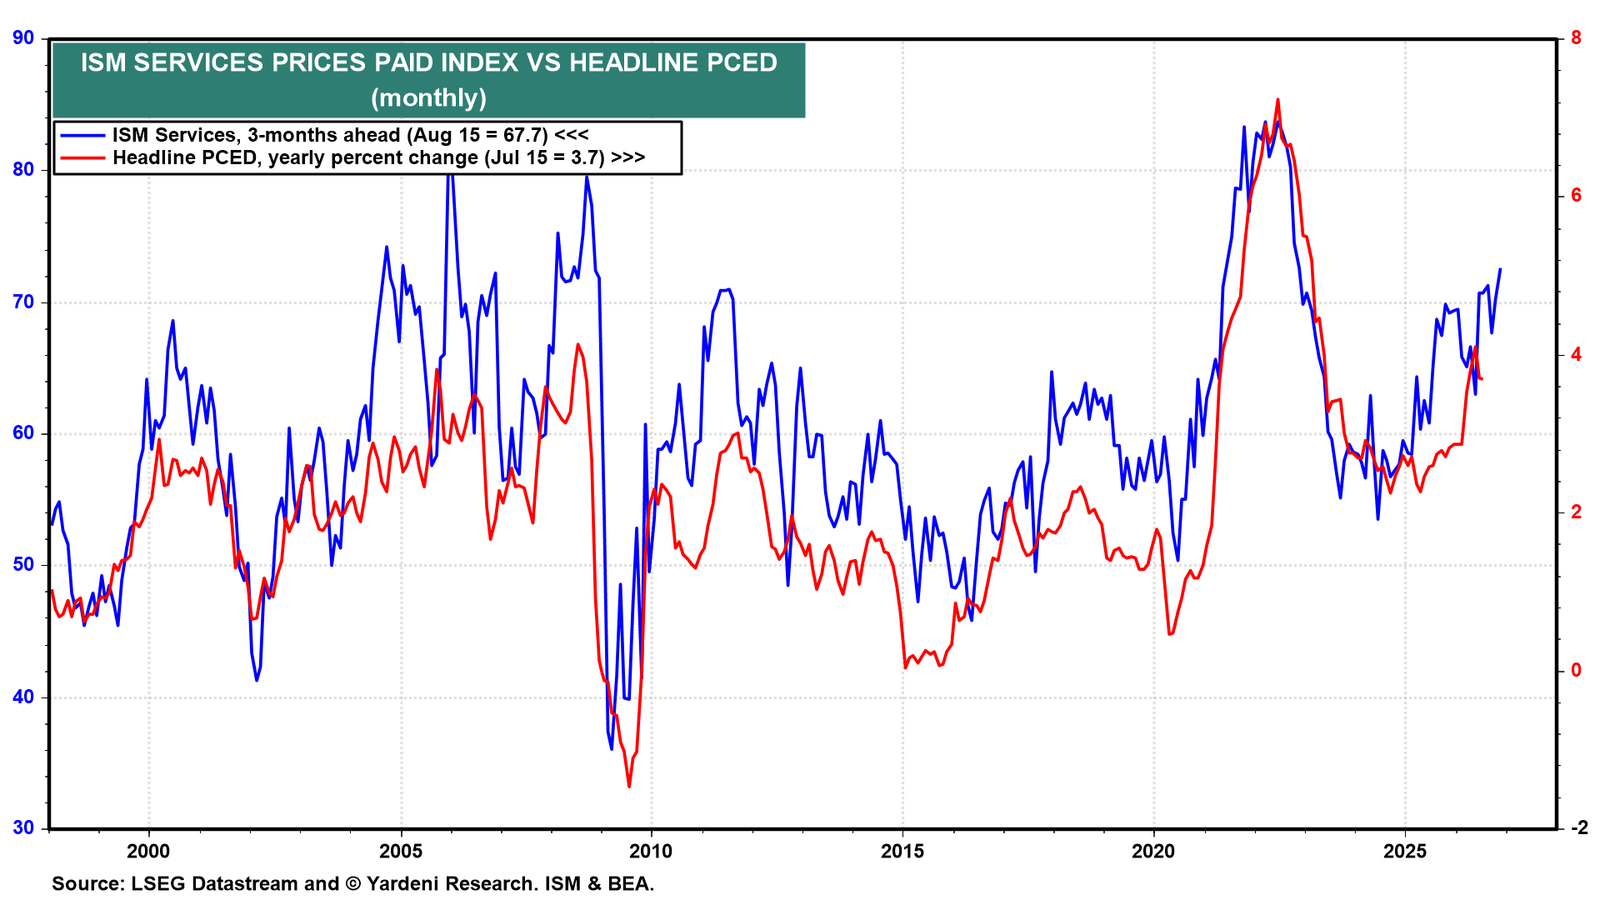
The jump in the services prices-paid index should warn the Fed, as the index has historically led headline PCED inflation (including goods and services) by about three months (chart).
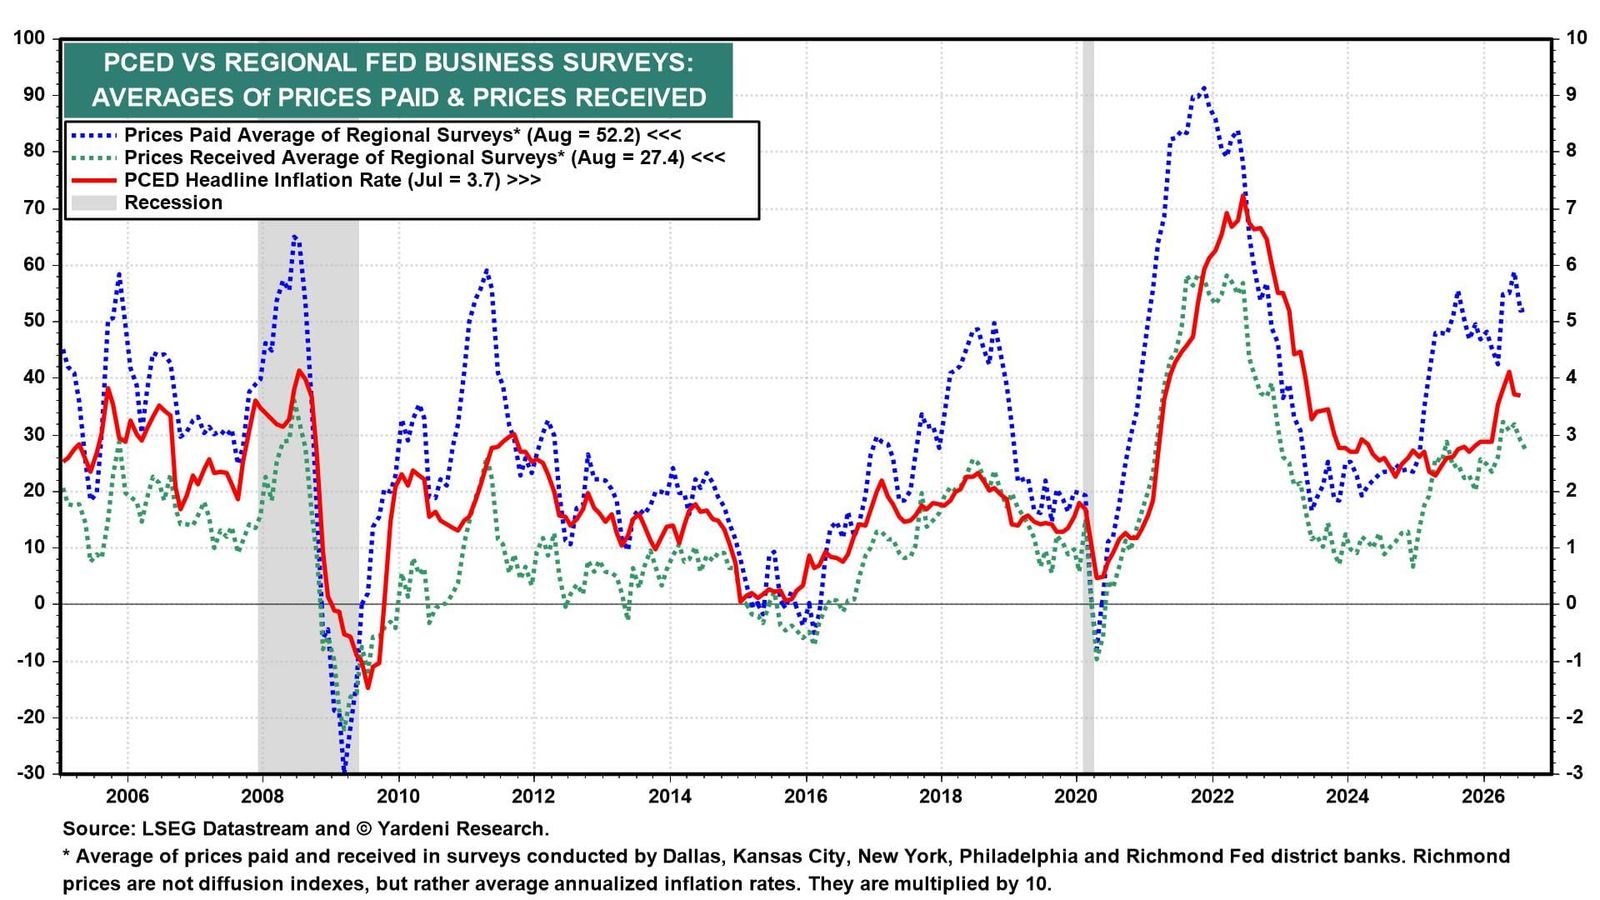
Furthermore, the prices-paid and prices-received averages from the regional Fed surveys have eased from recent highs but remain well above levels consistent with the Fed's 2% inflation target (chart). Historically, both have tracked core PCED inflation closely.
V. Labor Market
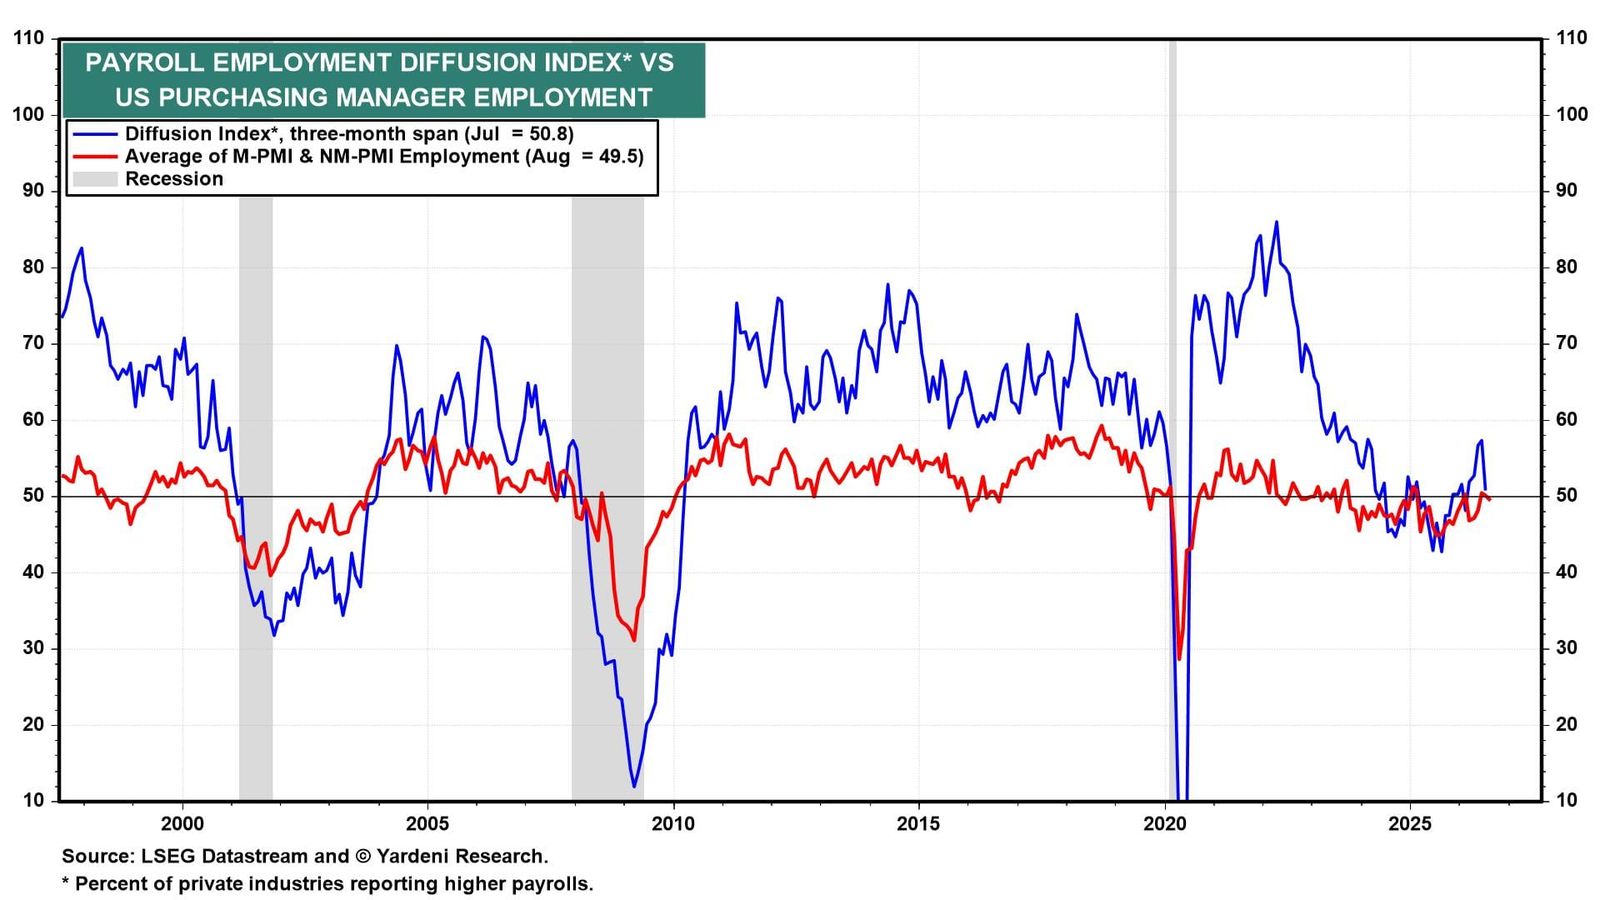
The labor market data continue to confirm our view that the labor market remains well balanced at full employment, giving the Fed room to focus primarily on the inflation side of its dual mandate. The average of the ISM manufacturing and services employment indexes is lackluster because companies are boosting their productivity to offset labor shortages (chart).
Additionally, layoffs remain remarkably subdued. Announced job cuts during the first eight months of 2026 were the lowest in four years, according to Challenger, Gray & Christmas (chart).
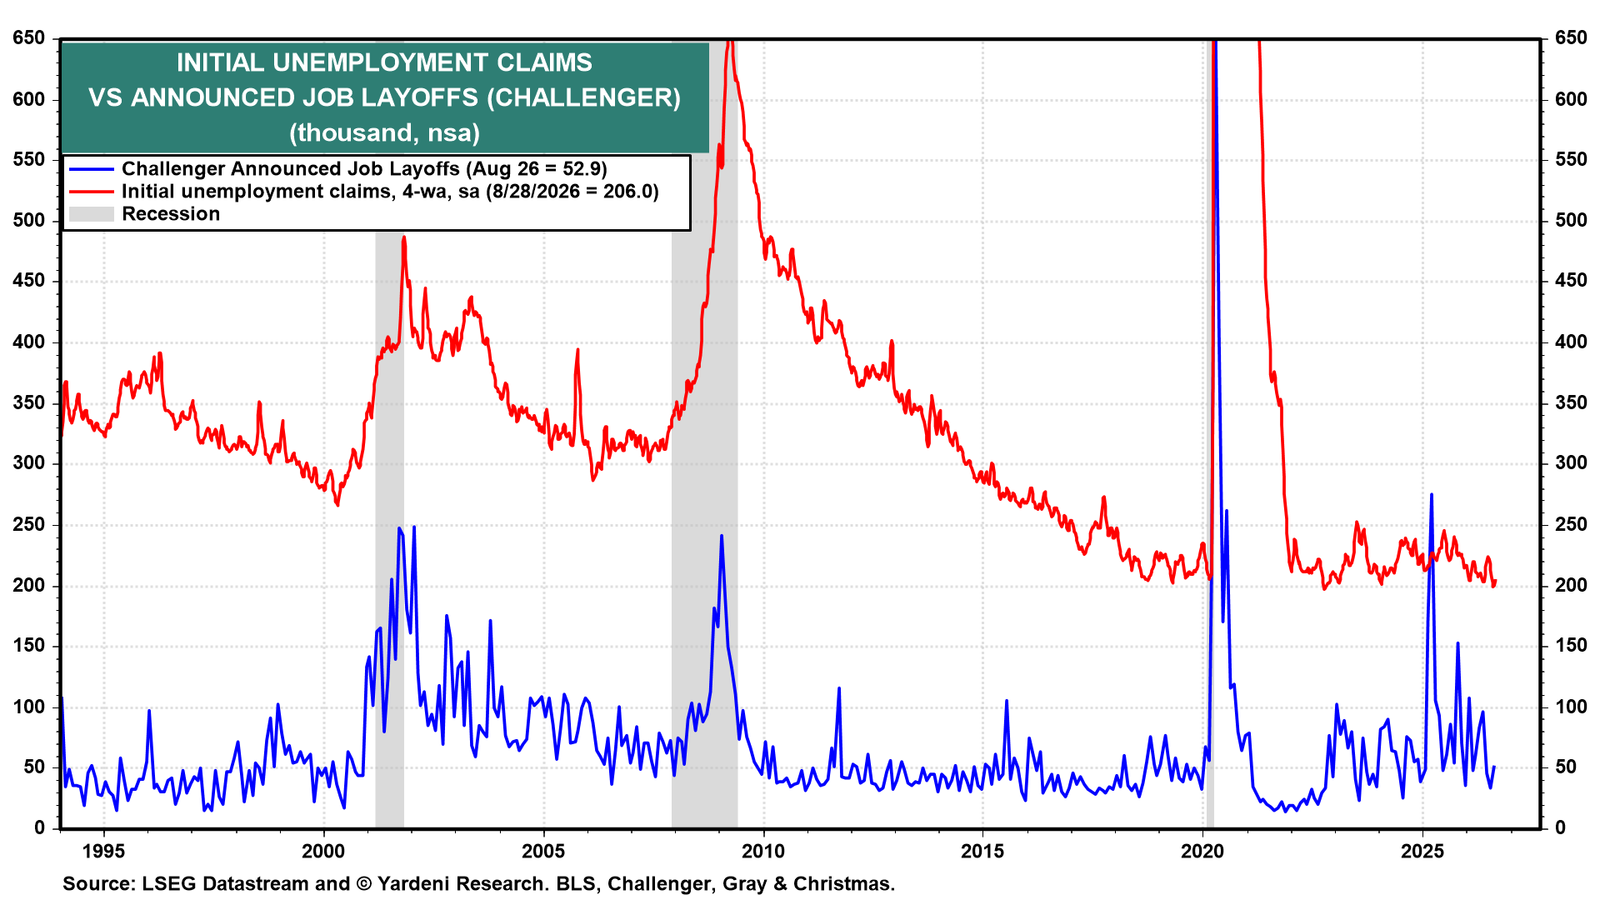
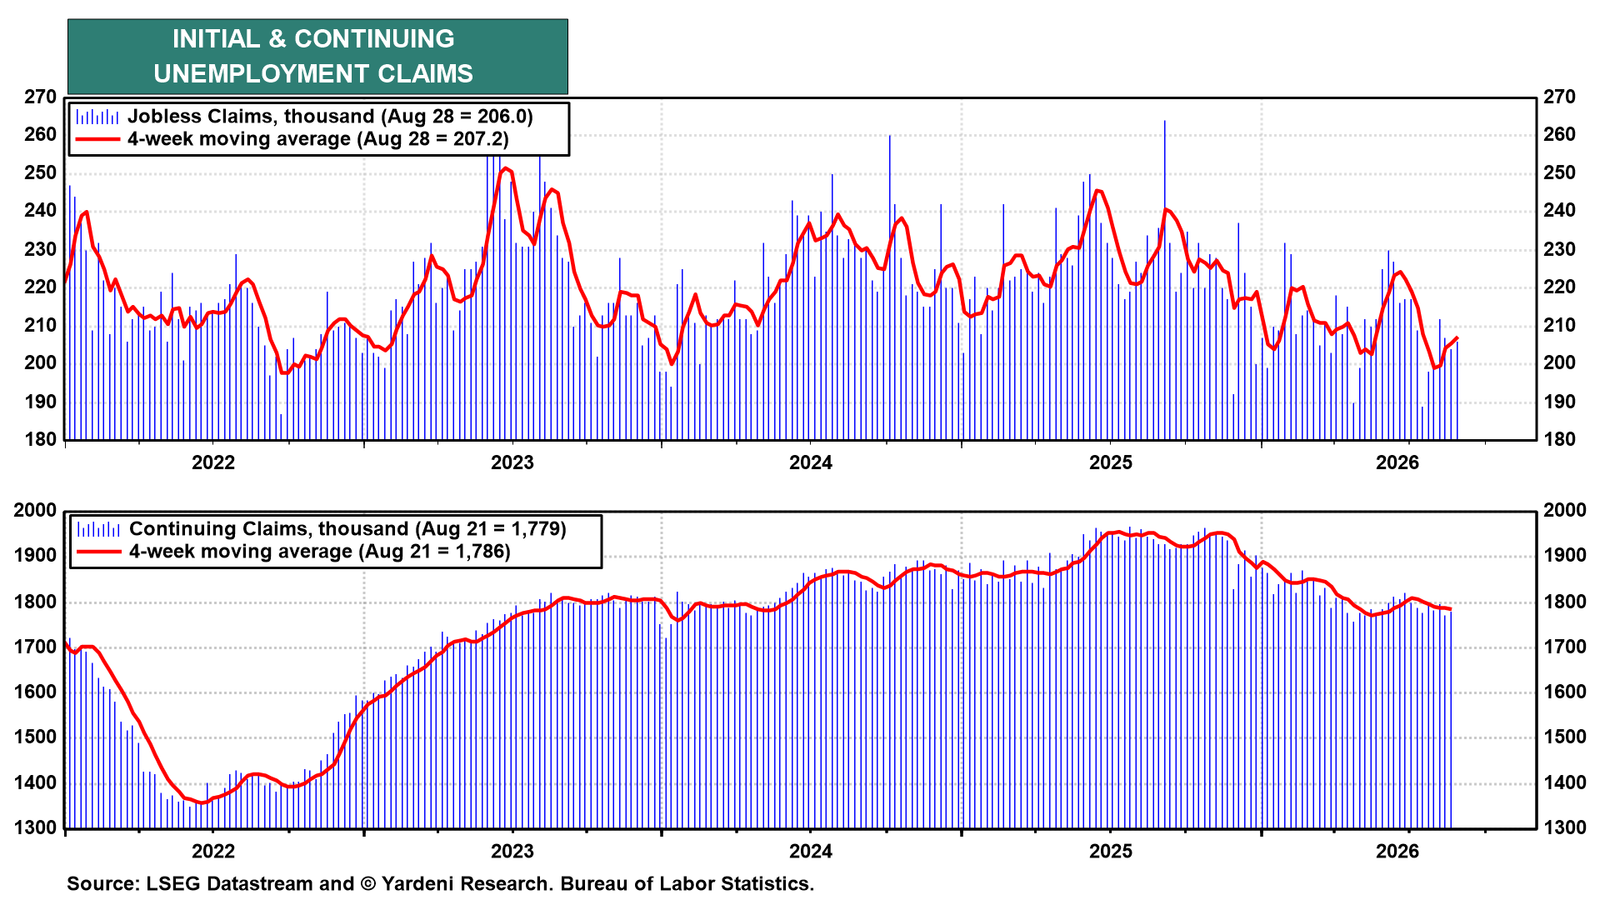
Initial claims tell the same story, remaining historically low at 206,000 in the week of August 28 (chart). Meanwhile, continuing claims have resumed their recent downward trend.