I. Stocks
Stop the music! S&P 500 earnings per share (EPS) have been significantly distorted by huge capital gains on investments by Alphabet and Amazon and a tax-related gain from Meta. Because GAAP accounting rules force companies to record unrealized equity gains and losses directly on the income statement, a small group of tech and venture-heavy mega-caps can create significant noise in the S&P 500's aggregate earnings growth numbers, masking the underlying operating trends of the broader market.
We asked our colleague, Joe Abbott, to have a closer look. He reports: "S&P 500 Q1-2026 EPS was finalized at $75.03 (chart). It was boosted by a total of $5.22 per share in mark-to-market (MTM) investment and tax gains recognized by three companies reporting on a GAAP accounting basis: $3.14 in MTM gains for Alphabet, $1.42 in MTM gains for Amazon, and a $0.66 tax reversal gain for Meta.
"For Q2-2026, the S&P 500’s earnings per share of $90.55 (so far in the earnings reporting season) was boosted by Alphabet’s astonishing MTM gain, particularly on SpaceX. It added $8.96 to the S&P 500’s EPS."
While GAAP reporting is mandatory, over 95% of S&P 500 companies also present non-GAAP (or "adjusted") metrics in their earnings releases, investor presentations, and conference calls.
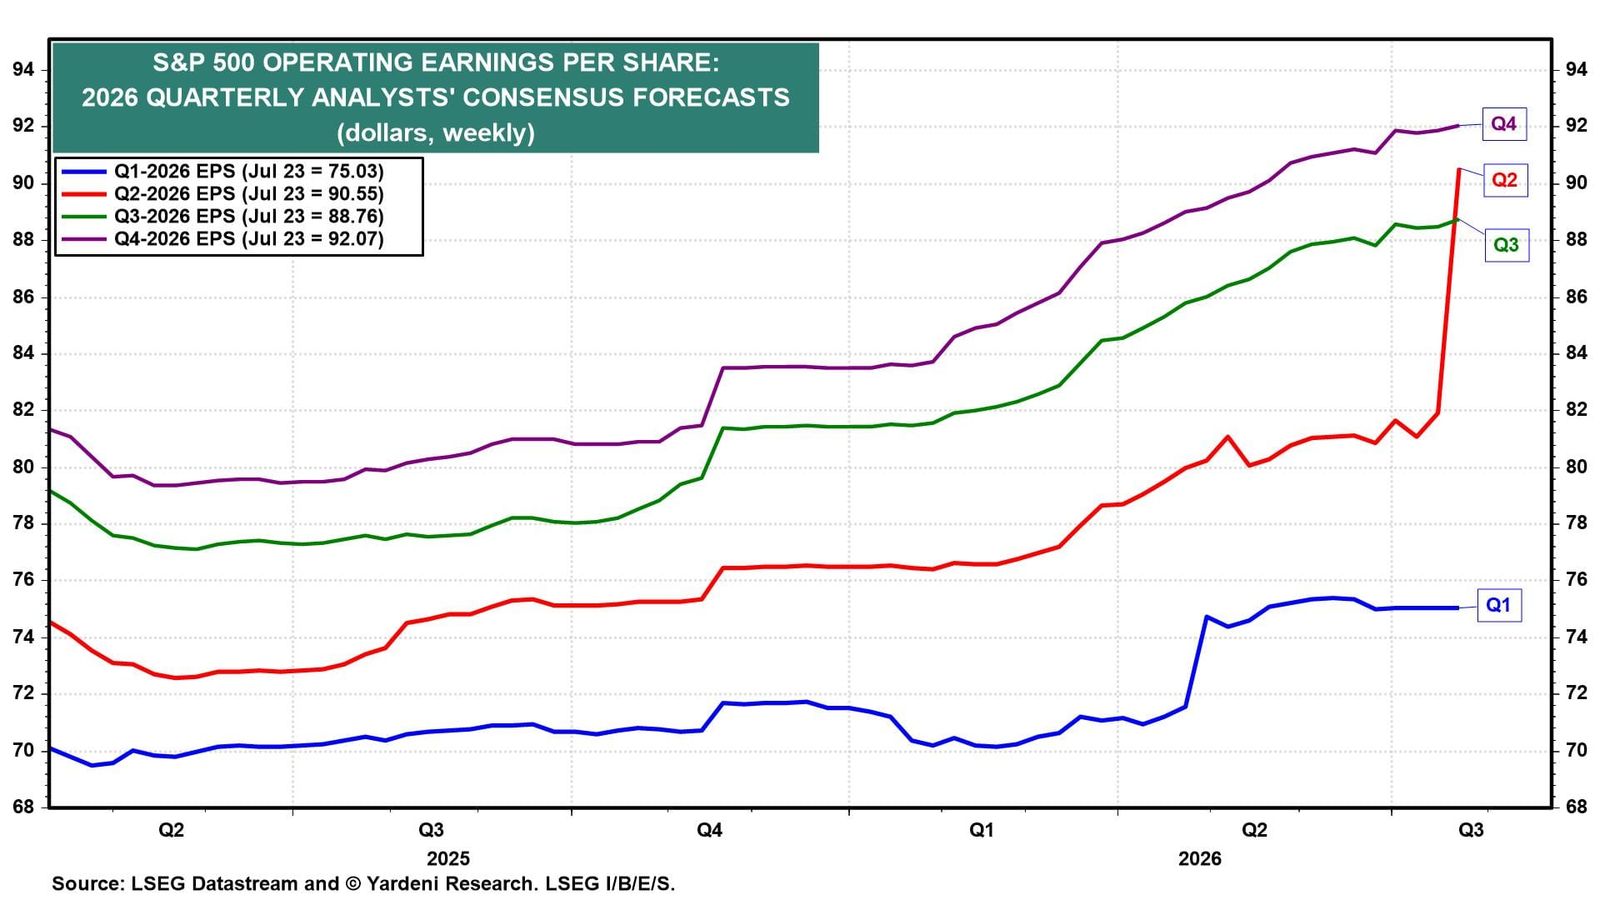
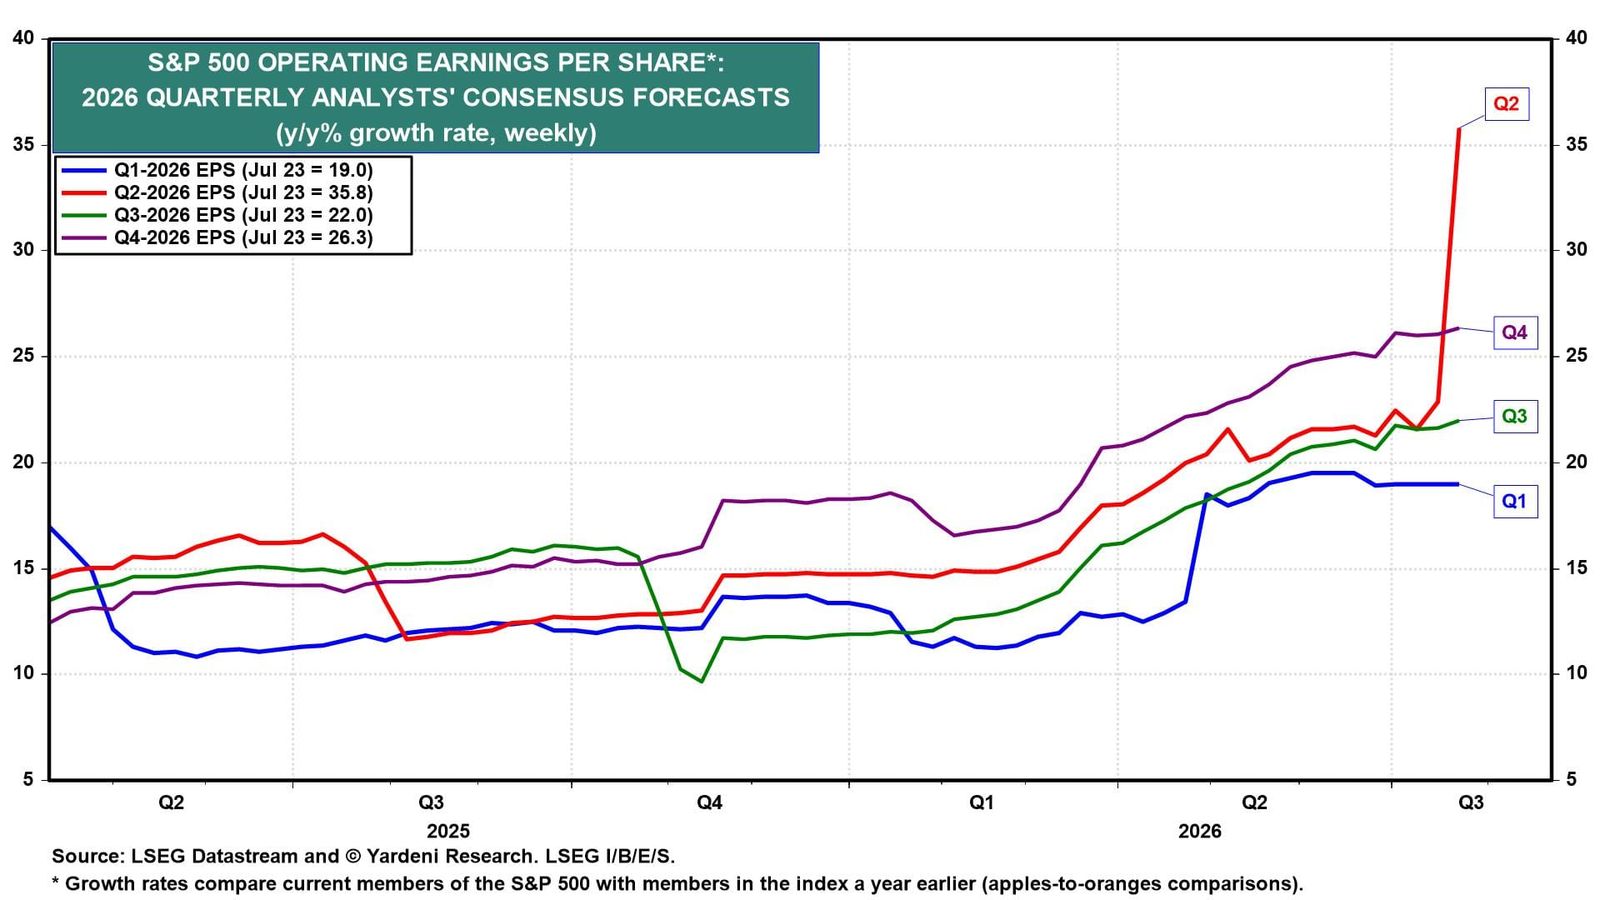
Removing the MTM gains reduces the S&P 500's Q1 and Q2 y/y earnings growth rates from 19.0% and 35.8% to 10.6% and 22.3% (chart). Those are still very solid growth rates.
Here's more:
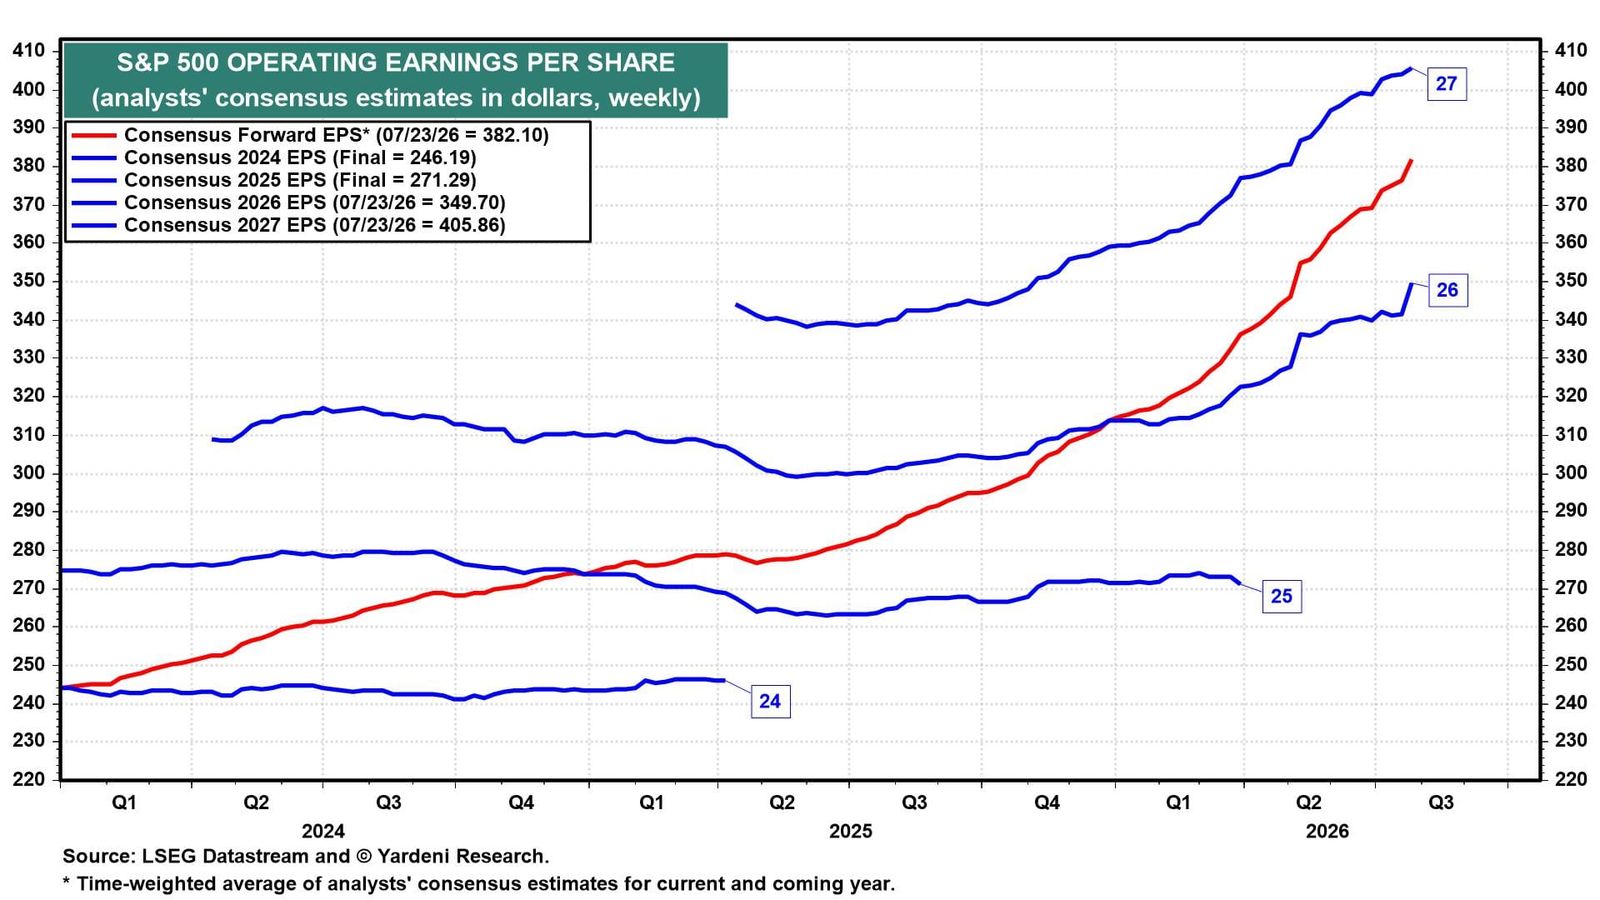
(1) Earnings. Analysts’ consensus expectations for the S&P 500 companies’ aggregate EPS for 2026 was boosted by Q2's MTM gain by Alphabet, as reported last week (chart). MTM effects had no impact on analysts' consensus expectations for 2027 EPS, which rose to another record high last week, of $405.86. That’s 16.1% above the blended (actual and estimated) 2026 MTM-inflated EPS, which is up 28.9% above 2025 EPS. Excluding the Q1 and Q2 MTM boosts, the projected 2026 EPS growth rate falls to a still hefty 23.6%.
The S&P 500 forward EPS has been boosted by the 2026 MTM effect. However, what matters is that forward EPS will continue to converge to the 2027 consensus estimate, which is still rising and is 6.2% above the current forward EPS.
So even removing the MTM gains, Fabulous Earnings Momentum (FEMO) remains intact! We will continue to monitor the course of the 2027 estimate as the best way to track FEMO. Stay tuned.
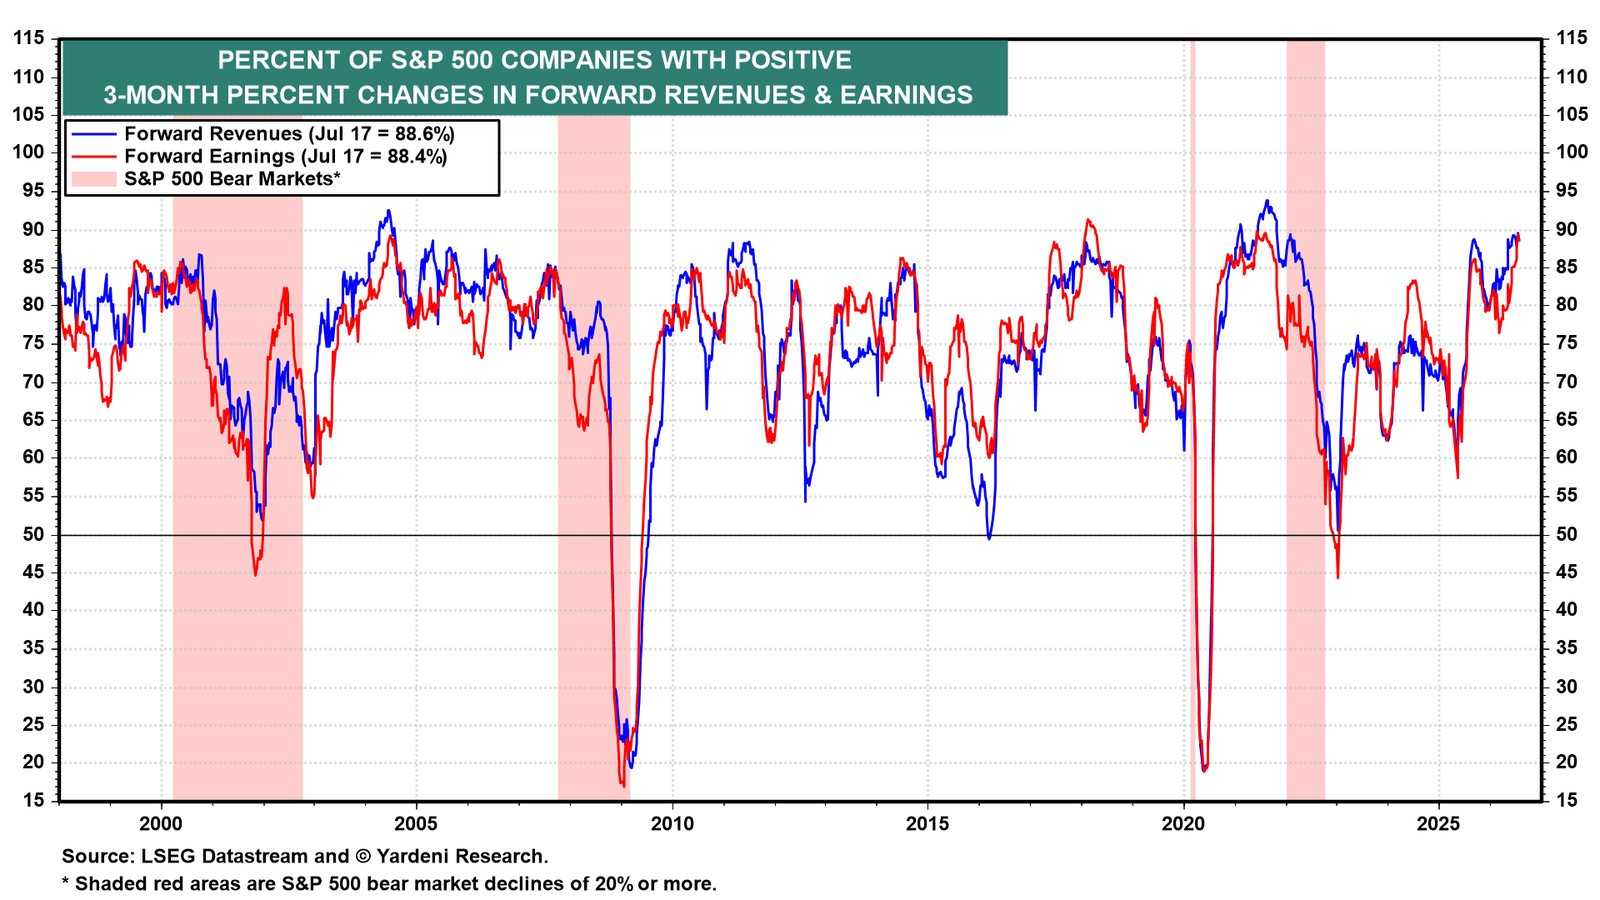
FEMO also lives on according to our diffusion measures of the percent of S&P 500 companies with positive 3-month percent changes in forward revenues and earnings (chart). Both are near previous cyclical peaks, which can last for a while.
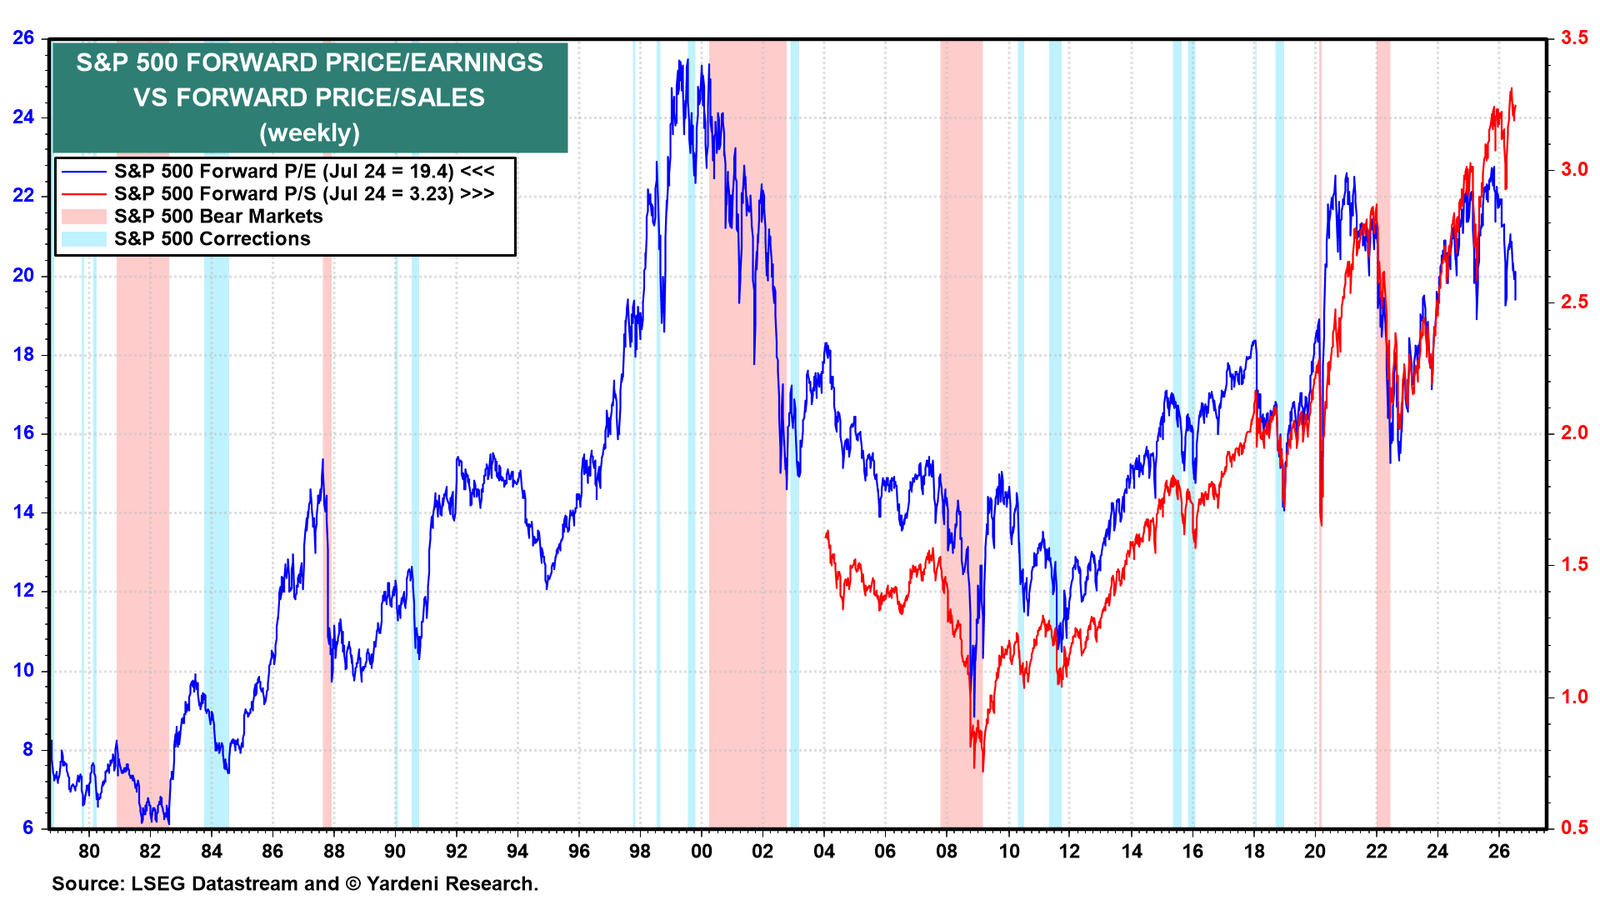
(2) Valuation. The MTM boost to forward EPS is misleadingly reducing the forward P/E of the S&P 500, which is currently down to 19.4 from 21.0 at the start of the year (chart). Currently, the forward P/S, which is not affected by MTM, remains near its record high at 3.23. (This weekly forward price/sales ratio is analogous to the quarterly Buffett Ratio but measured more frequently; the Buffet Ratio is S&P 500 market capitalization divided by nominal GDP.)
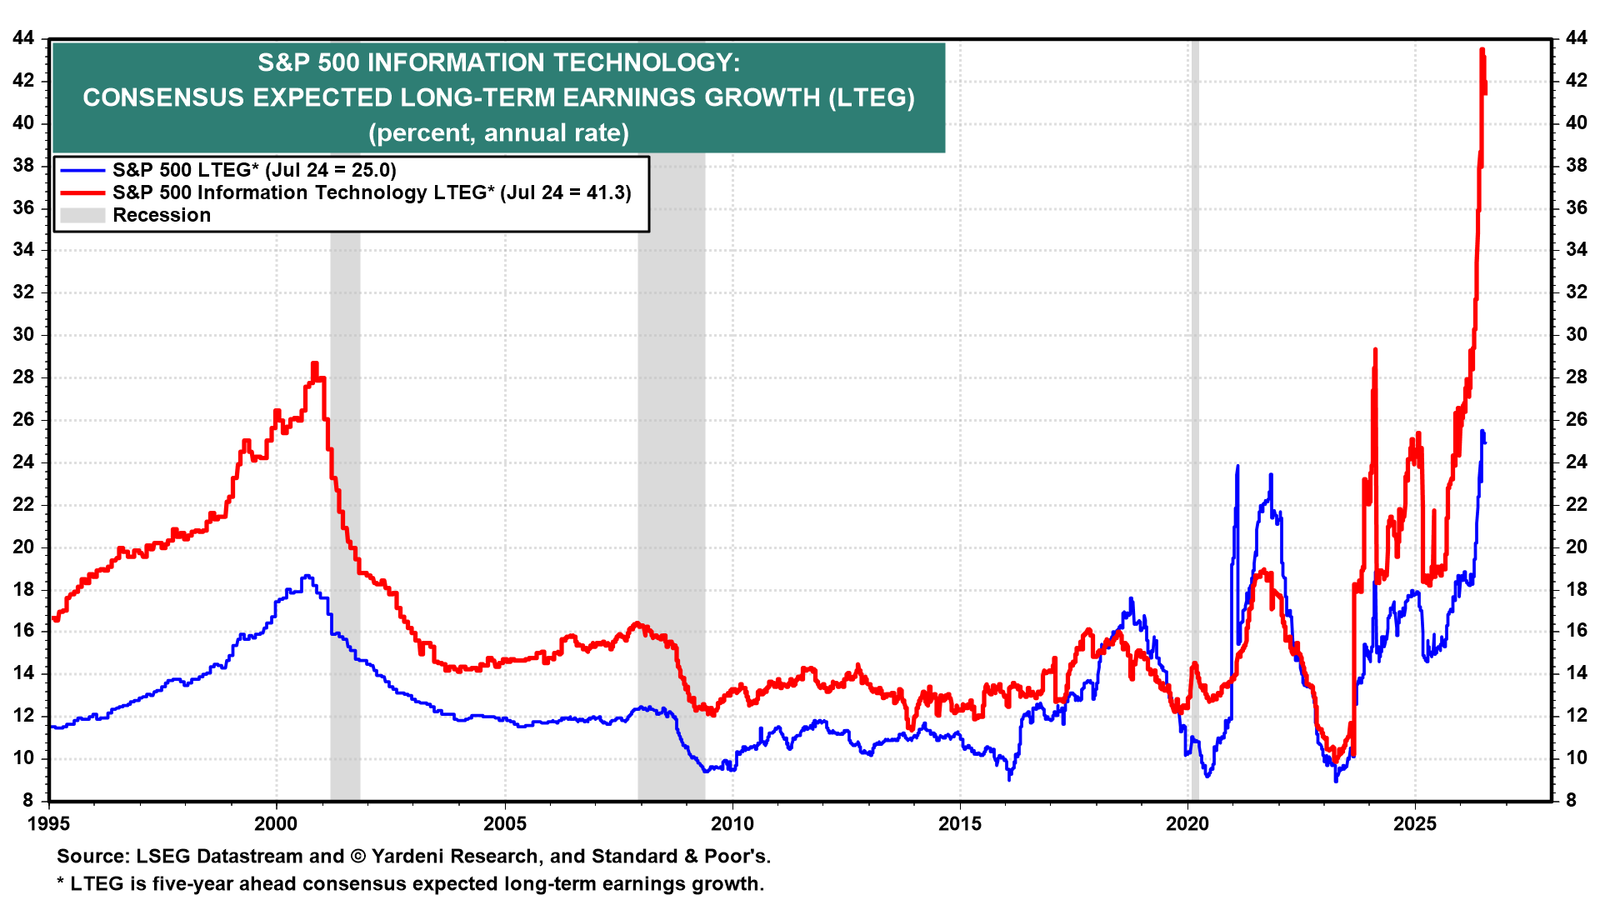
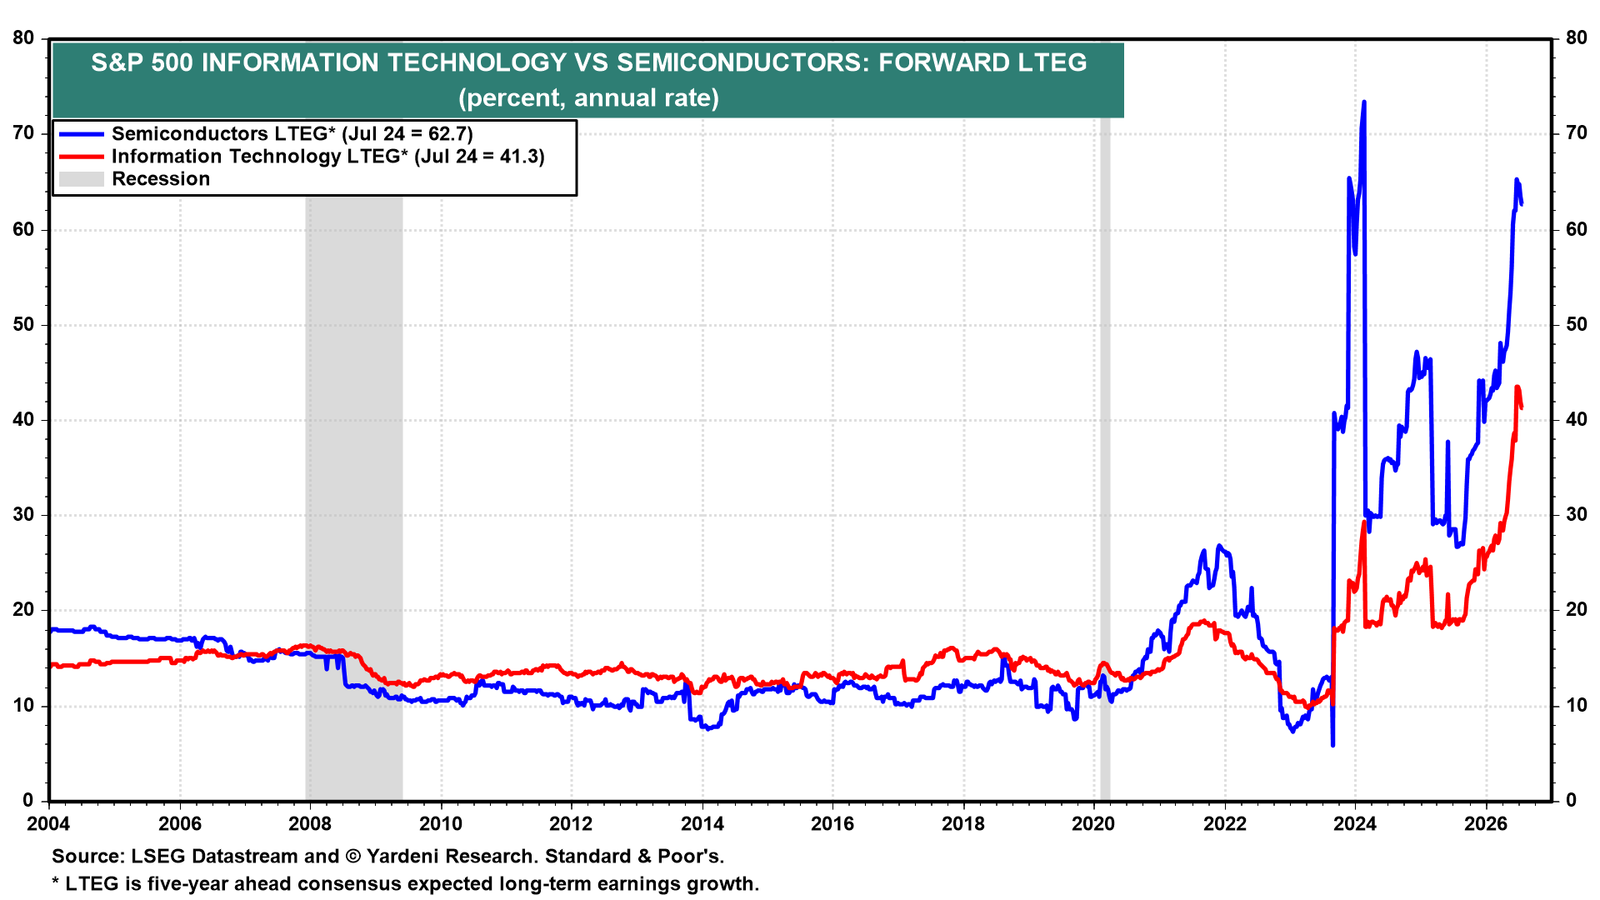
We don't believe that the MTM gains discussed above are impacting analysts' consensus EPS expectations for 2027, which will be getting a larger weight in the calculation of forward EPS as the current year progresses. Nevertheless, analysts are displaying symptoms of irrational exuberance in their long-term earnings growth (LTEG) projections, led by those covering S&P 500 Information Technology companies (chart). Currently, S&P 500 LTEG is 25.0%, with the Information Technology LTEG at 41.3%. That's nuts!
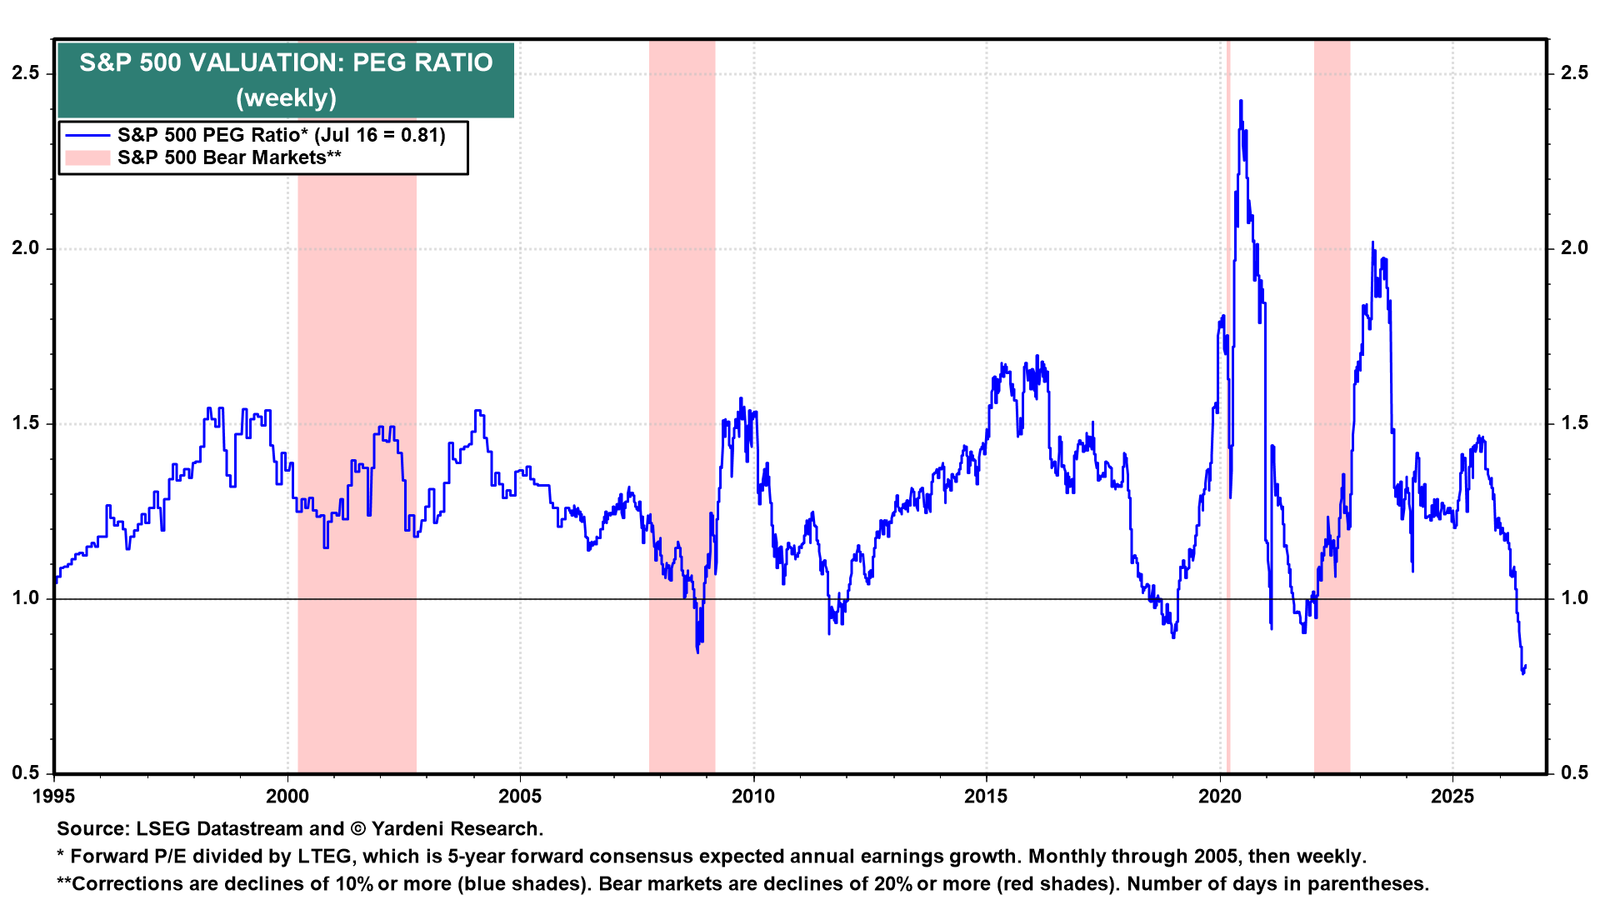
As a result, the S&P 500's PEG ratio is 0.81, an all-time low, suggesting that stocks are ridiculously cheap, which is ridiculous (chart).
(3) Semiconductor forward profit margin. Much of the irrational exuberance in the S&P 500's LTEG seems to reside in the Semiconductor industry, where the LTEG is 62.7% (chart).
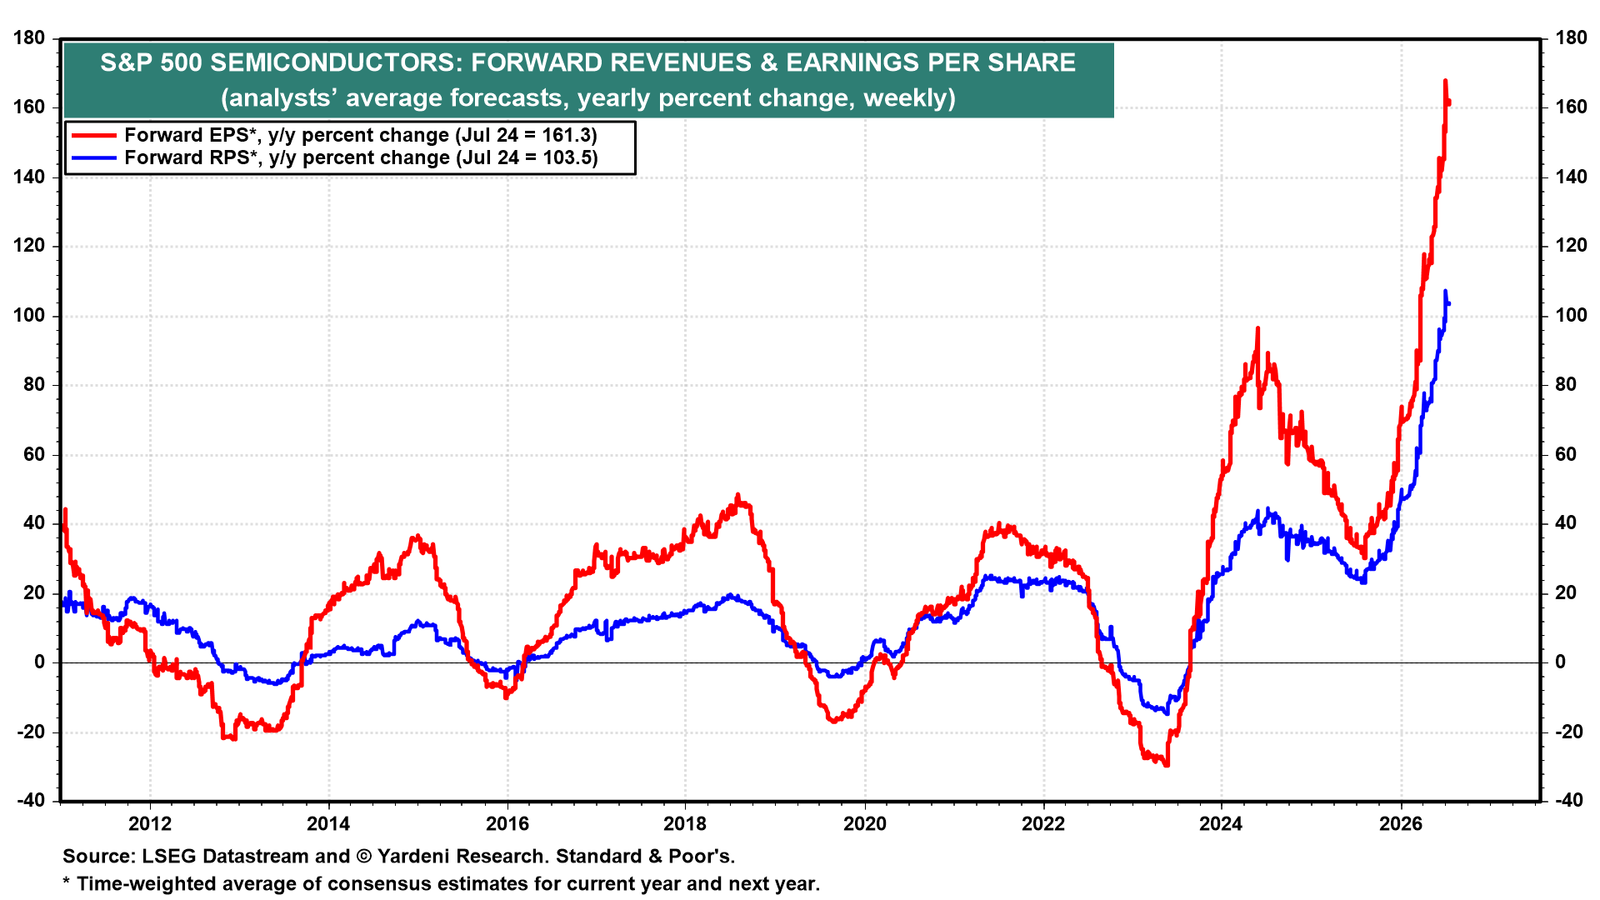
That LTEG doesn’t seem irrational given that the Semis' forward RPS and EPS are up 103.5% y/y and 161.3% through last week (chart). But most of that jump can be attributed to soaring chip prices, as production capacity hasn't kept up with demand. Capacity expansion eventually will reduce prices, presumably. Chips have always been a cyclical industry. Is it really different this time? Maybe.
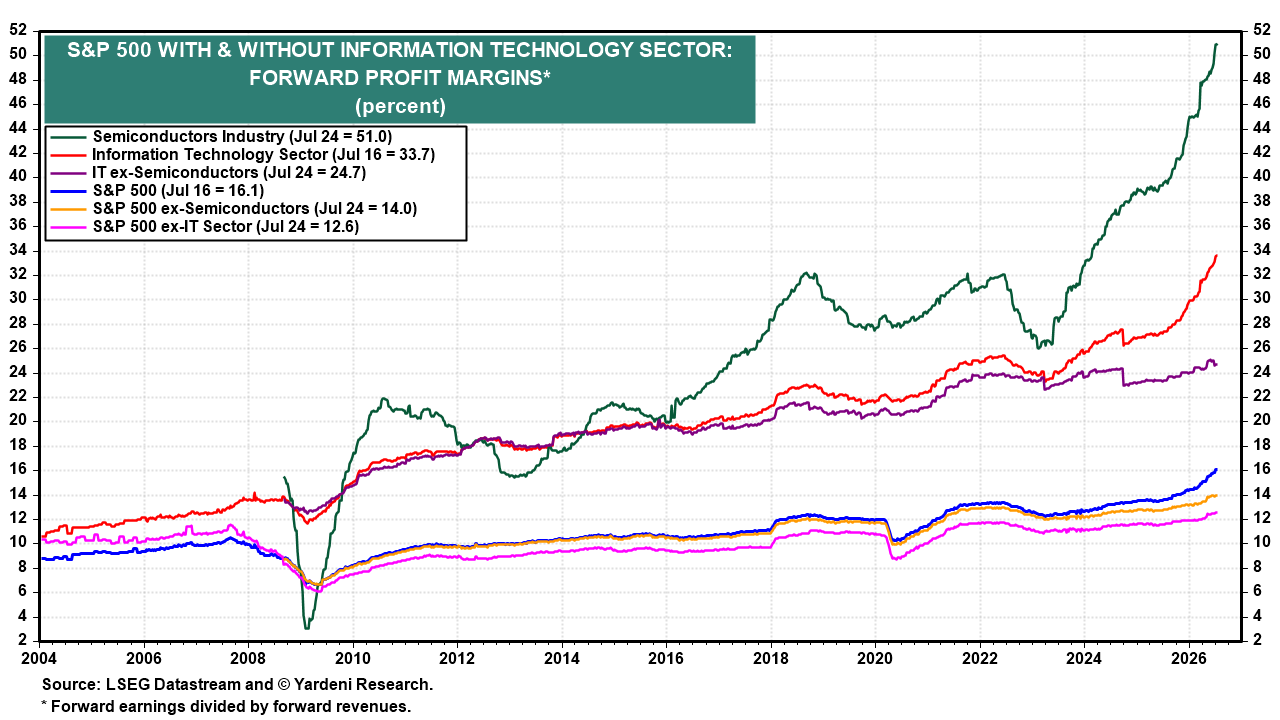
Semiconductor price increases, not productivity, have inflated the industry's forward profit margin to a record 51.0% (chart). They've also inflated the Information Technology sector's forward profit margin to 33.7%. Excluding Semiconductors, the Information Technology sector's forward profit margin is 24.7%. The S&P 500's forward profit margin is at 14.0% excluding the industry and 12.6% excluding the sector, according to Joe.
II. Bonds
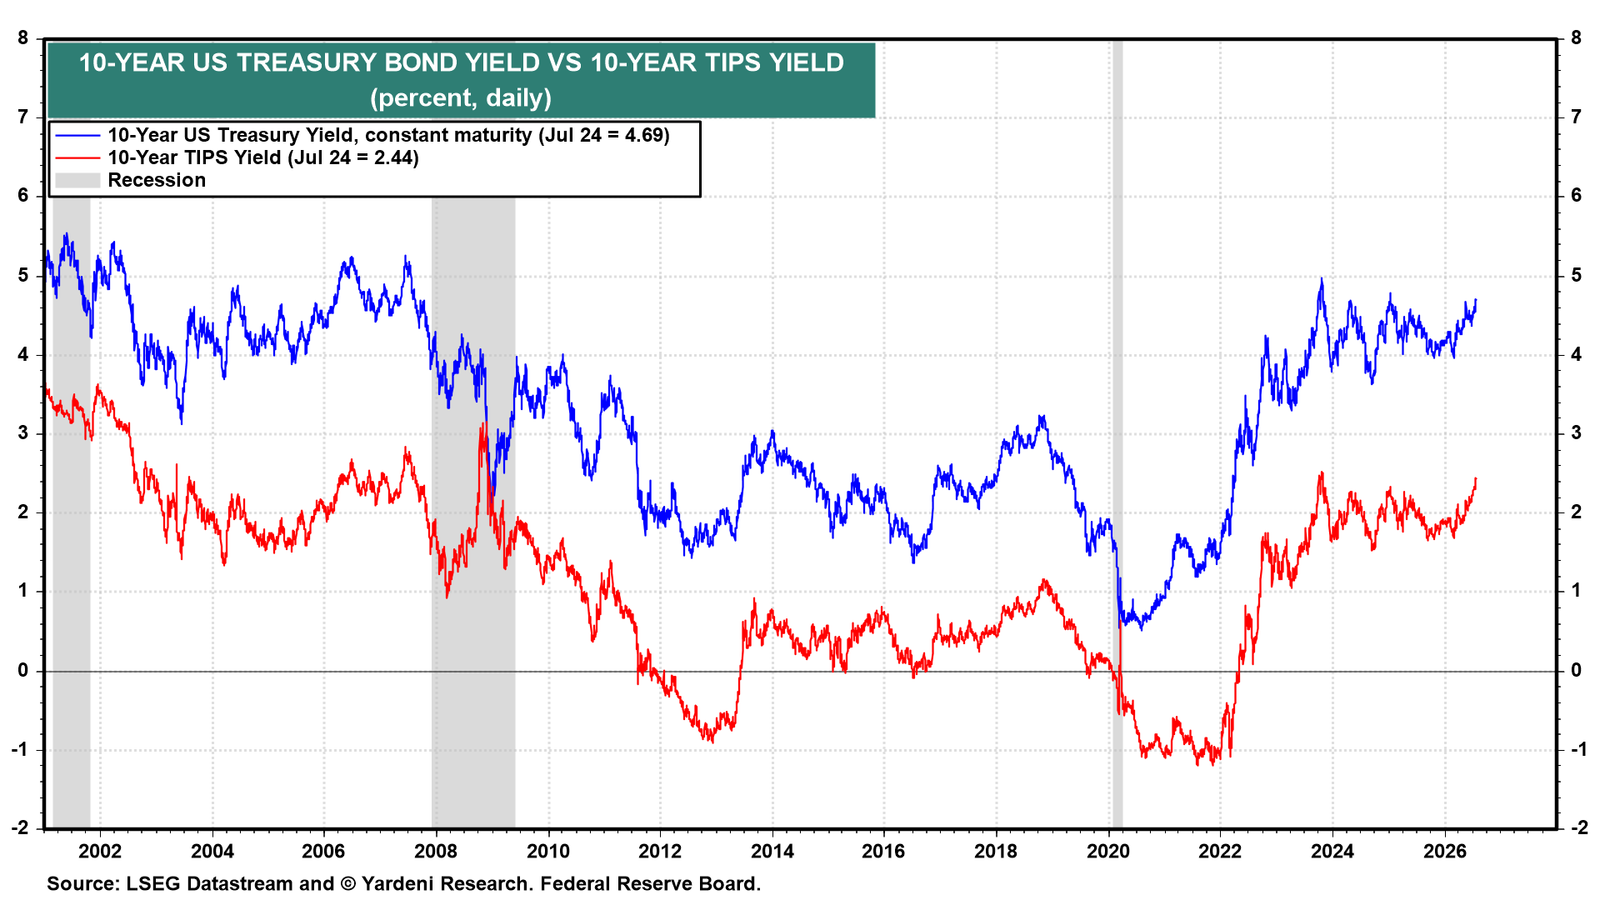
The 10-year Treasury bond yield has been rising this year in unison with the comparable 10-year TIPS yield (chart). Both remain in their ranges that started in late 2023. Both increases might be attributable to the increased supply of corporate bonds issued by the hyperscalers. We continue to expect a wide trading range of 4.00%-5.00% for the 10-year Treasury bond yield.
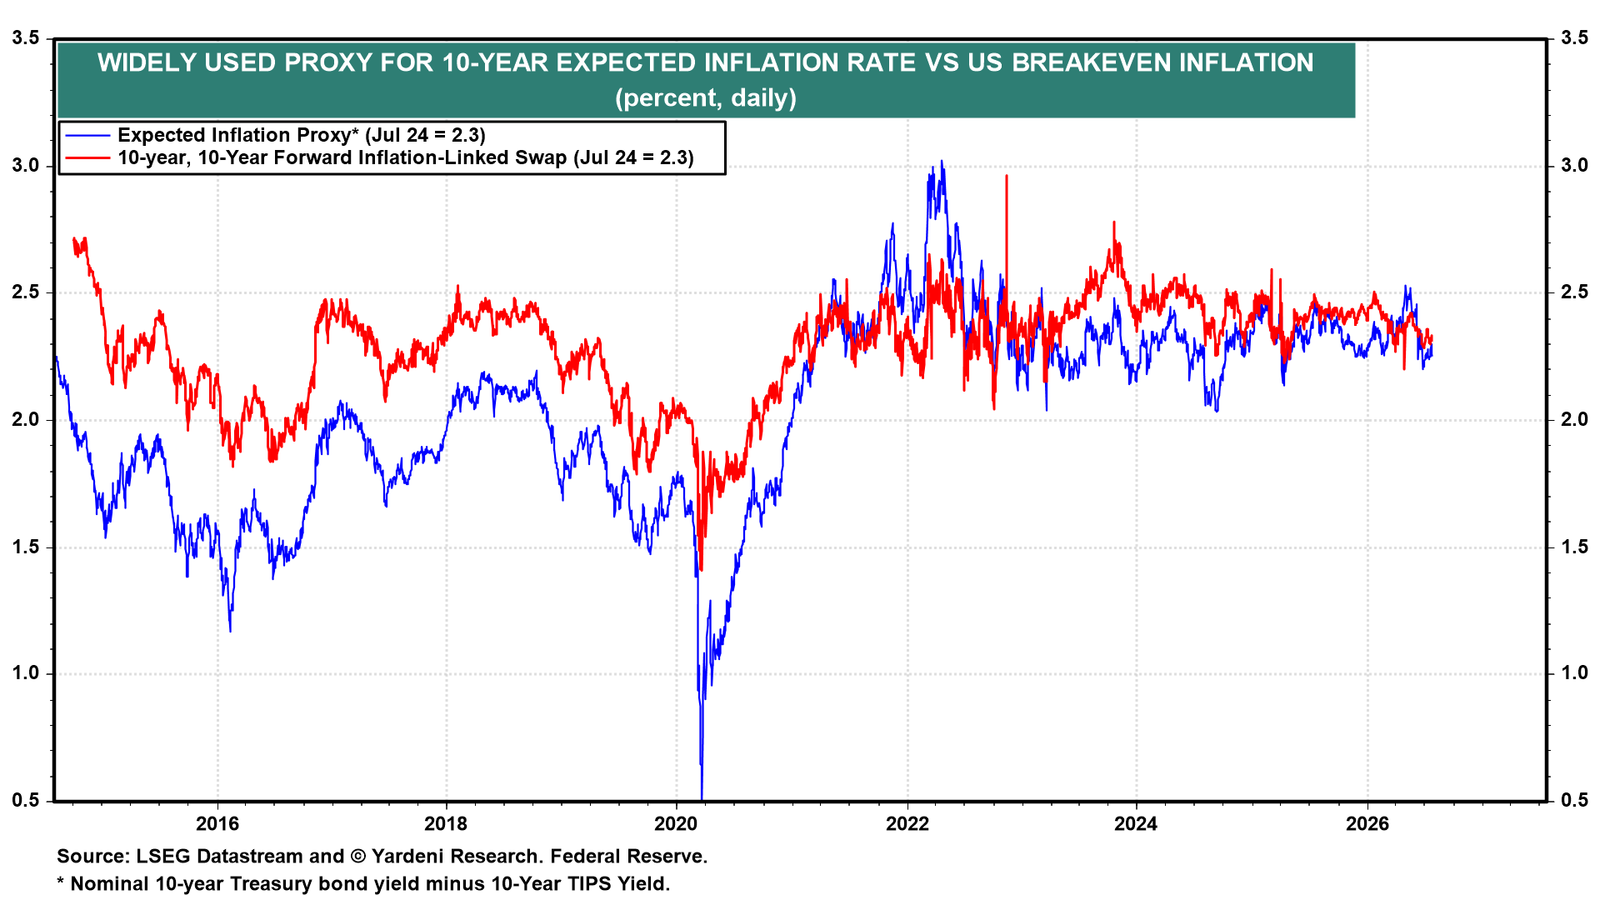
The nominal bond yield seems to be rising along with the price of oil. However, two measures of expected inflation over the next 10 years have remained relatively low at 2.3% currently (chart).
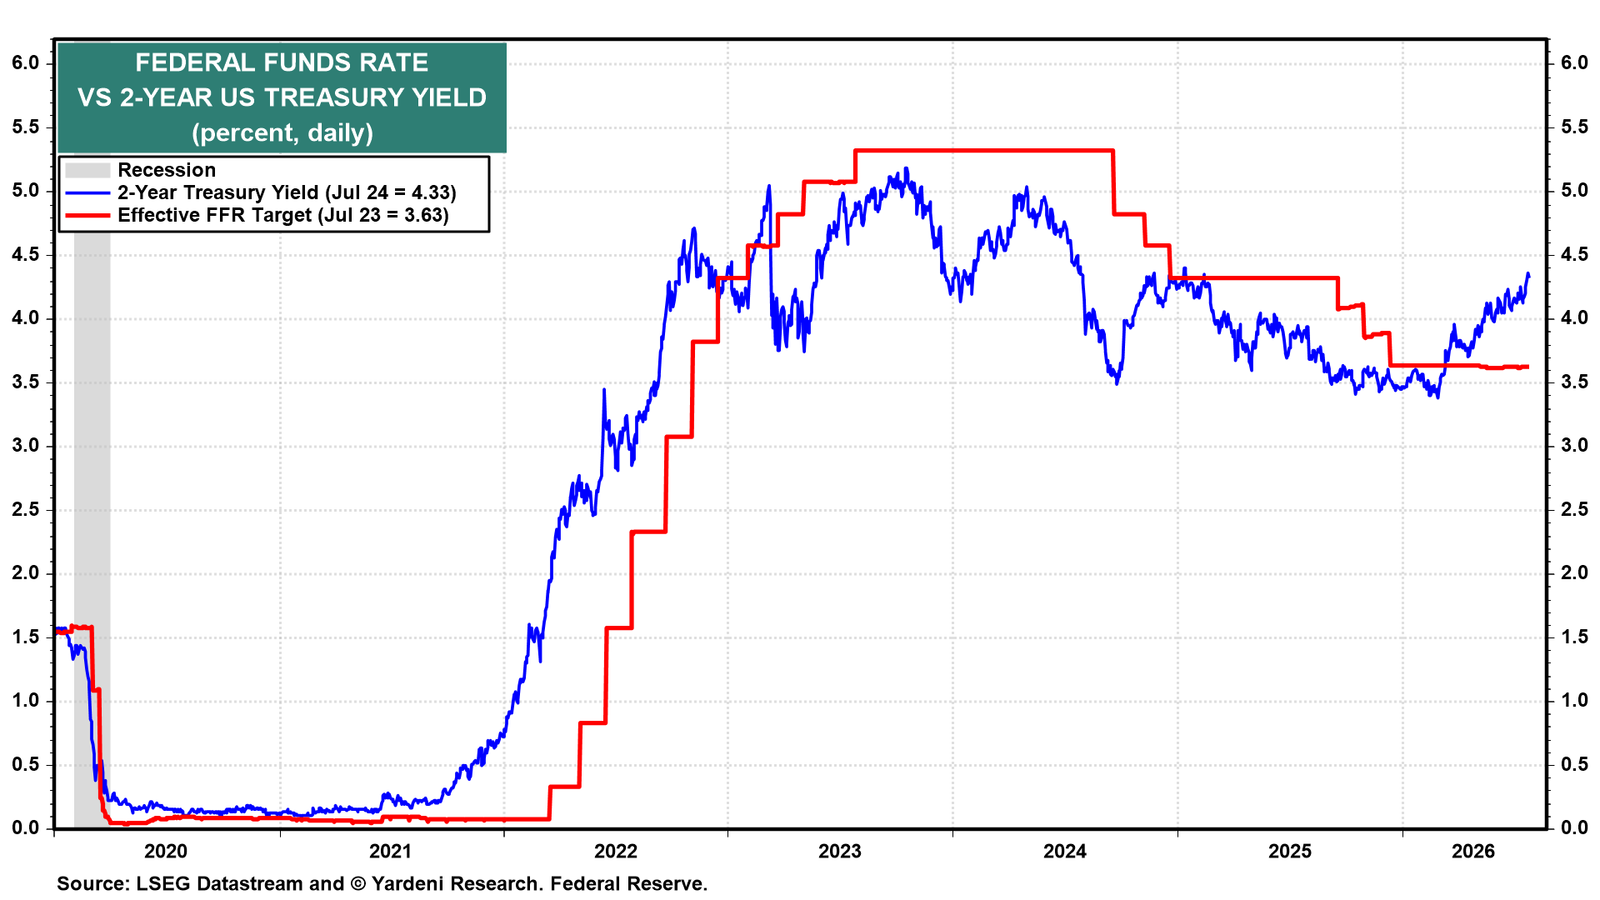
Bond yields are also rising as the Bond Vigilantes demand that the Fed be more vigilant. At 4.33% currently, the 2-year yield is calling for a reversal of last year's three rate hikes, totaling 75bps (chart). These hikes were billed as insurance policies to protect the labor market from weakening. They aren't necessary anymore, given that the risk of higher inflation is clearly greater than the risk of higher unemployment.