I. FOMO vs FEMO
Forecasting the stock market is easy! Just multiply the P/E (price-to-earnings ratio) by E (earnings per share) to get P (the stock price index). The hard part, of course, is getting the P/E and E right. We call the P/E component FOMO (fear of missing out) and the E component FEMO (fabulous earnings momentum). This year, investors have been on a rollercoaster ride as FOMO has fluctuated mostly to the downside, while FEMO has continued climbing.
More recently, concerns about AI investment returns and rising US Treasury yields have tightened credit conditions, raising fears about the sustainability of the AI investment boom and weighing on P/Es. Since early October, multiple compression has outpaced continued earnings gains, dragging many stocks lower.
Semiconductors have been at the center of the recent rout, with the semiconductor stock price index plunging 15.7% over eight consecutive sessions. However, FOMO staged a comeback today, with the Nasdaq rising 1.1% and semiconductors gaining 1.6%, snapping their losing streak. The FOMO rollercoaster continues, but FEMO remains firmly on an upward trajectory.
Here is more:
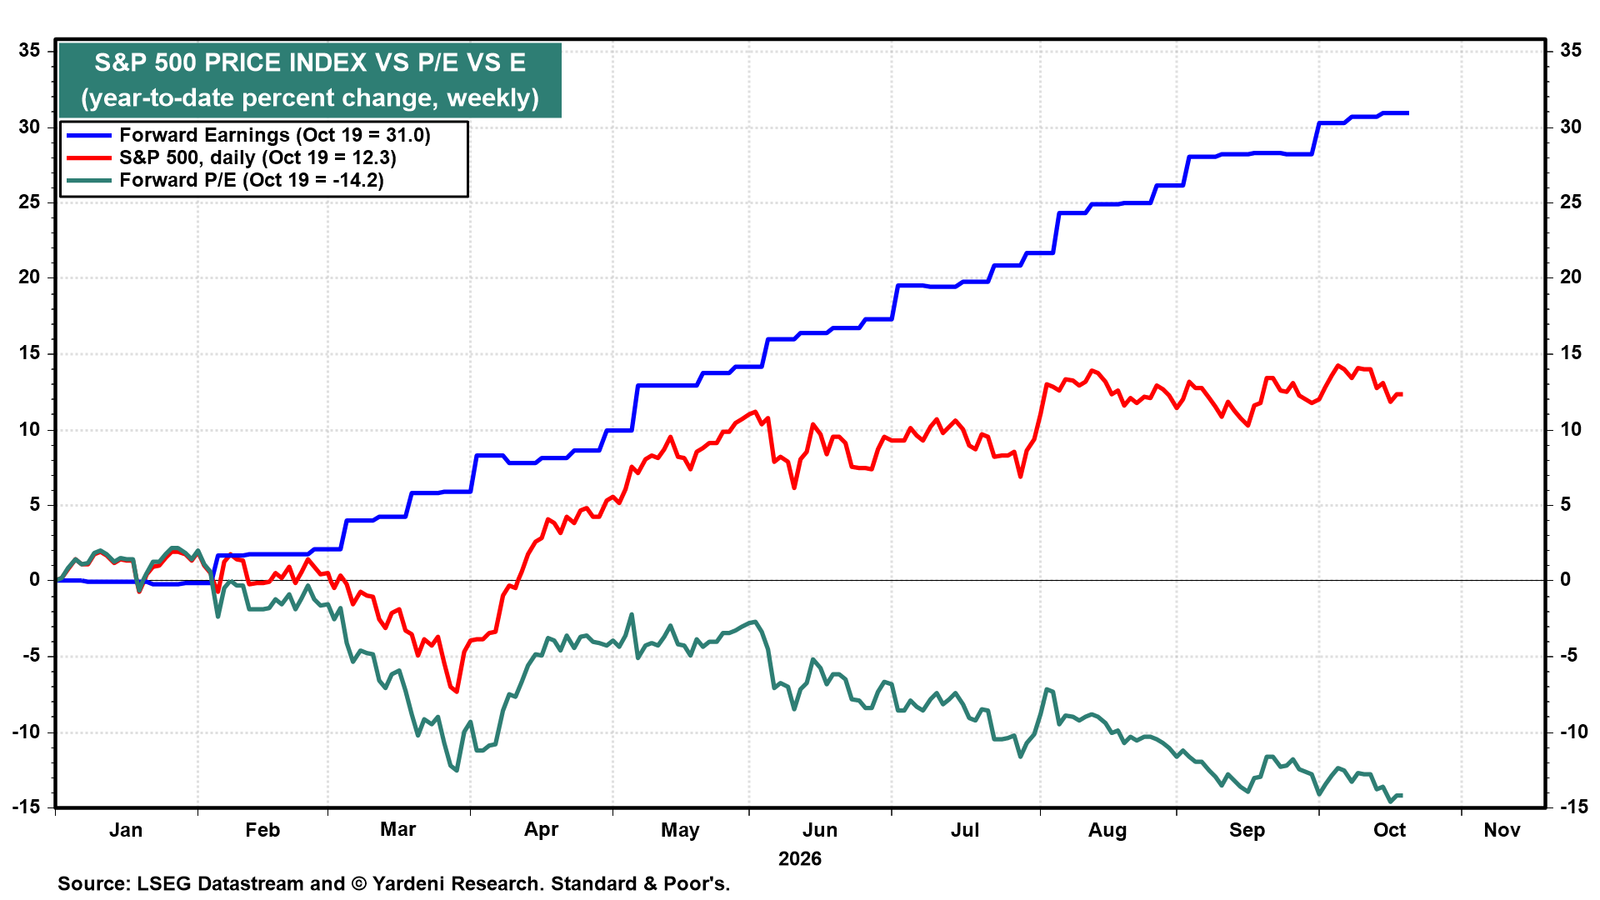
(1) S&P 500. So far this year, forward earnings surged 31.0% ytd through October 19, more than offsetting a 14.2% contraction in the forward P/E. Consequently, the index is up 12.3% ytd (chart).
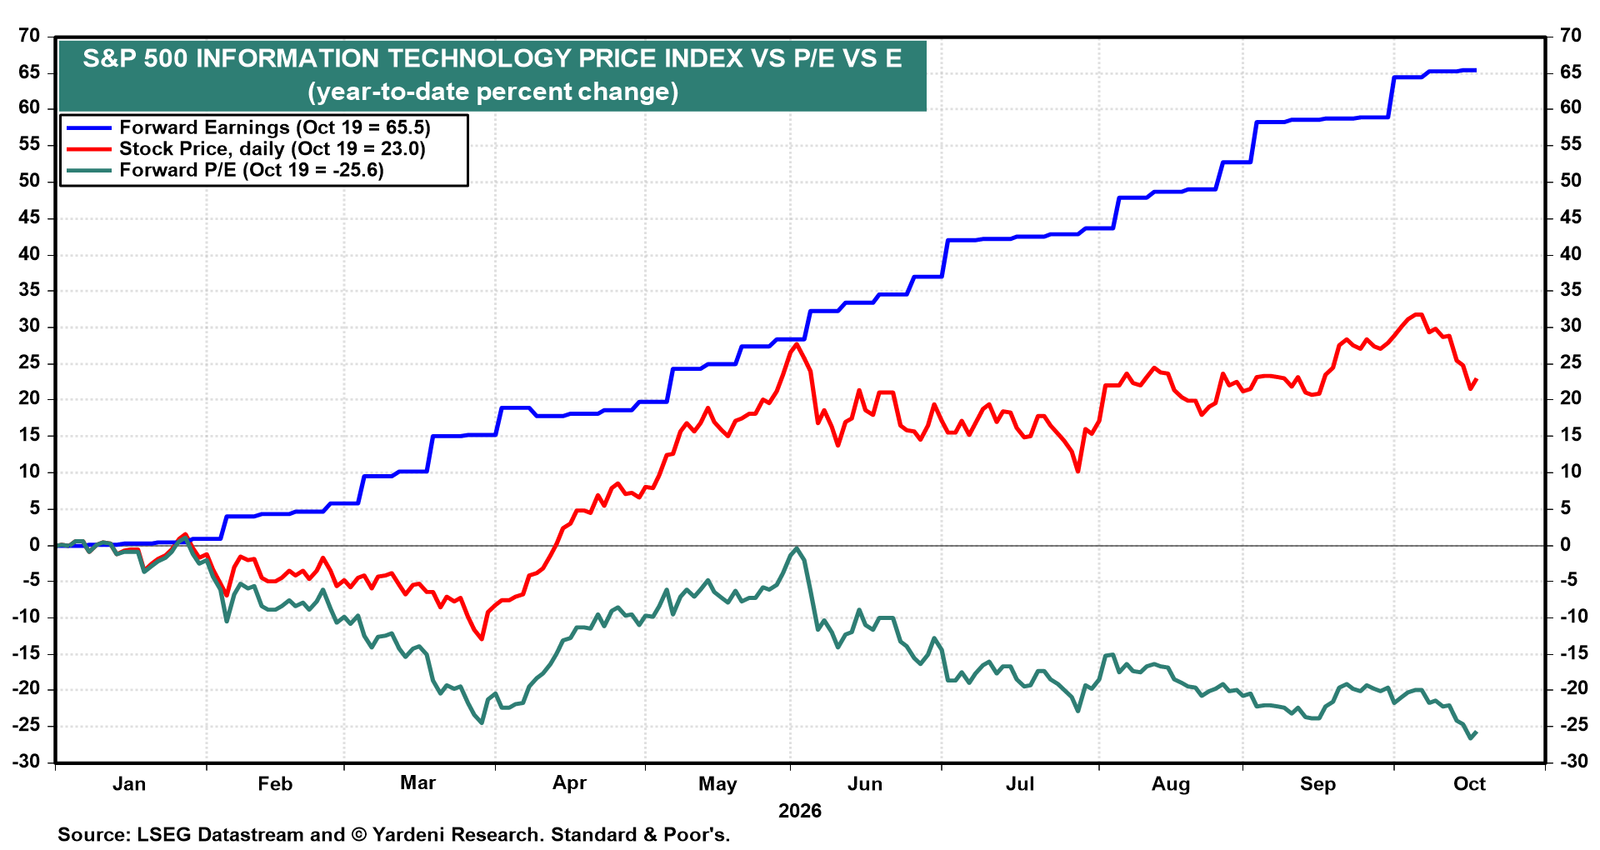
(2) Information Technology. The divergence is even more striking in the S&P 500 Information Technology sector. Forward earnings has soared 65.5% ytd, while the forward P/E has contracted 25.6%, leaving the sector's stock price index up 23.0% ytd (chart). Since early October, however, falling P/Es have outpaced rising earnings, pulling IT stock prices lower.
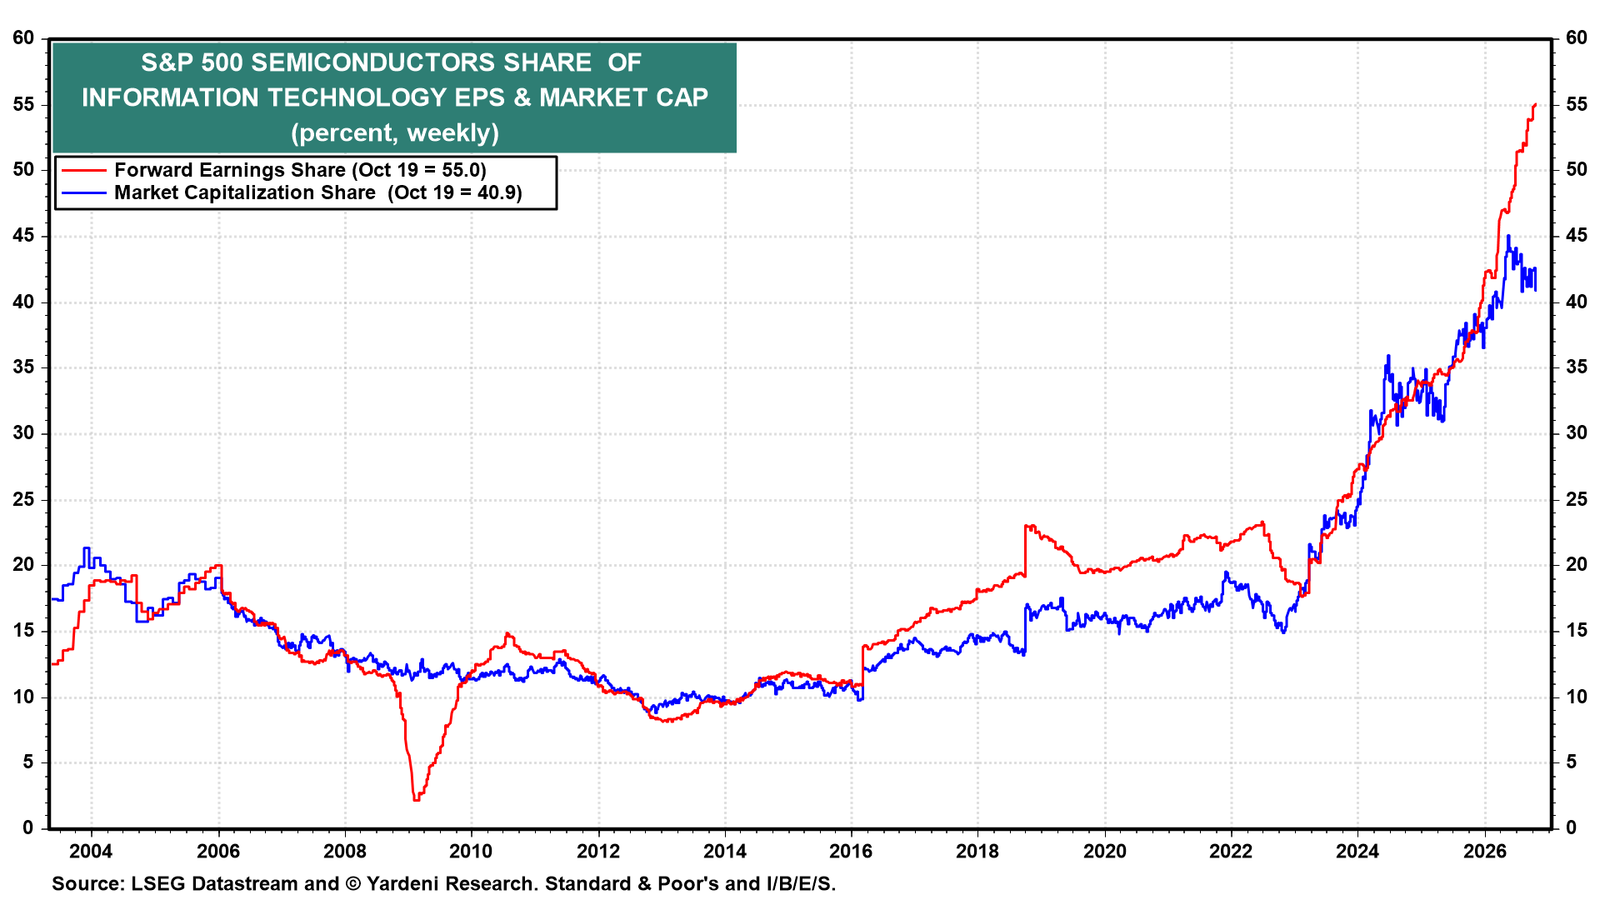
(3) Semiconductors. FEMO is incredibly strong in the S&P 500 Semiconductors industry, which now accounts for a record 55.0% of the IT sector's forward earnings and 40.9% of its market capitalization (chart). That implies a significant forward P/E discount to the rest of the IT sector and to the S&P 500. The discount reflects concerns that rapidly rising borrowing costs for highly leveraged AI infrastructure providers could slow the AI investment boom and weaken demand for chips. Semiconductor earnings continue to soar, but that's because capacity constraints are boosting semiconductor prices, which should fall sooner or later as either demand slows or capacity expands, or both.
(4) Healthy constraints. We view investors' growing concerns about the AI boom as good news. Financial, social, political, and physical constraints should reduce overinvestment risks and keep the boom on a sustainable path. Recently, financial constraints have been in focus, with CoreWeave's bond yields surging above 15% last week as the Bond Vigilantes increasingly scrutinized AI borrowers. The bond market is playing a welcome role in allocating capital more efficiently. Meanwhile, the big hyperscalers remain the boom's main drivers, supported by strong cash flows and ample access to capital. The AI rollercoaster may be hitting speed bumps, but that will help keep it on a steadier path.
II. Industrial Production
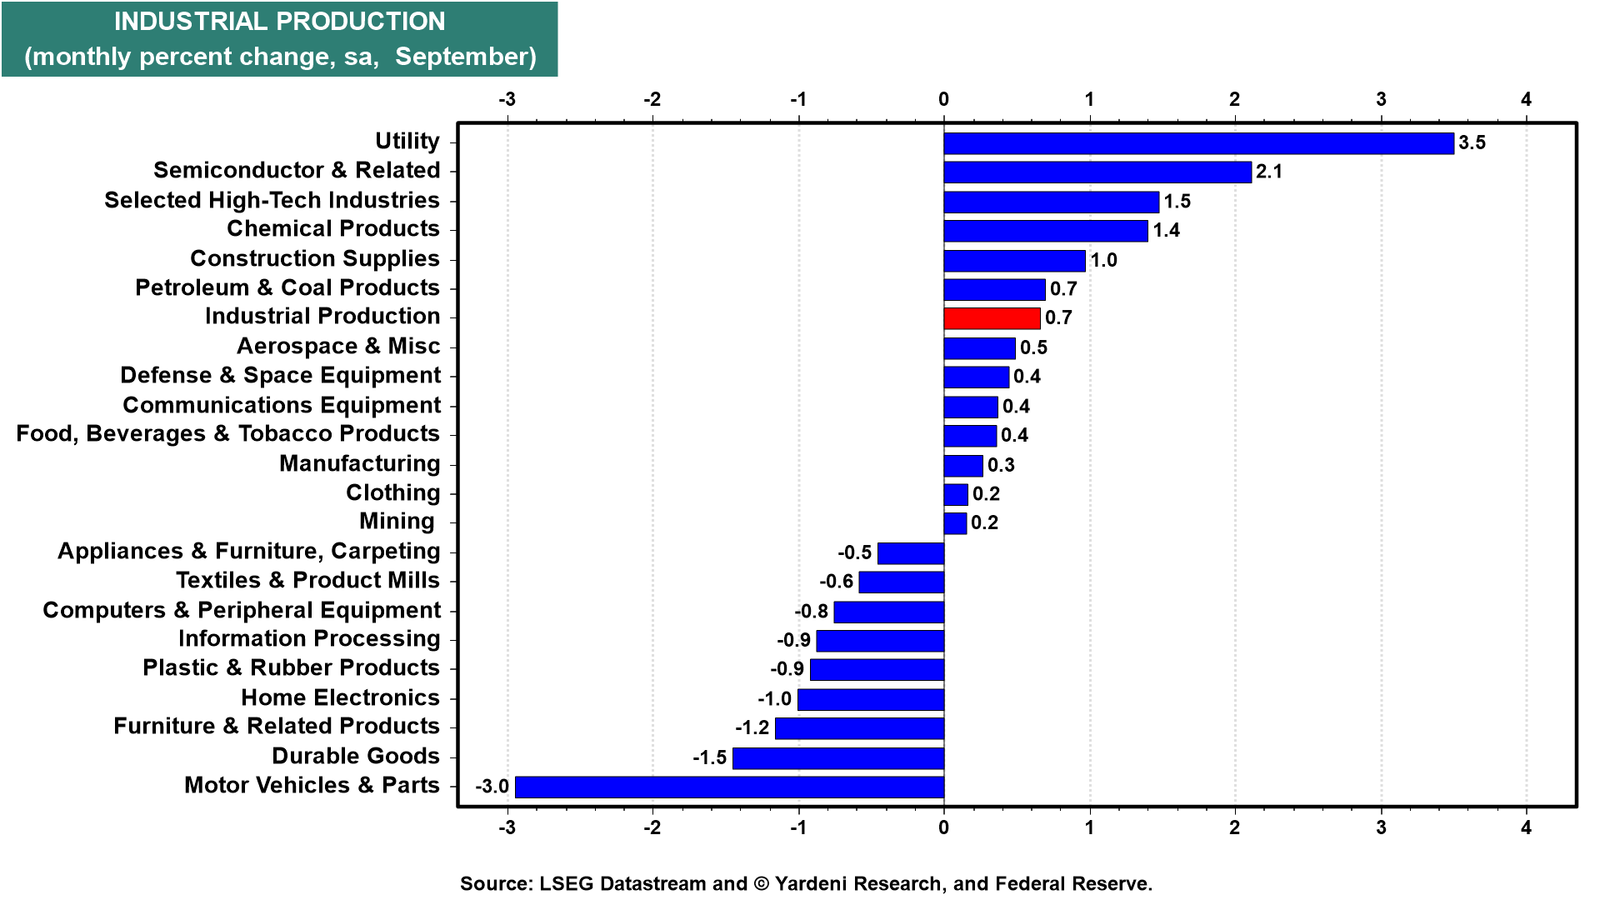
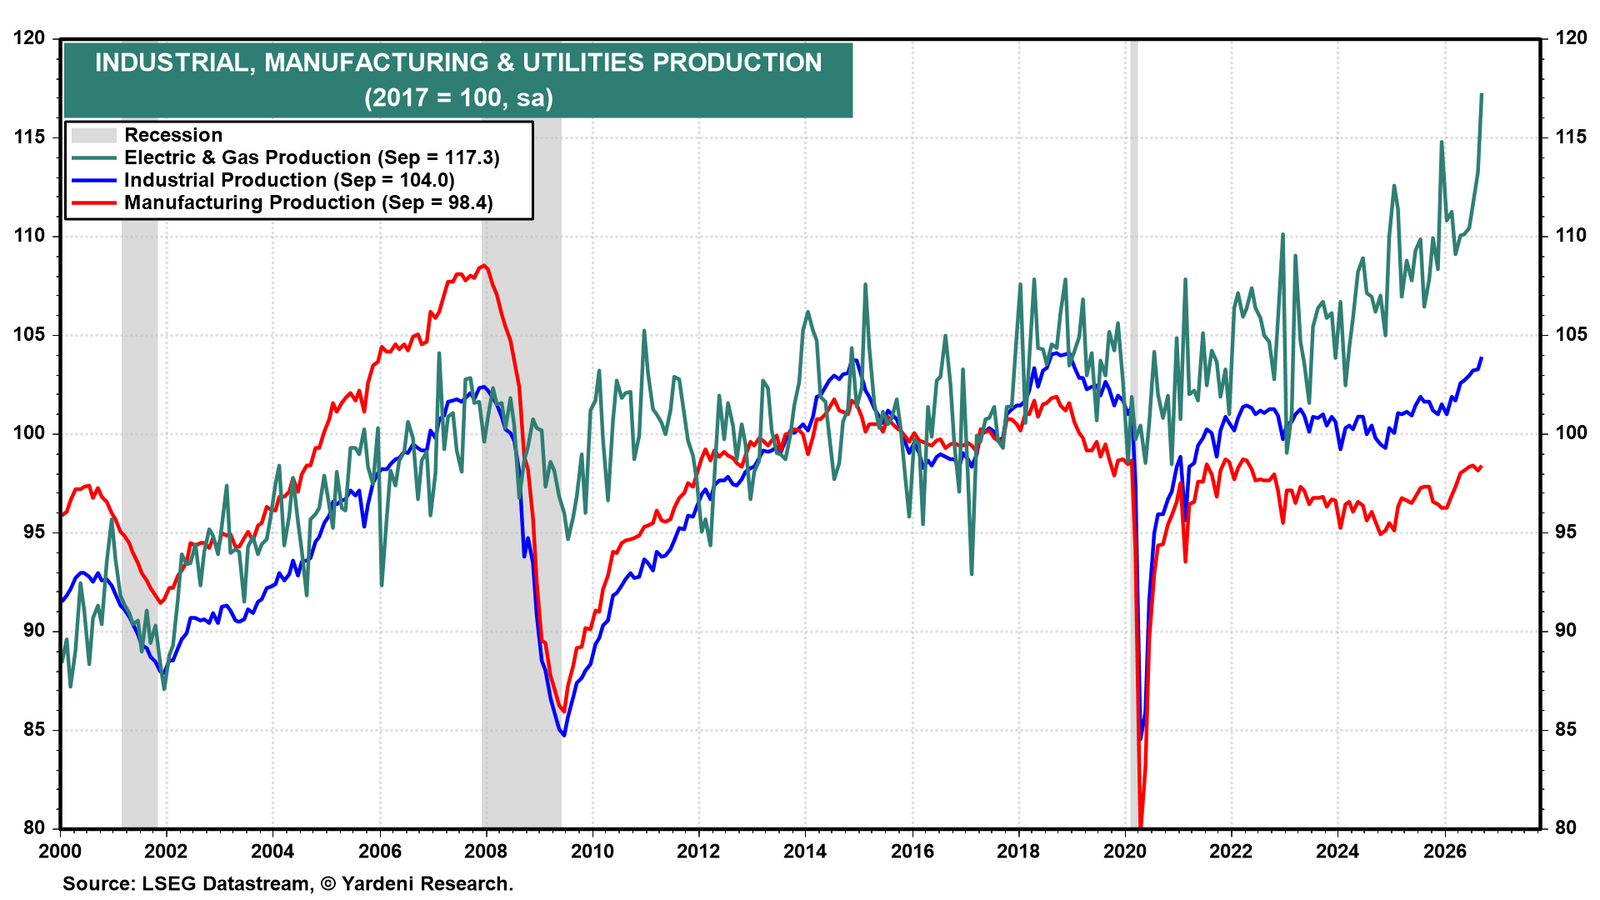
The strength of the US economy continues to underpin strong earnings growth. Industrial production rose 0.7% m/m in September, its biggest gain since April, and 2.2% y/y, the strongest since September 2022 (charts). Leading the way higher was utilities output. That reflects rising electricity demand from data centers and manufacturing, as well as weather-related demand. Manufacturing output edged up 0.3%.
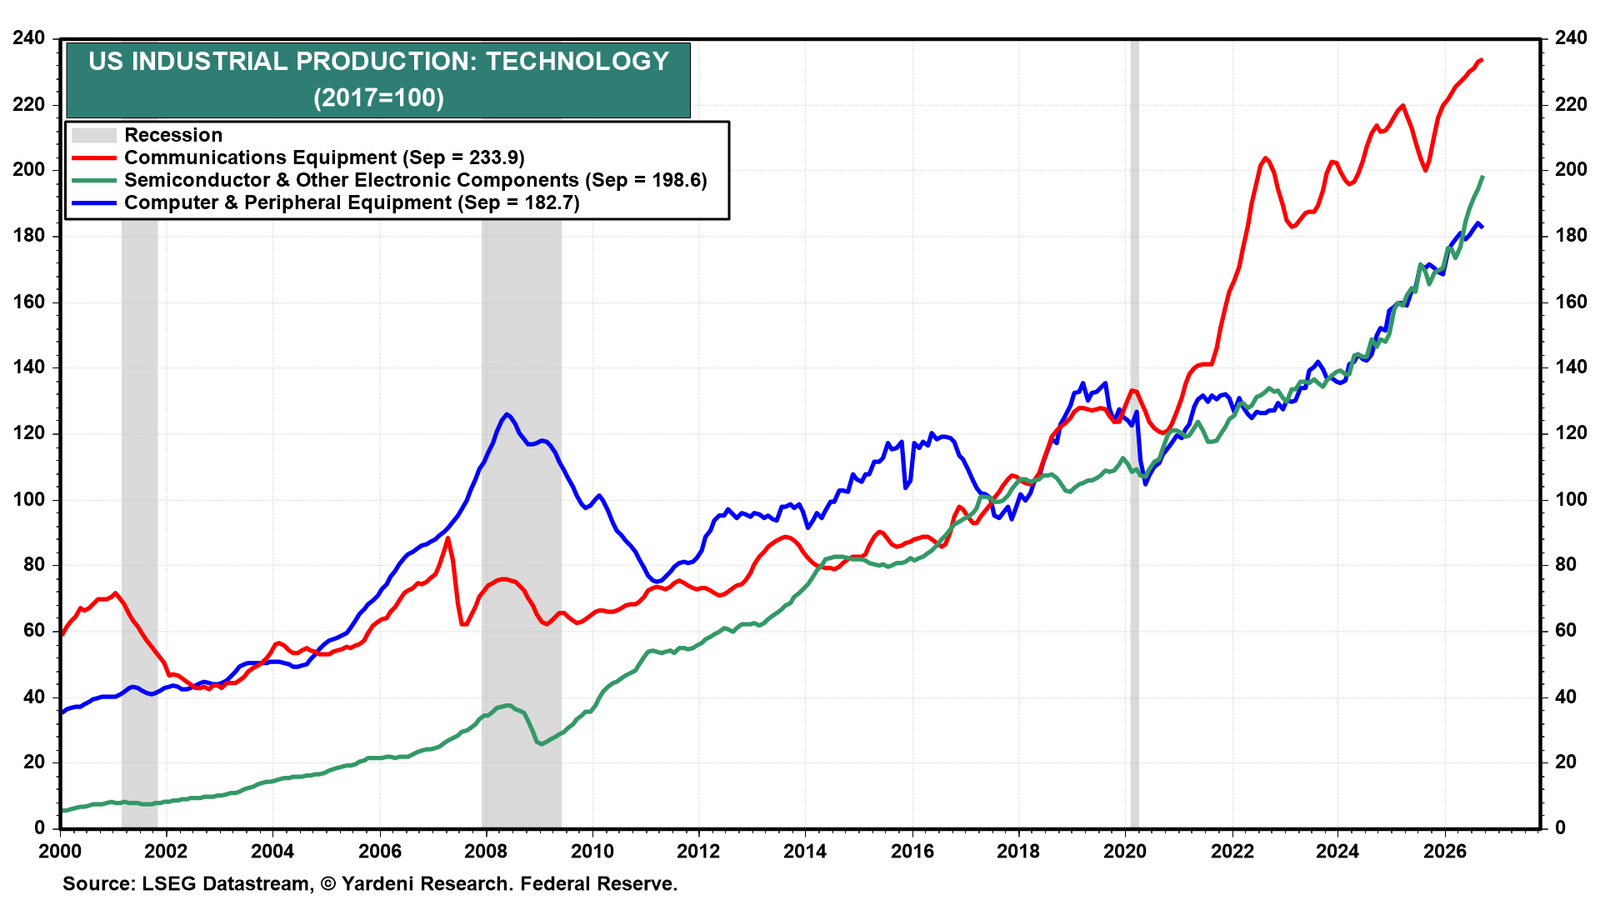
Since ChatGPT was released in late 2022, technology-related industrial production has risen sharply to record highs (chart).
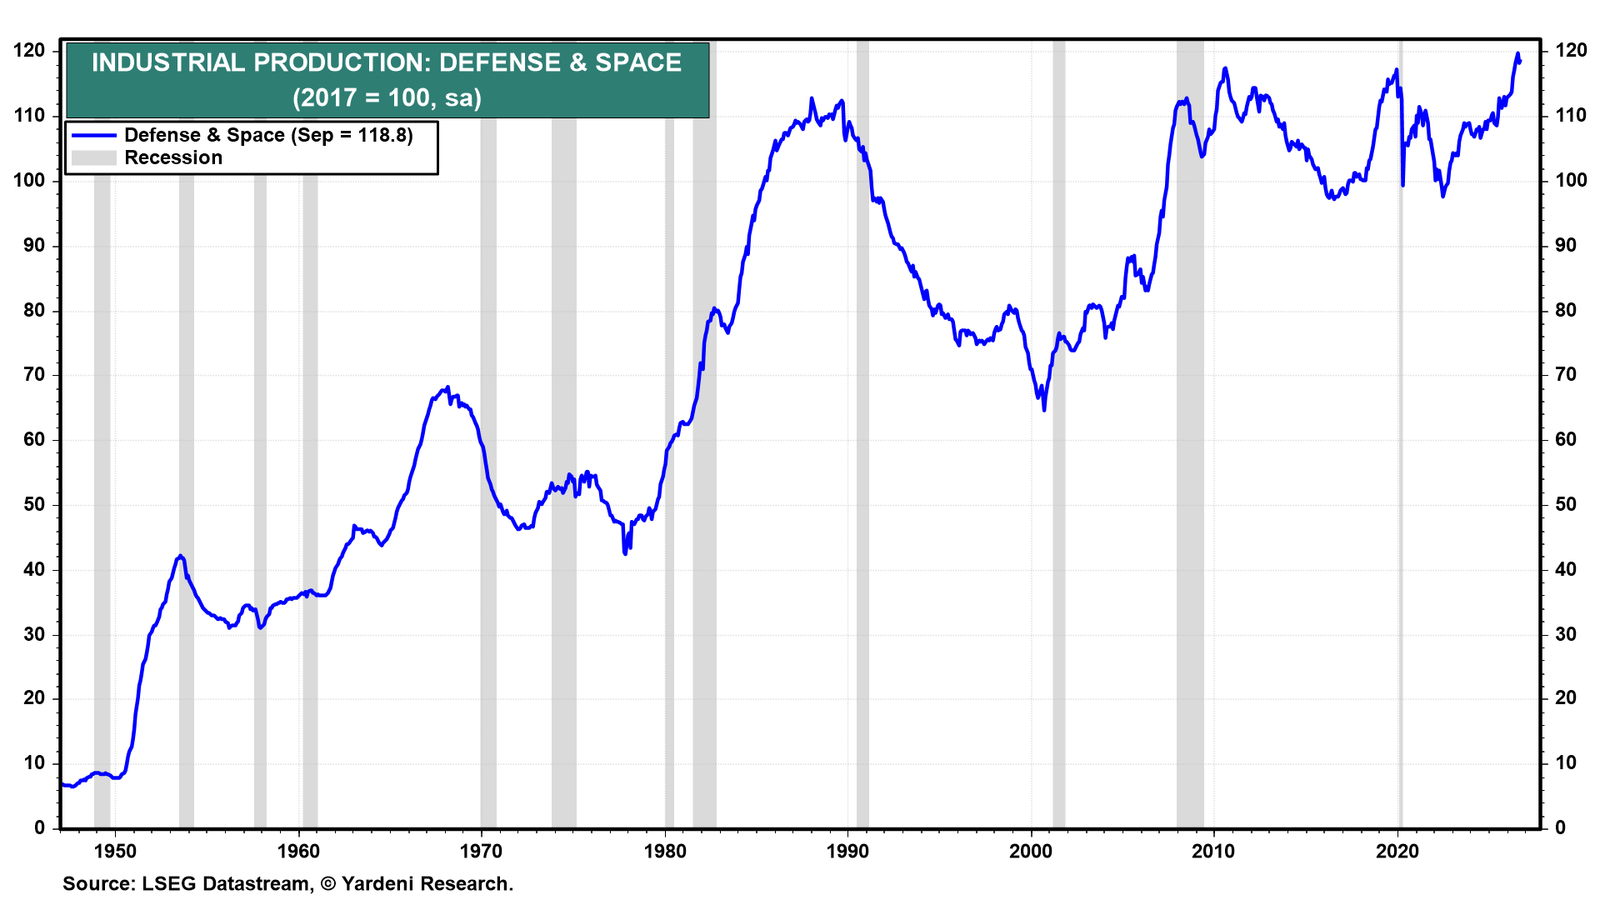
Defense and space equipment production also continues to increase at a solid pace, supported by rising military spending and the rapid growth of the space industry (chart).
III. Federal Deficit
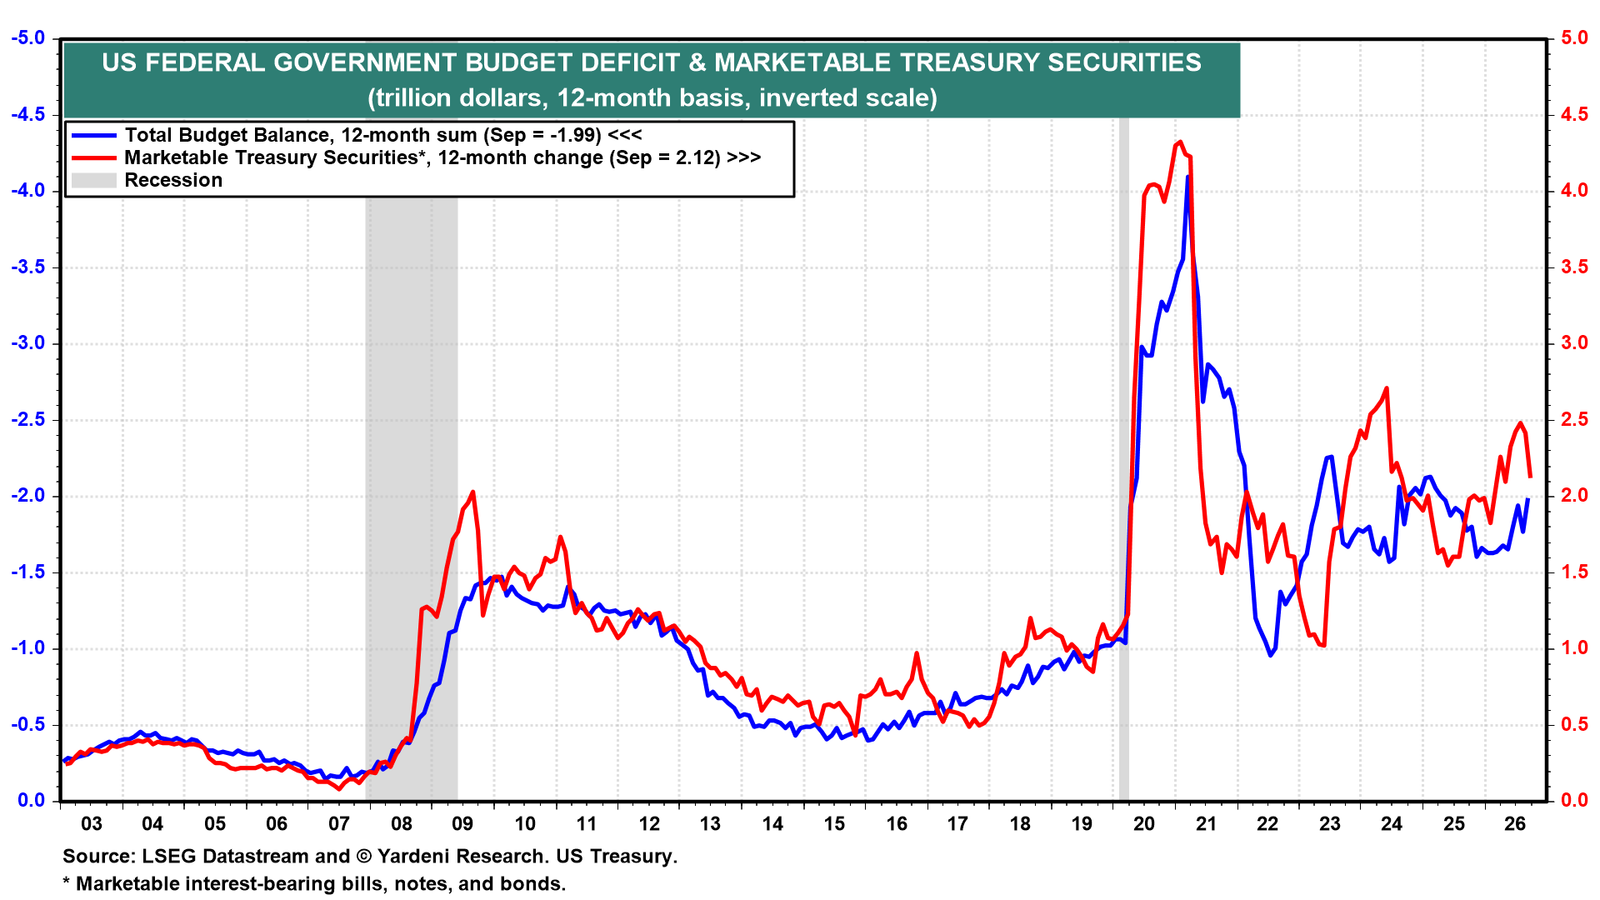
Fiscal policy also continues to boost economic growth, though at the cost of large federal deficits and mounting federal debt. The federal budget deficit totaled $1.99 trillion over the 12 months through September, while marketable Treasury debt increased by $2.12 trillion (chart).
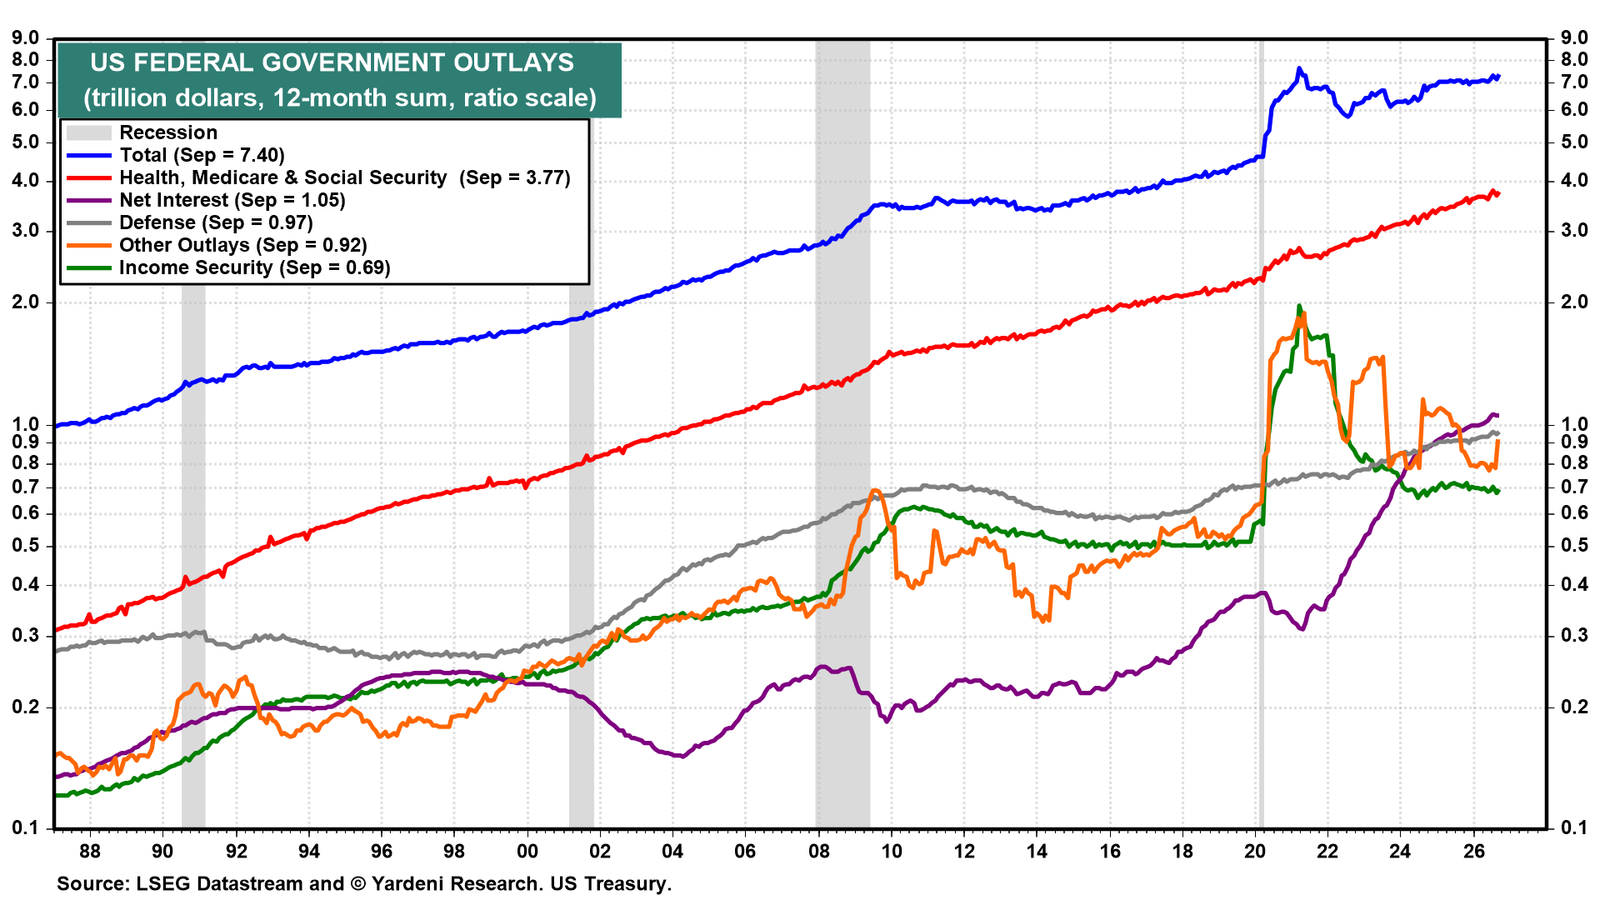
Federal outlays reached $7.40 trillion, including $3.77 trillion for health care, Medicare, and Social Security (chart). Notably, net interest payments reached a record $1.05 trillion, exceeding defense spending of $970 billion.
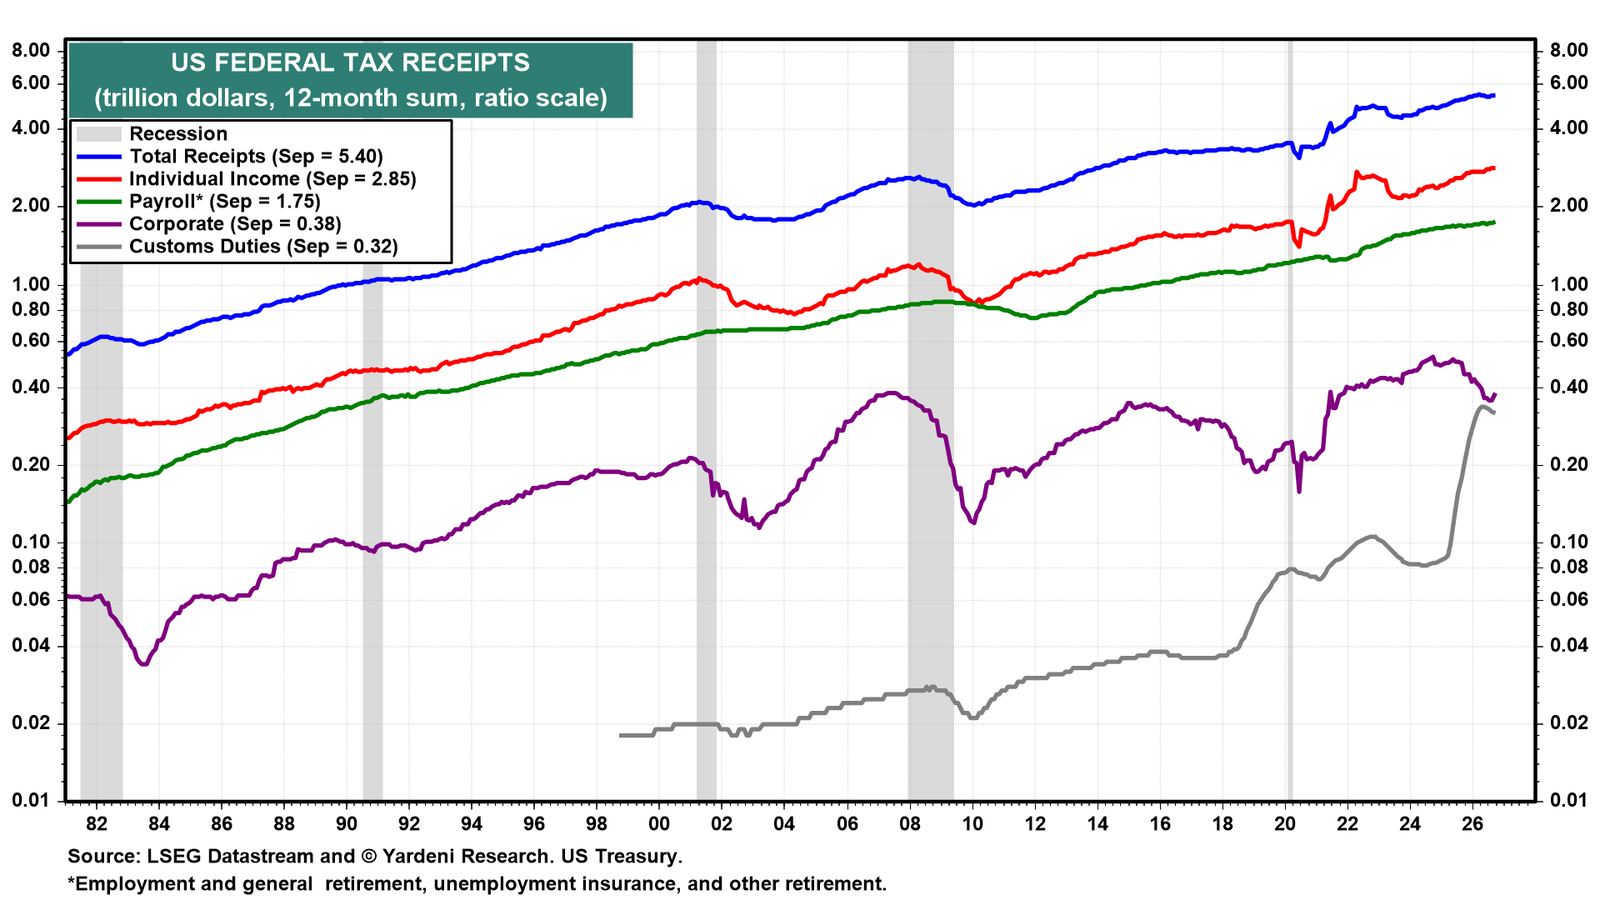
Tax receipts totaled $5.40 trillion, supported by rising individual income and payroll taxes as well as tariff revenues (chart). Corporate income tax receipts have been depressed this year by the 100% depreciation allowance granted by last year's One Big Beautiful Bill Act (OBBB).
IV. Foreign Capital Flows
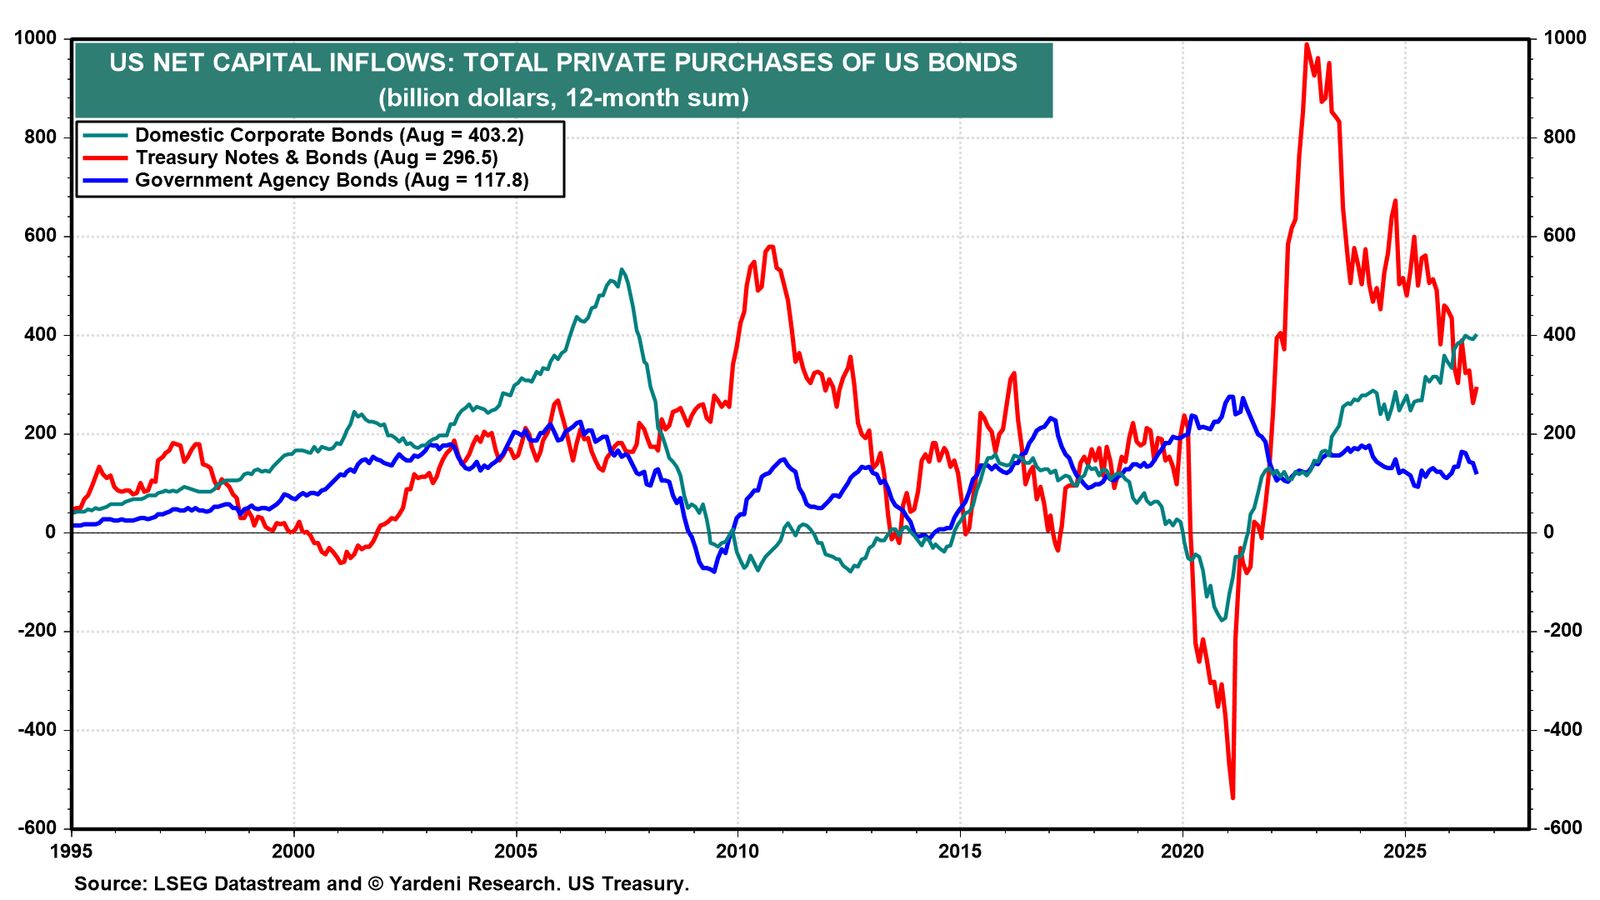
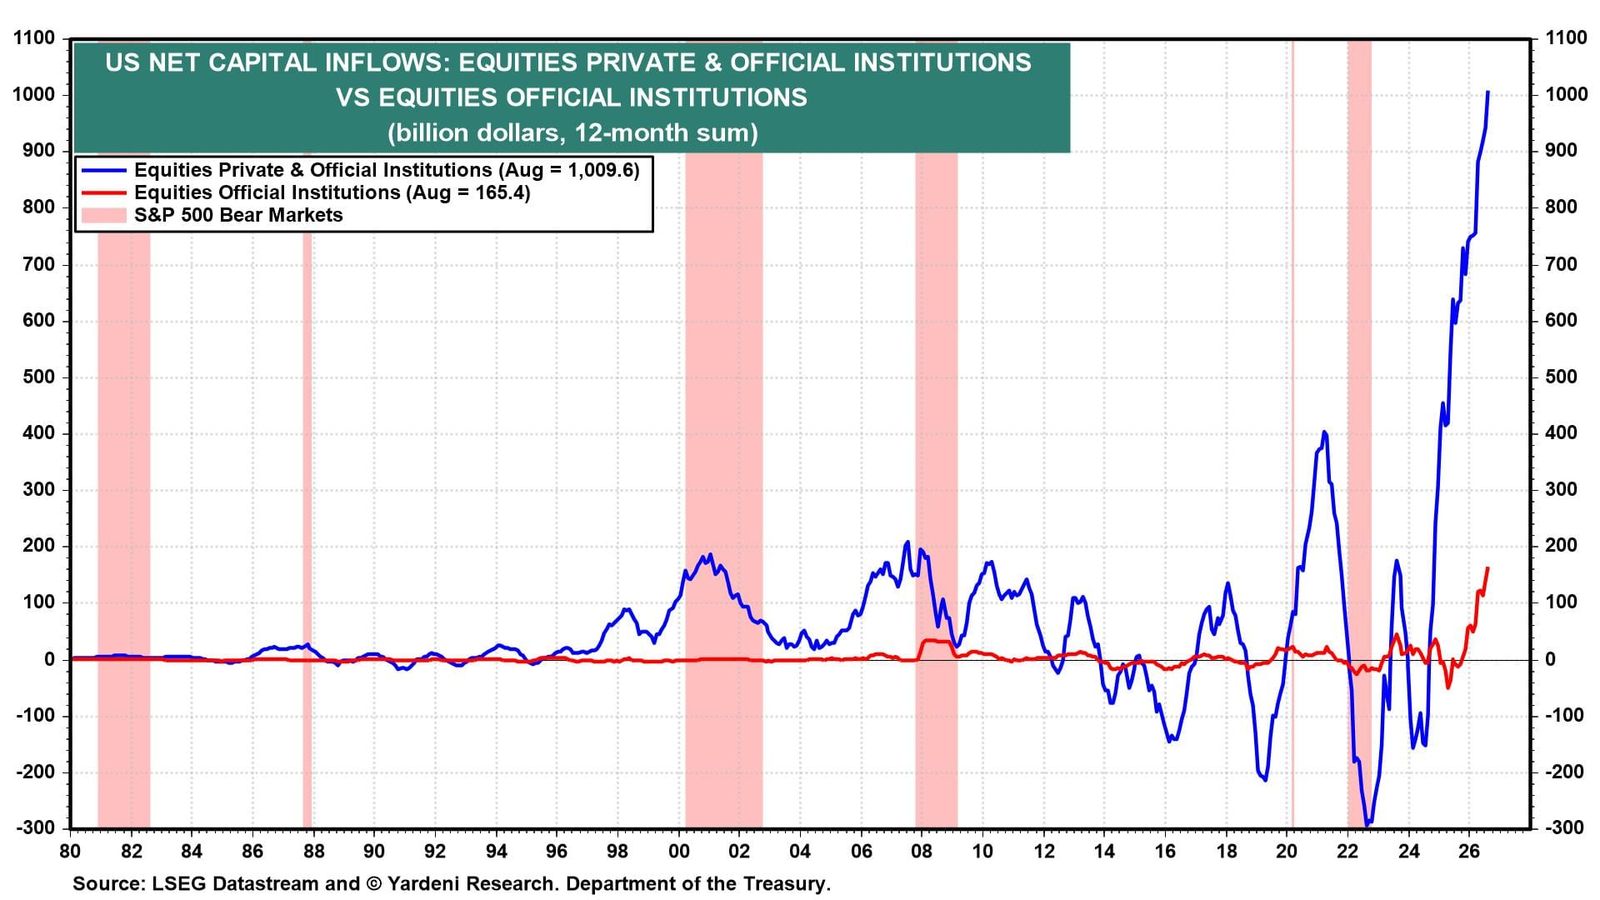
Given Corporate America's FEMO, it is not surprising that foreign capital continues to pour into US financial markets. Over the 12 months through August, net foreign purchases of US equities totaled a whopping $1.01 trillion, followed by corporate bonds and Treasury notes and bonds (chart). Apparently, foreign investors have a greater appetite for US equities and corporate bonds than for US Treasuries.
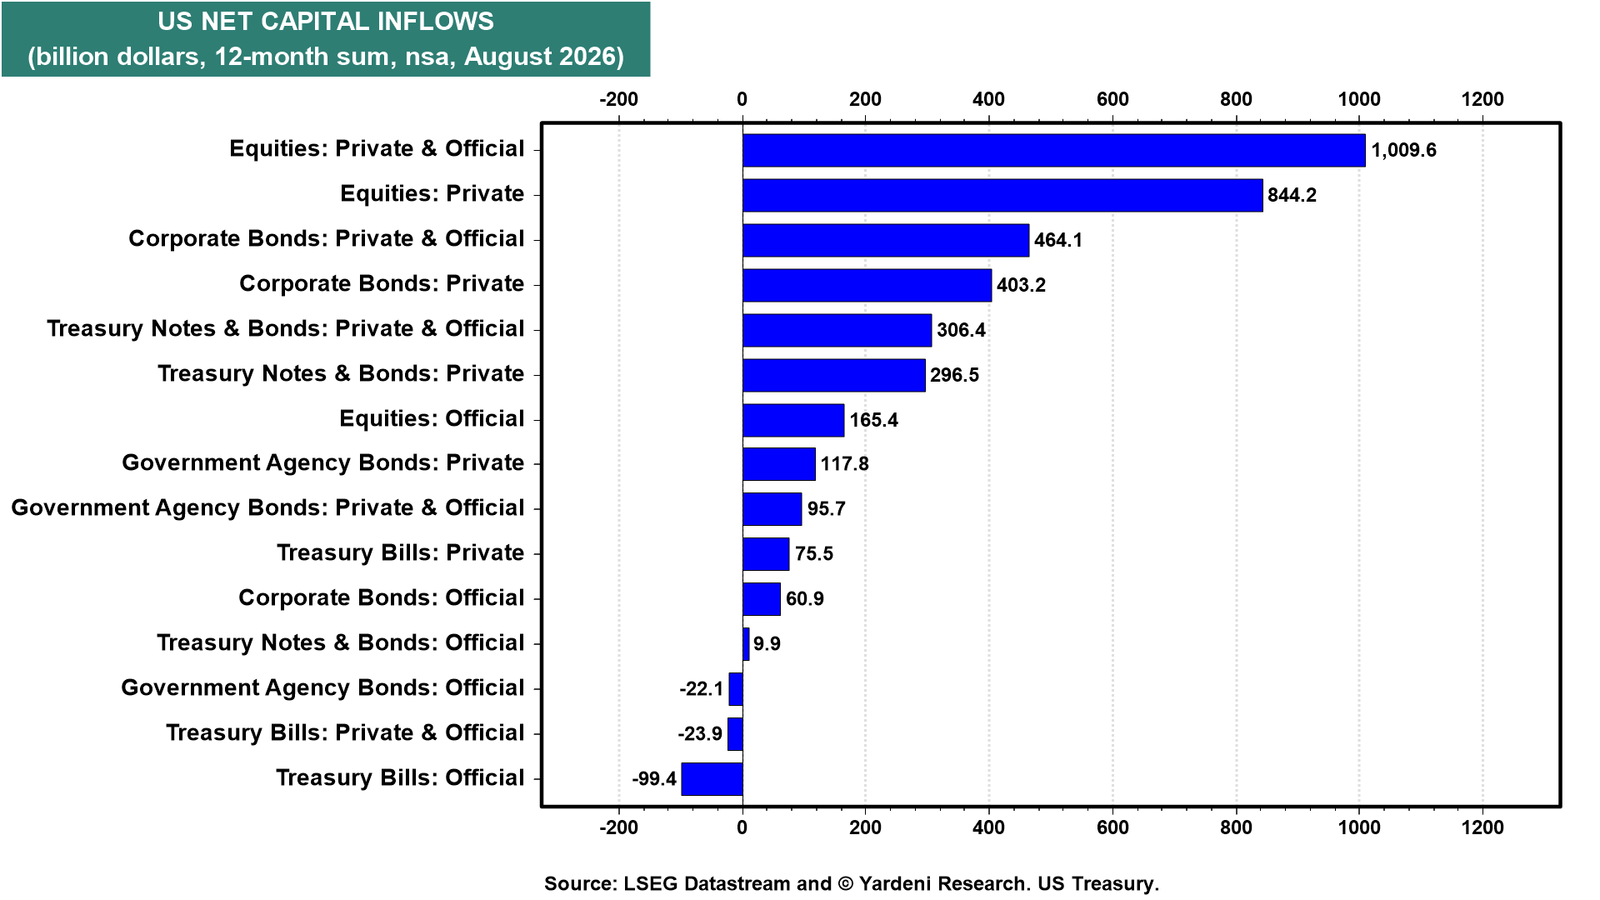
Net foreign equity inflows surged to a record high, far exceeding previous peaks (chart). Private investors accounted for $844 billion, while foreign official institutions contributed another $165 billion, a remarkable development given their historically limited participation in US equity markets.
Foreigners purchased more US corporate bonds than US Treasury notes and bonds over the past 12 months (chart).