We are downgrading the “Go Global” portfolio strategy from overweight to market weight and raising “Stay Home” (in the US) from underweight to market weight.
Overseas earnings remain impressive, but the rallies in emerging market economies’ stock markets have been led by just a handful of AI-related stocks. Last week's rout in South Korea showed how vulnerable such concentration leaves these stock markets. Additionally, European economies look set to struggle as France's fiscal problems loom, and China's economy depends almost entirely on exports. Plus, the Middle East war could flare up again before or after the US midterm elections on November 3, keeping oil prices, inflation, and interest rates elevated.
Here's more:
I. Global Bonds
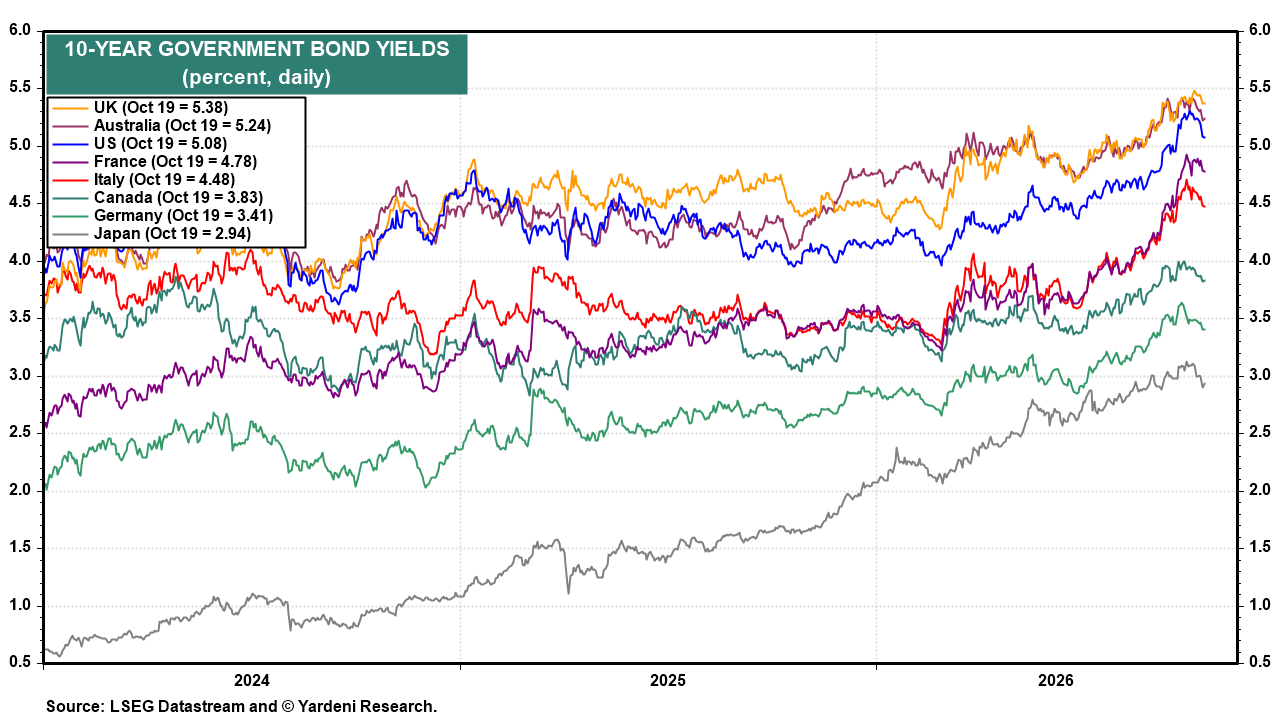
The global bond rout took a breather last week. Yields fell in all eight major bond markets we track, led by the US (chart). The US 10-year Treasury yield fell 16bps to 5.08%, even as the CPI rose 3.7% y/y and the PPI jumped 6.3% in September. That suggests bond investors see these rates as attractive relative to their long-term inflation expectations.
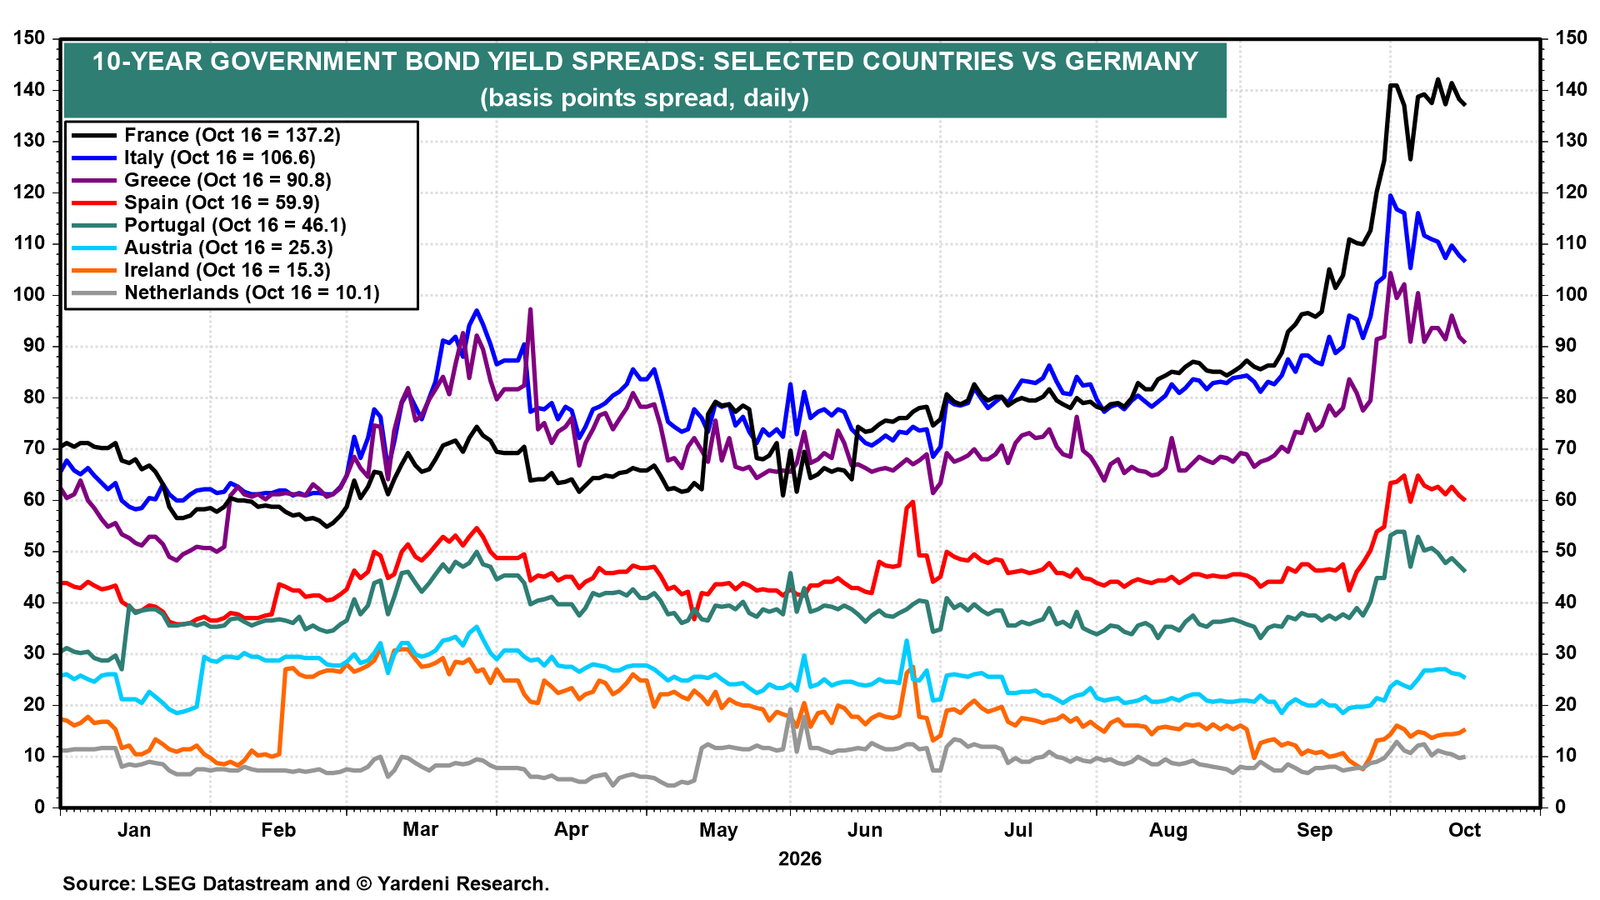
The spread between French and German 10-year yields has stabilized at around 137bps, near its recent high (chart). Spreads for Italy, Greece, Spain, and Portugal have eased slightly from their late-September peaks. Contagion from France has eased for now. But France's own fiscal risk premium hasn't. The National Assembly began debating France's 2027 budget on October 13. Meanwhile, Paris is burning!
II. Global Stocks
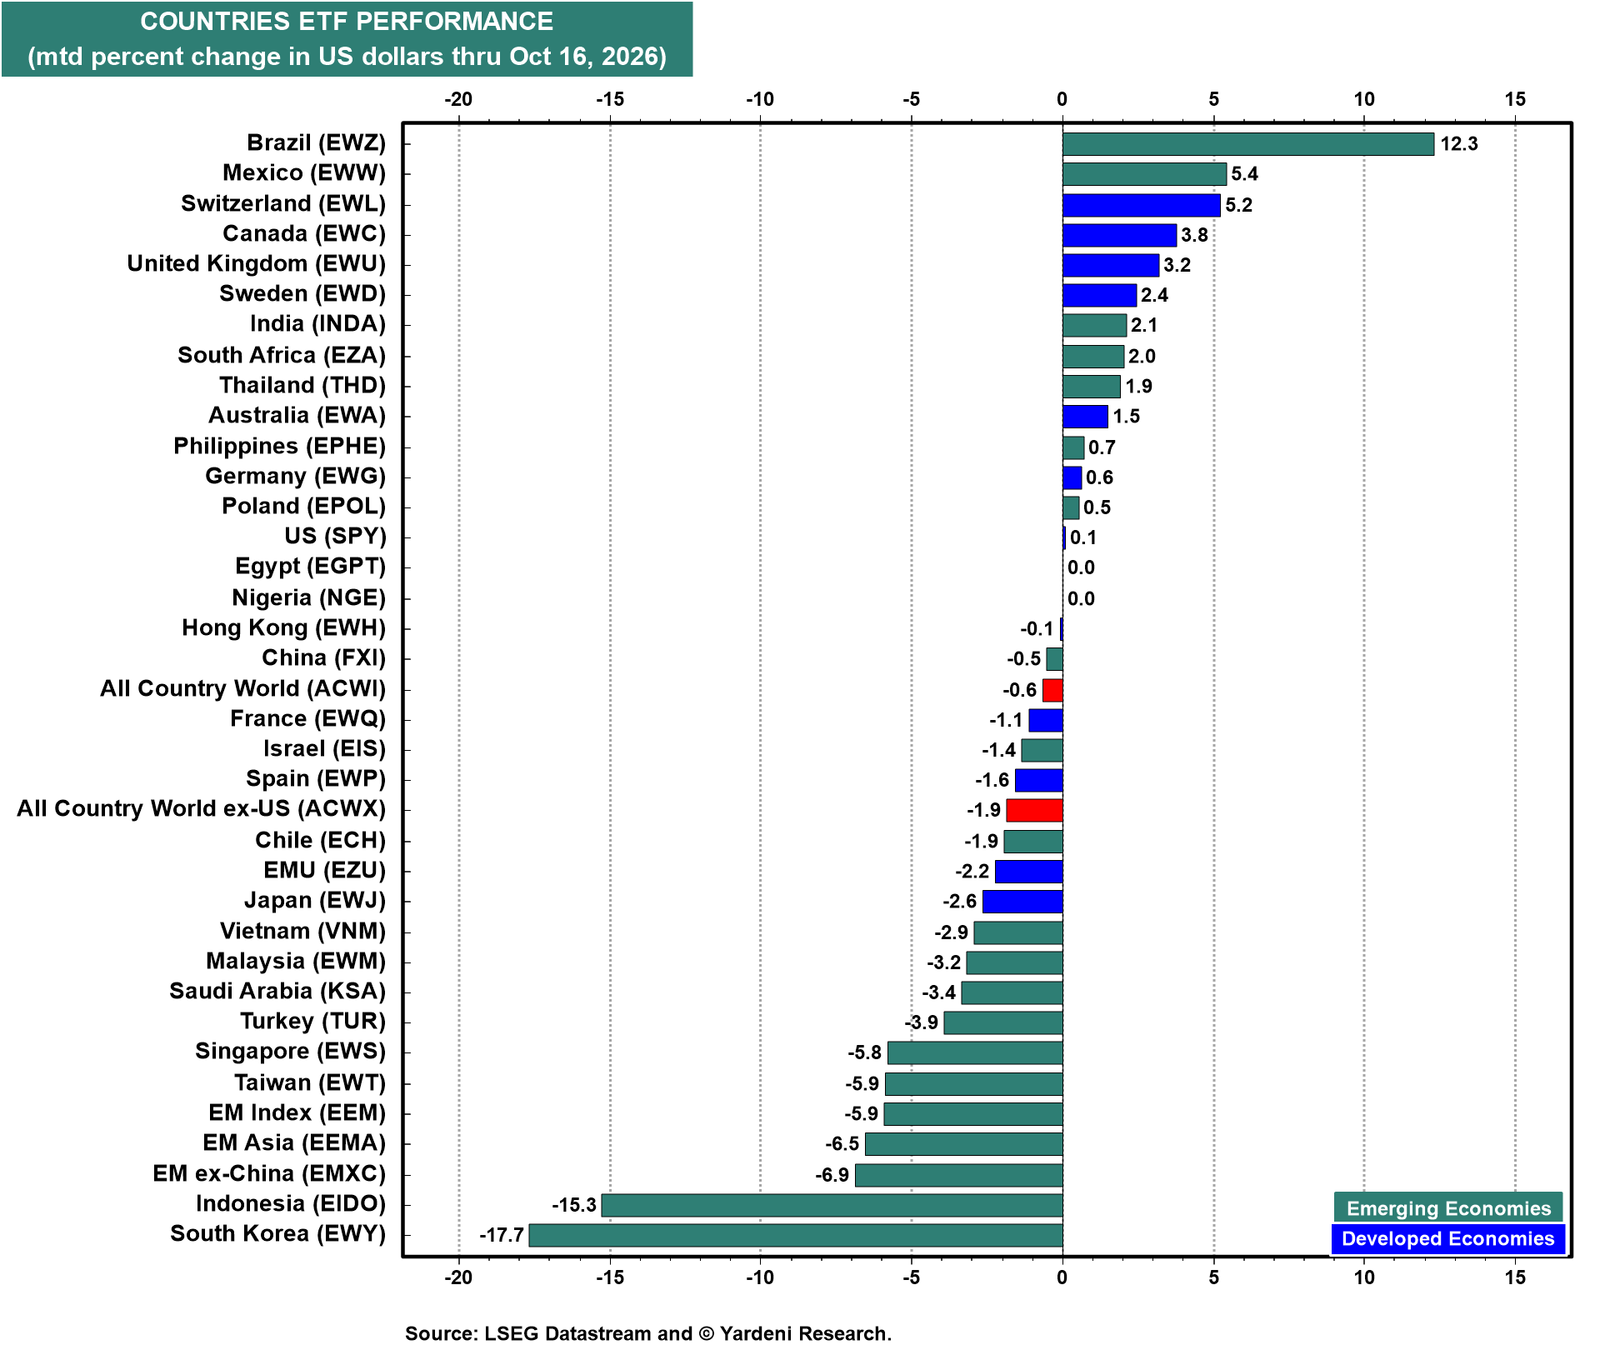
Brazil leads the country ETF rankings mtd, up 12.3% in dollars, ahead of next Sunday's presidential runoff (chart). South Korea is at the bottom, down 17.7%. The US is up 0.1%, ahead of the All Country World ex-US ETF, down 1.9%.
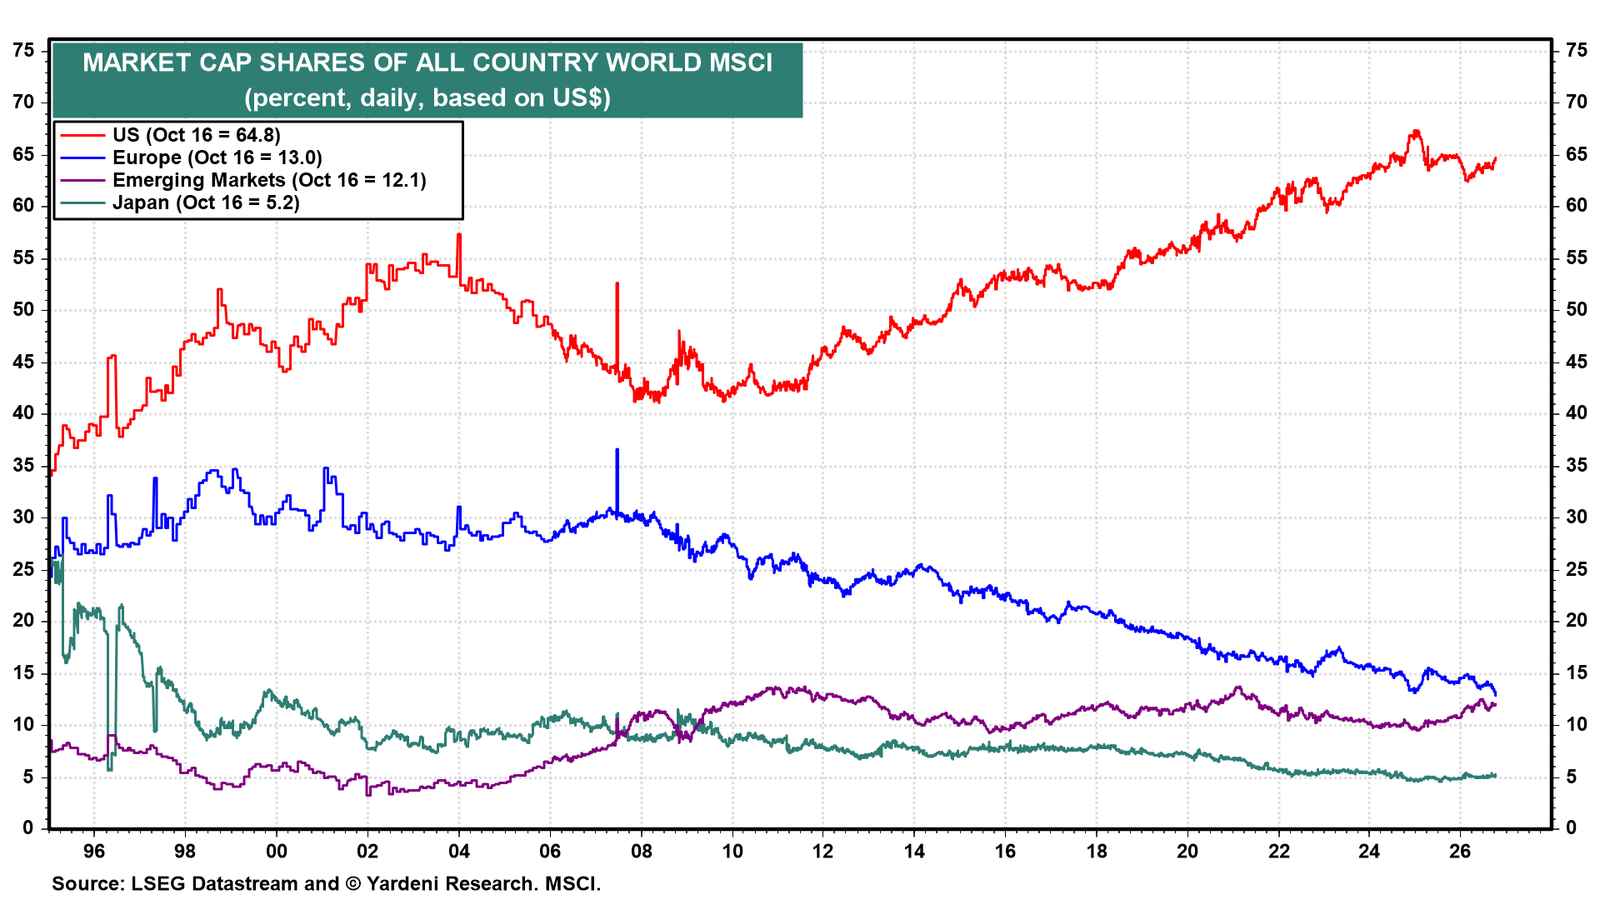
Europe's share of the All Country World MSCI's market cap has fallen to 13.0%, from as high as 30.8% in 2007 (chart). It looks set to keep losing ground for a while. The US MSCI’s share has firmed to 64.8%, up from 62.4% in March. The Emerging Markets MSCI’s share has held at 12.1% despite the Korean selloff.
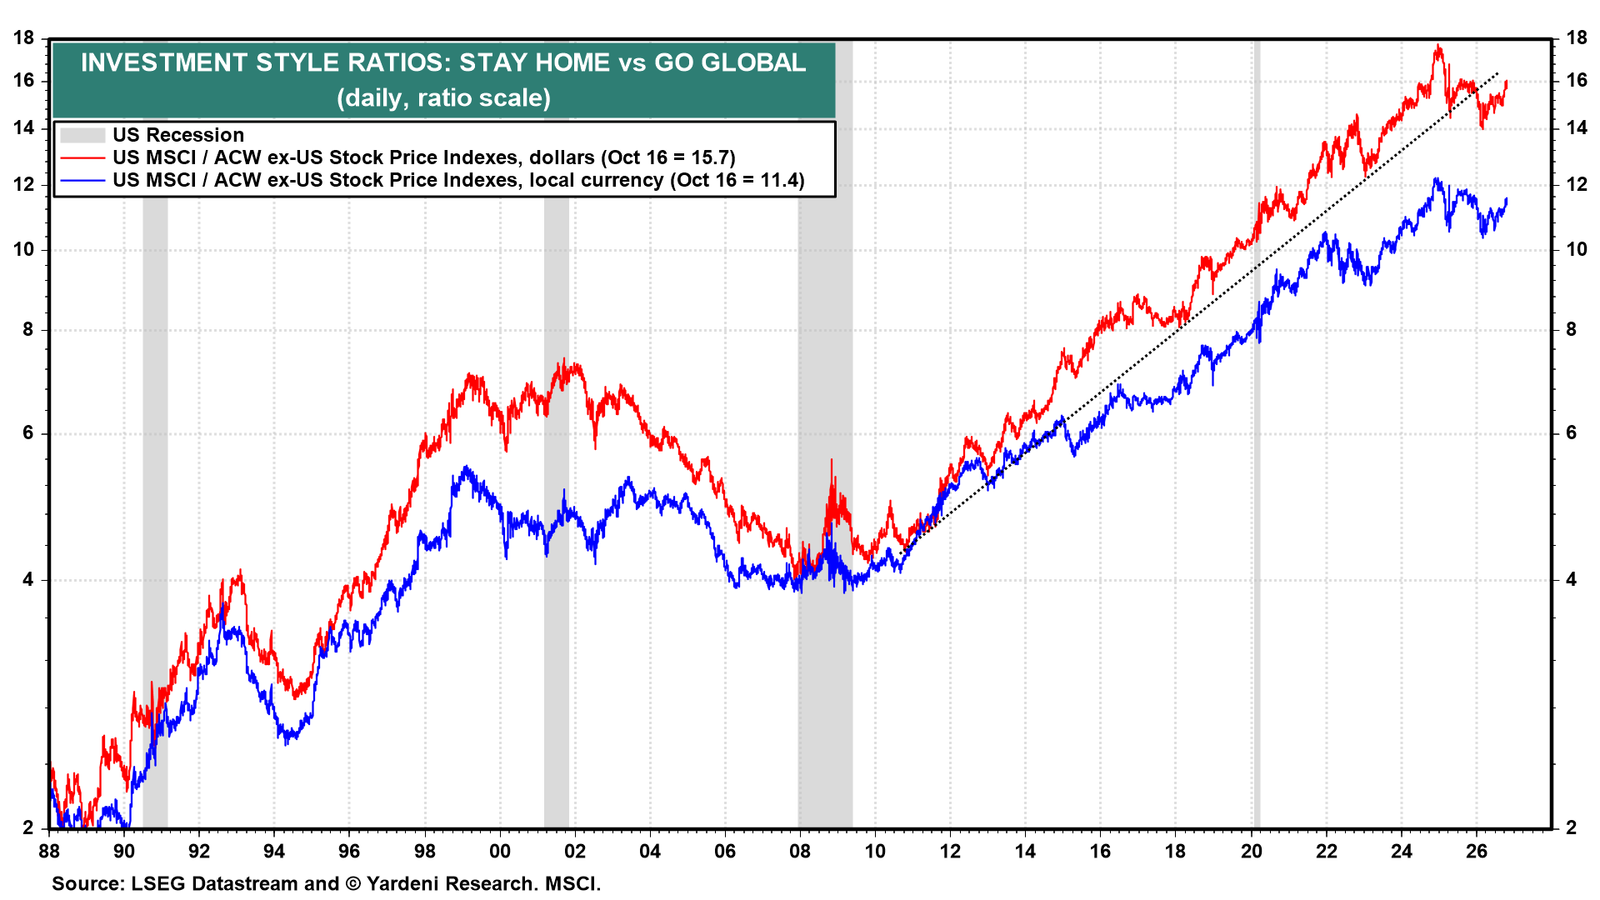
The ratio of the US MSCI to the All Country World ex-US MSCI has turned up in recent weeks (chart). It remains below its early-2025 high.
III. Earnings & Valuation
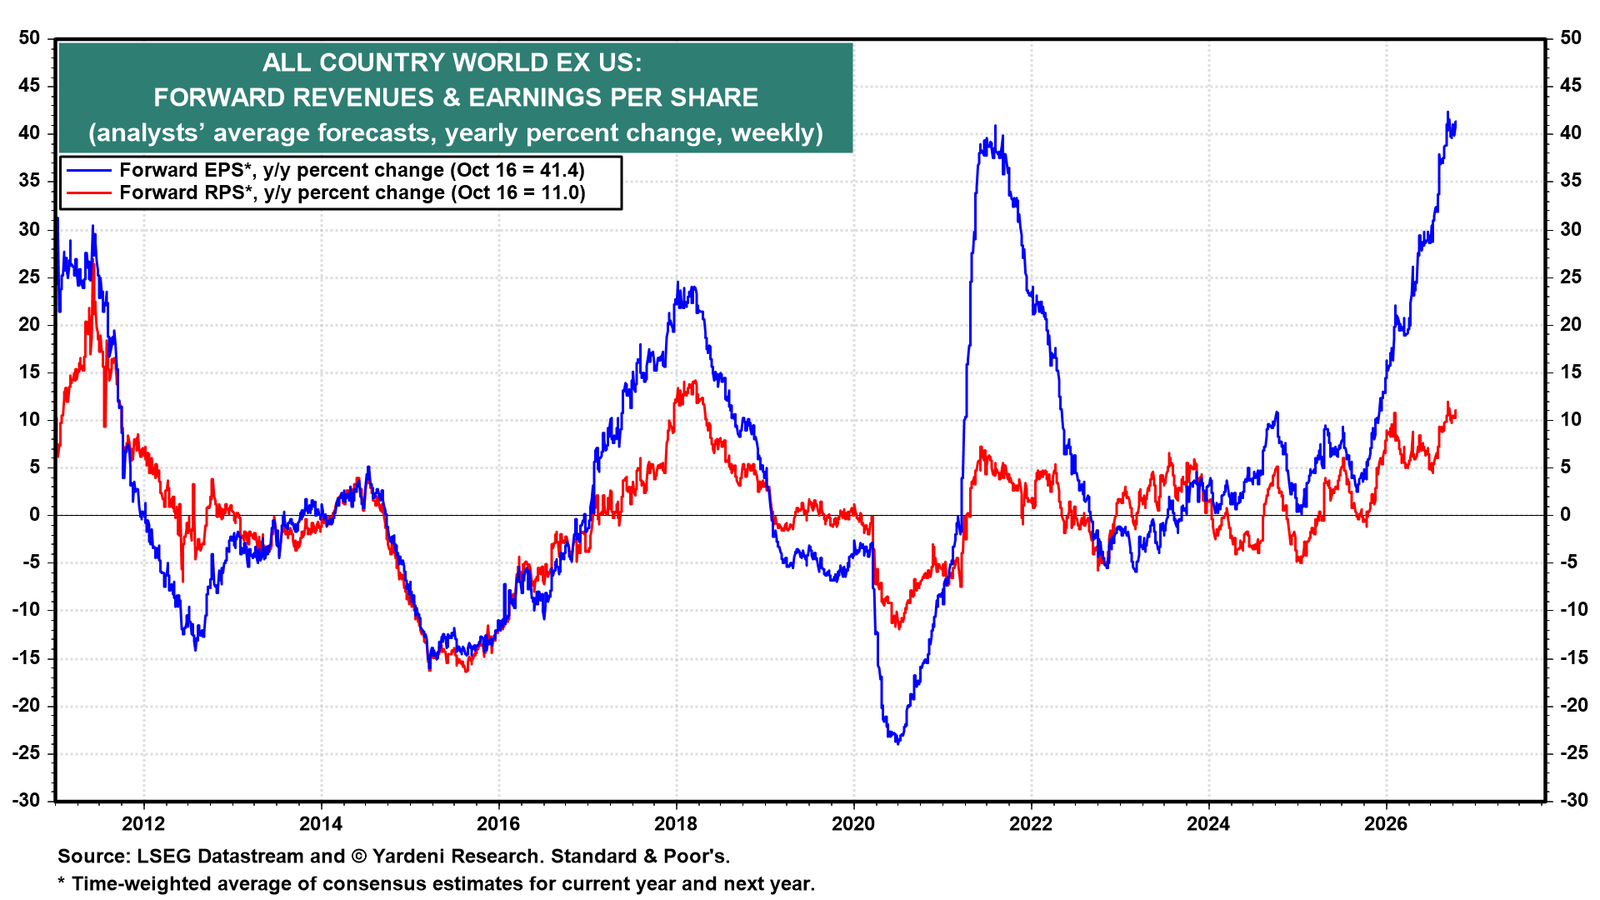
The All Country World ex US MSCI's forward earnings is up 41.4% y/y, while forward revenues is up 11.0% (chart). The global economy is doing well.
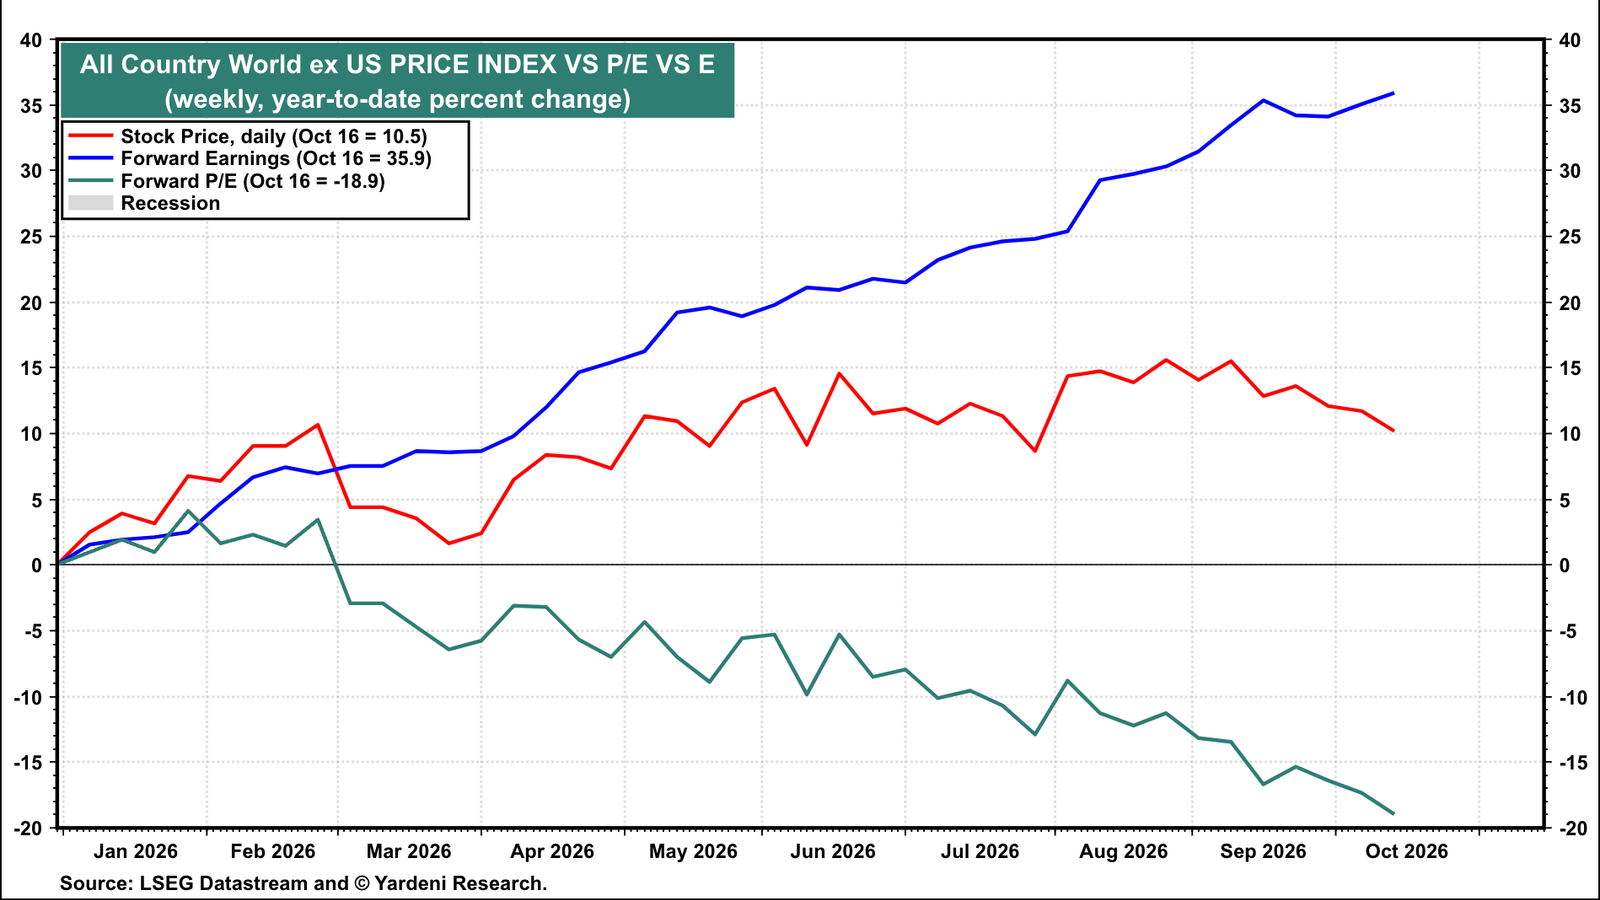
Overseas, earnings have far outpaced stock prices this year. The All Country World ex-US MSCI is up 10.5% ytd, while its forward earnings is up 35.9% (chart). Its forward P/E has dropped 18.9% ytd.
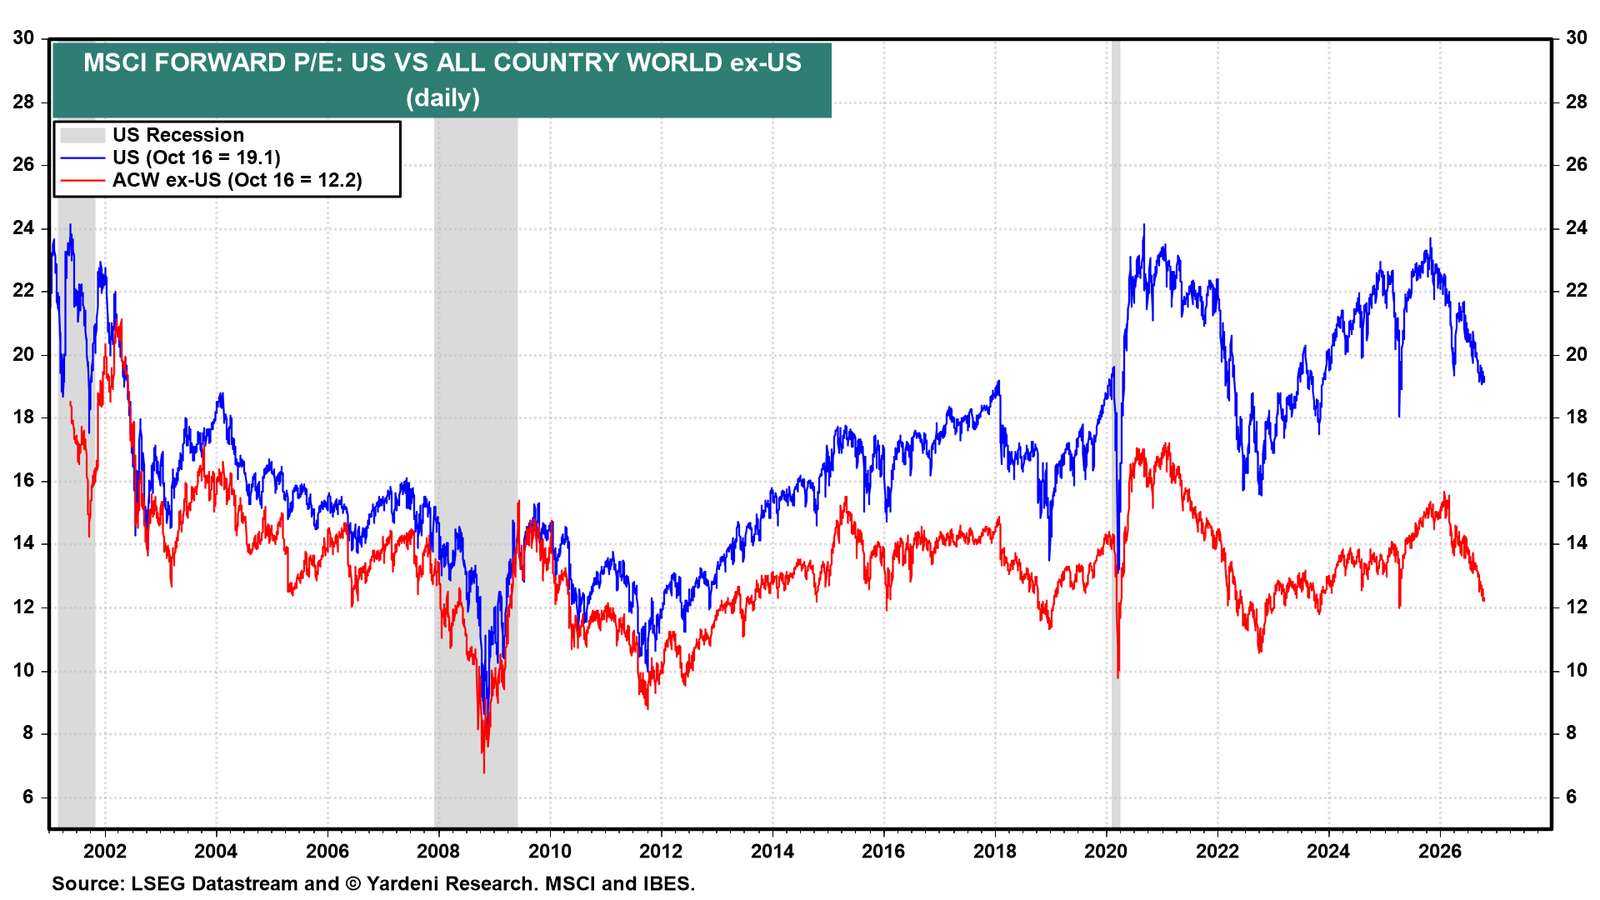
The US MSCI's forward P/E is 19.1 versus 12.2 for the All Country World ex-US, a 57% premium (chart). US profit margins justify about half of it. The US forward profit margin is 16.8%, about a third higher than the All Country World ex-US's 12.7%.
IV. China Focus
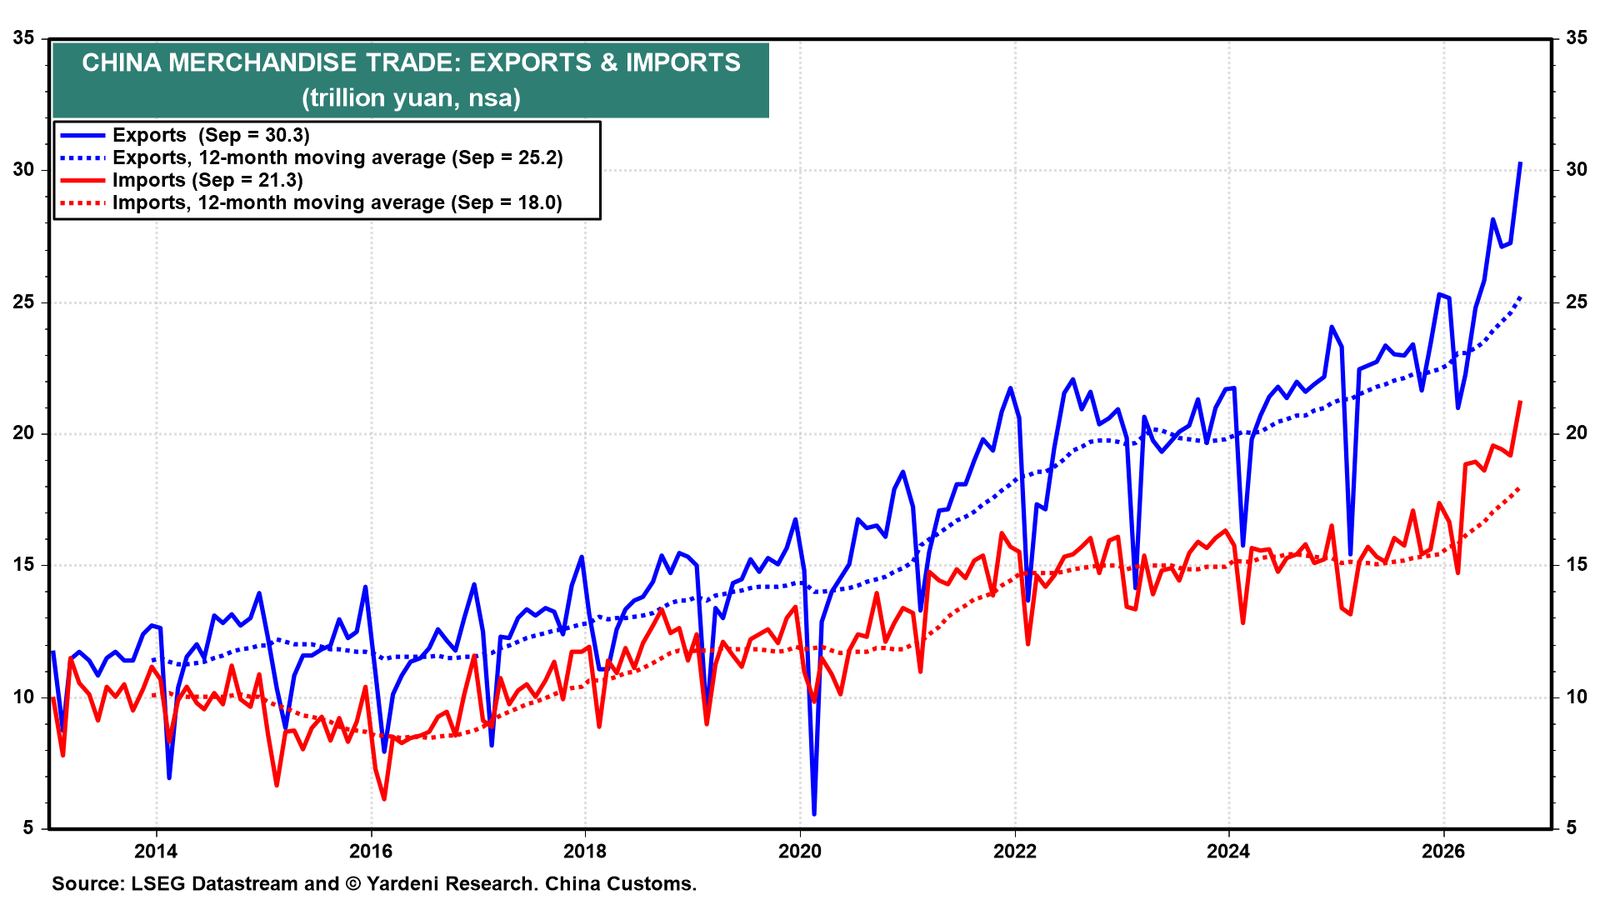
China remains a source of deflation for the global economy through its massive trade surplus. Exports jumped 36.3% y/y in September to a record high (chart). The trade surplus was $133.5 billion. Semiconductor exports more than doubled during the first nine months of the year. Booming exports are the only reason China's economy isn't imploding.
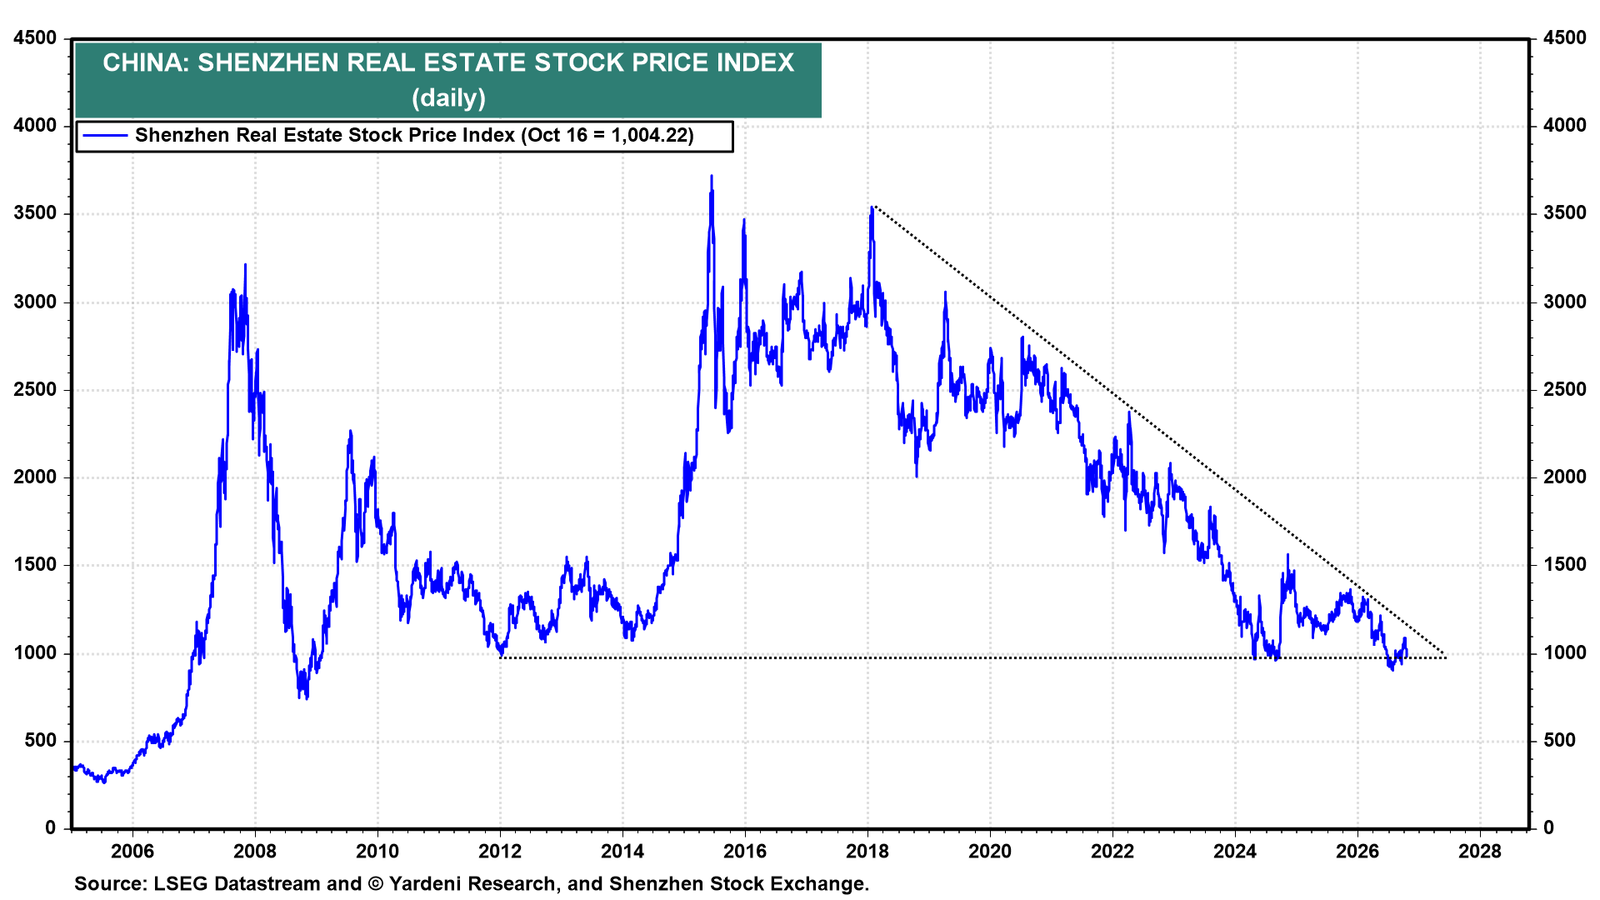
The domestic economy remains weak, weighed down by a rapidly aging population and a property debacle. The Shenzhen Real Estate Stock Price Index is testing a floor that has held since 2012 (chart). We would worry if it broke below that level.
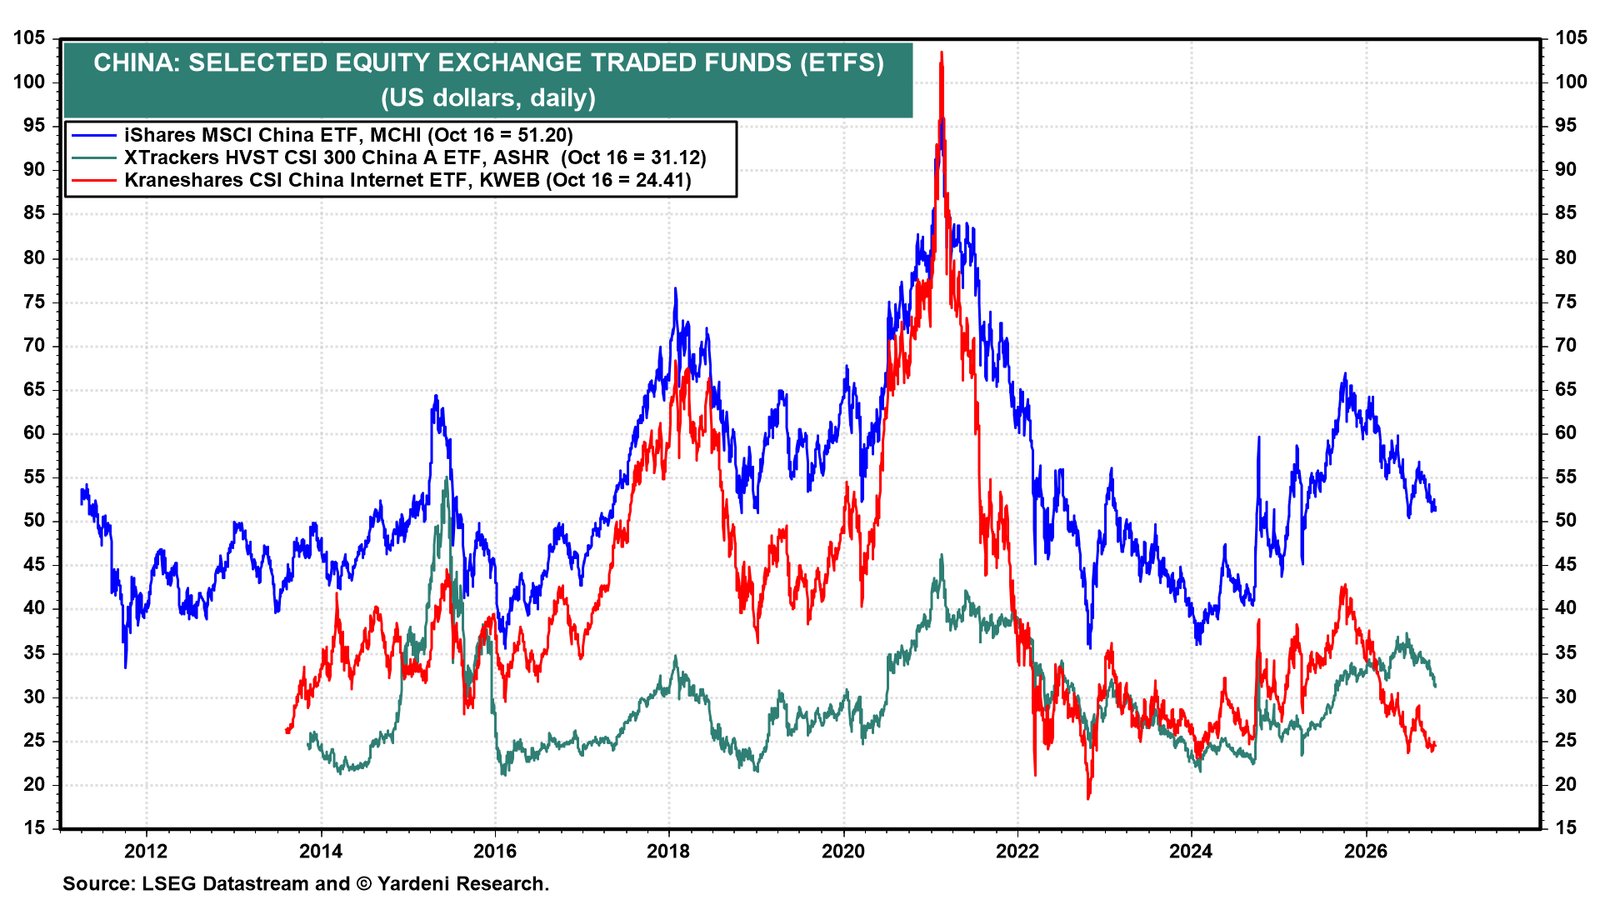
The stock market hasn't benefited from the export boom either, so Beijing appears to be propping it up again. Regulators met on Thursday to discuss stabilization measures, according to Bloomberg. They reportedly urged companies and state funds to buy shares and asked some investors to curb selling. Mainland A-shares, where Beijing's state-backed funds do most of their buying, held up into mid-2026 before turning down (chart). Offshore Chinese stocks have been falling since late 2025.