I. Treasury Yields
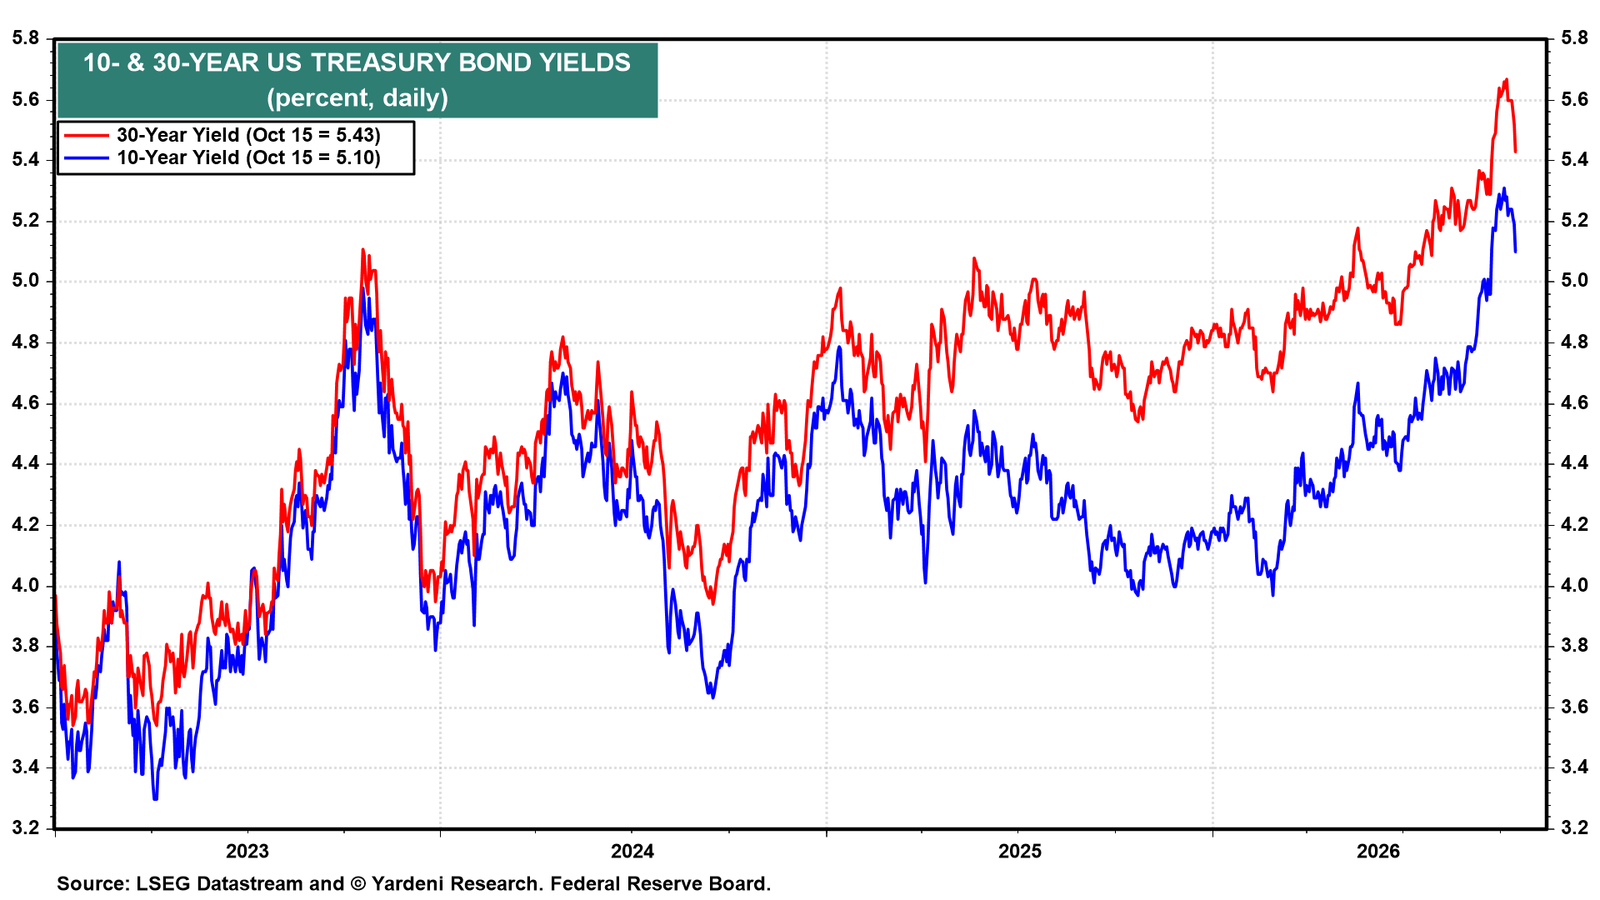
US Treasury yields fell sharply today, extending Wednesday's retreat from intraday highs. The 10-year yield dropped 9bps to 5.10%, while the 30-year fell 10bps to 5.43% (chart).
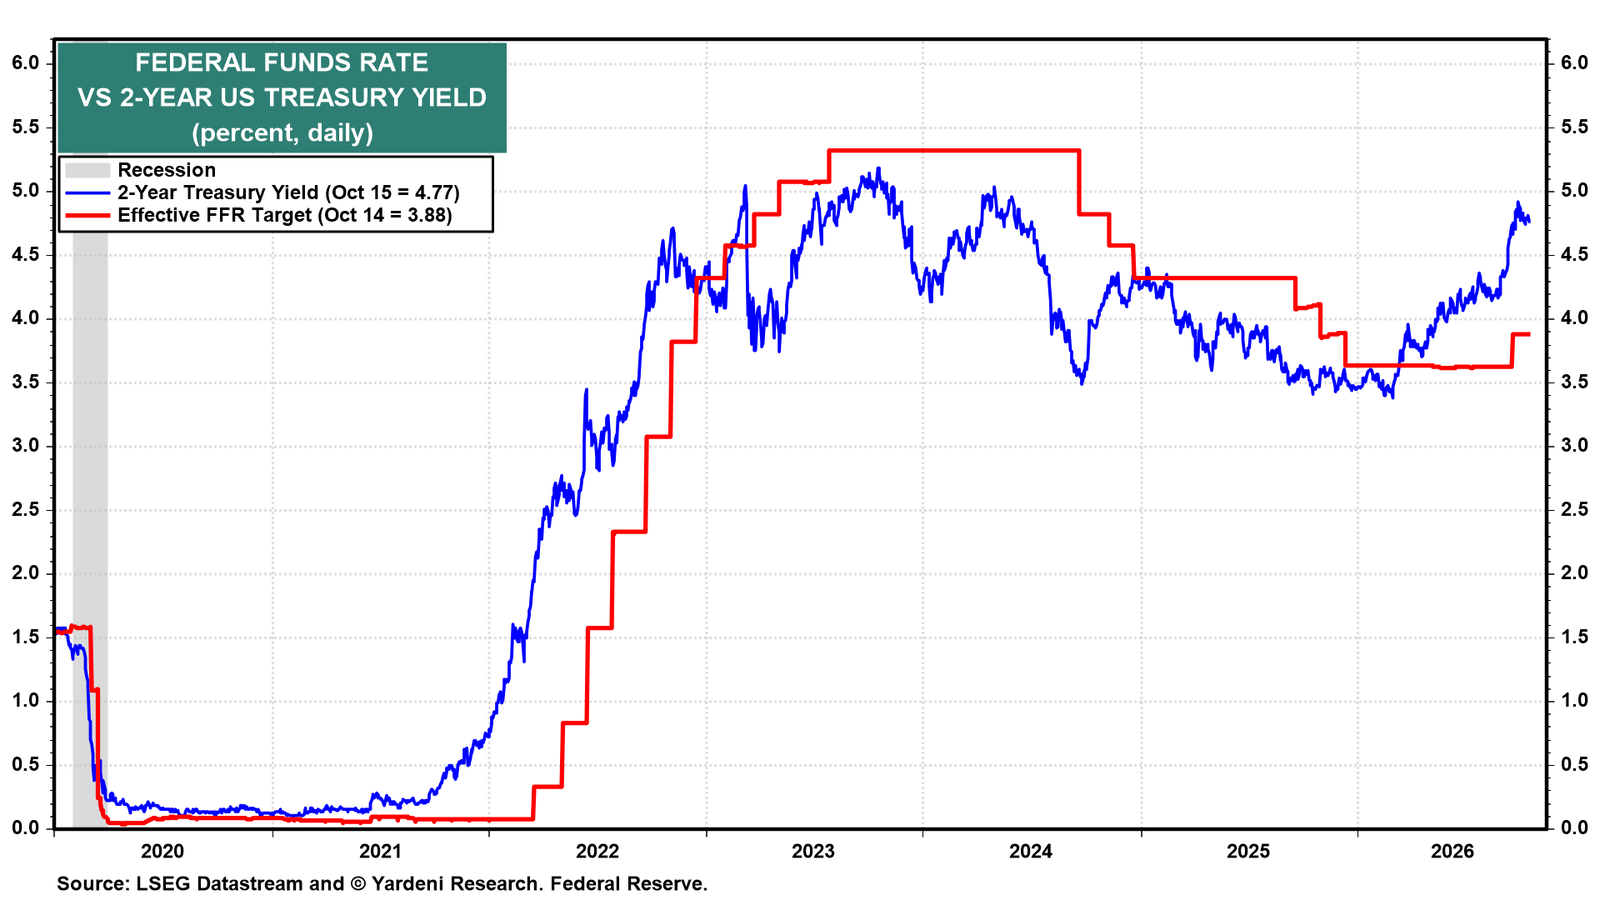
Even the 2-year yield declined slightly to 4.77% (chart).
Remarkably, this broad-based decline occurred despite two hotter-than-expected inflation reports. Normally, such surprises would push Treasury yields higher as investors priced in a more hawkish Fed.
So, what's going on? We think the bond market is focusing on the sustainability of the AI investment boom. That issue came to the fore this week as CoreWeave's bonds plunged below 80 cents on the dollar and debt financing major data center projects also tumbled. A new Gartner report estimates AI data center operators will need $8.5 trillion in revenues through 2030 to cover costs and earn healthy returns, versus projected revenues of "just" $3.6 trillion.
Why does this matter? The AI buildout has become a major engine of US economic growth. But doubts about future returns are pushing up borrowing costs, potentially constraining access to capital and ultimately slowing investment spending.
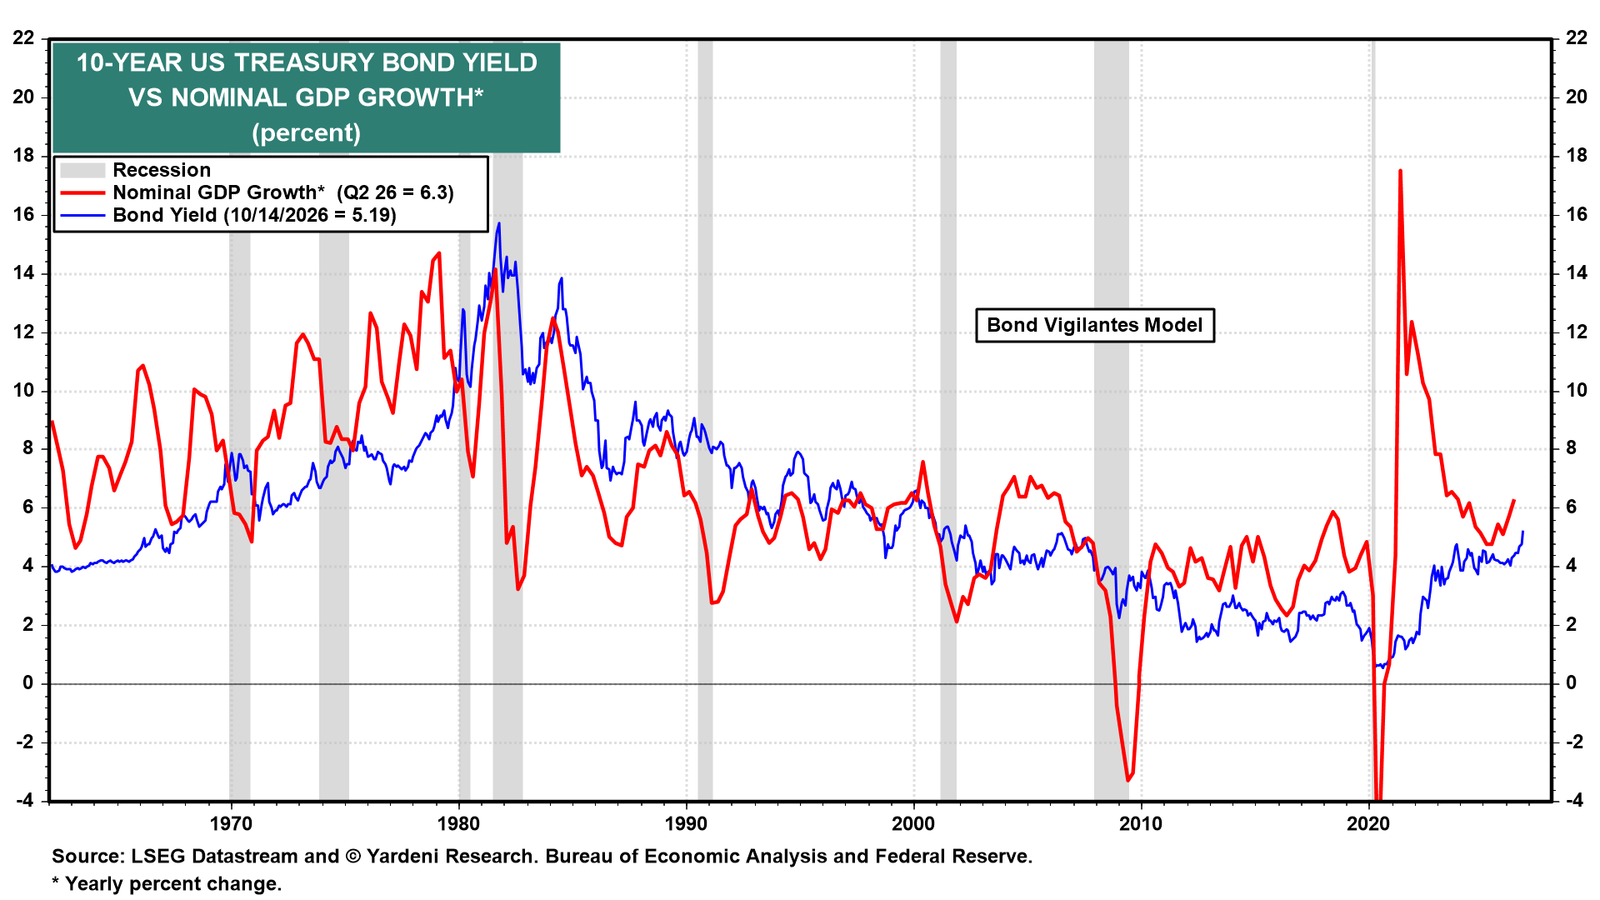
As a result, investors may be lowering their economic growth expectations amid concerns that the AI boom could slow, pushing Treasury yields lower. This reinforces our longstanding view that the earlier surge in Treasury yields largely reflected stronger-than-expected nominal GDP growth (chart).
We are nowhere near ready to write off the AI investment boom. Demand for compute continues to outpace supply, while rising adoption should fuel further investment. Indeed, just five hyperscalers (Amazon, Alphabet, Meta, Microsoft, and Oracle) are expected to spend a combined $892 billion this year and $1.1 trillion next year. Their strong balance sheets and cash flow generation make their spending plans relatively insensitive to higher borrowing costs. While heavily indebted AI infrastructure providers may struggle, we expect the hyperscalers to keep spending and the Roaring 2020s to keep roaring.
II. Inflation
Let's take a closer look at September's hotter-than-expected PPI report and what it tells us about inflationary pressures in the pipeline.
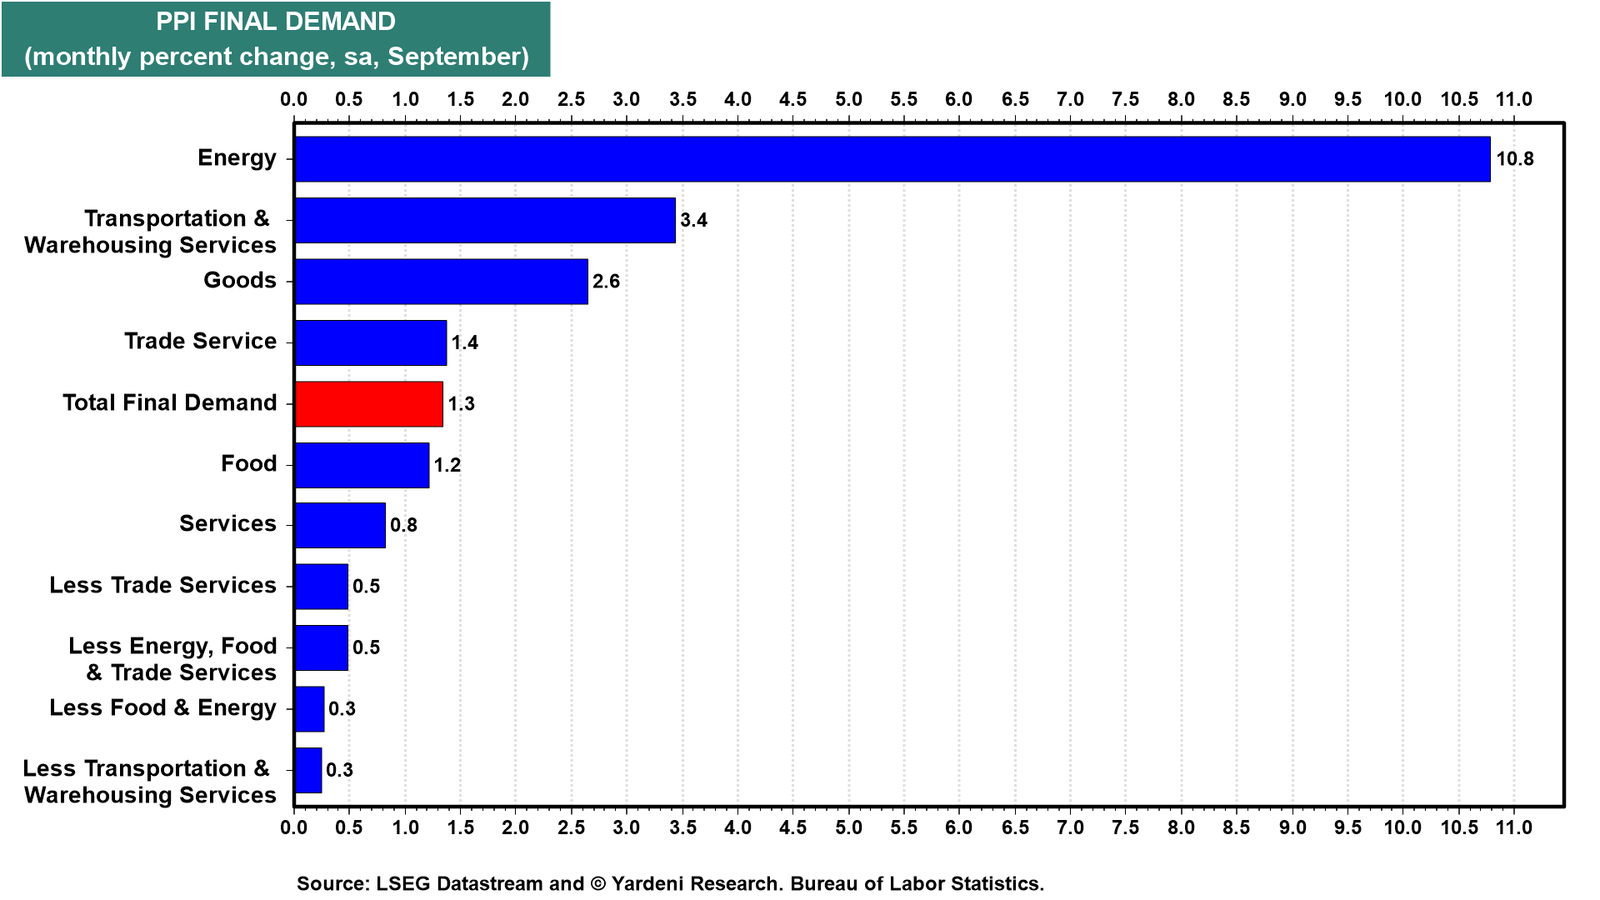
(1) PPI for final demand. September's PPI final demand surged 1.3% m/m, largely reflecting a 10.8% spike in energy prices. However, even excluding the volatile food, energy, and trade services components, producer prices still rose 0.5%, suggesting that inflationary pressures remain broad-based.
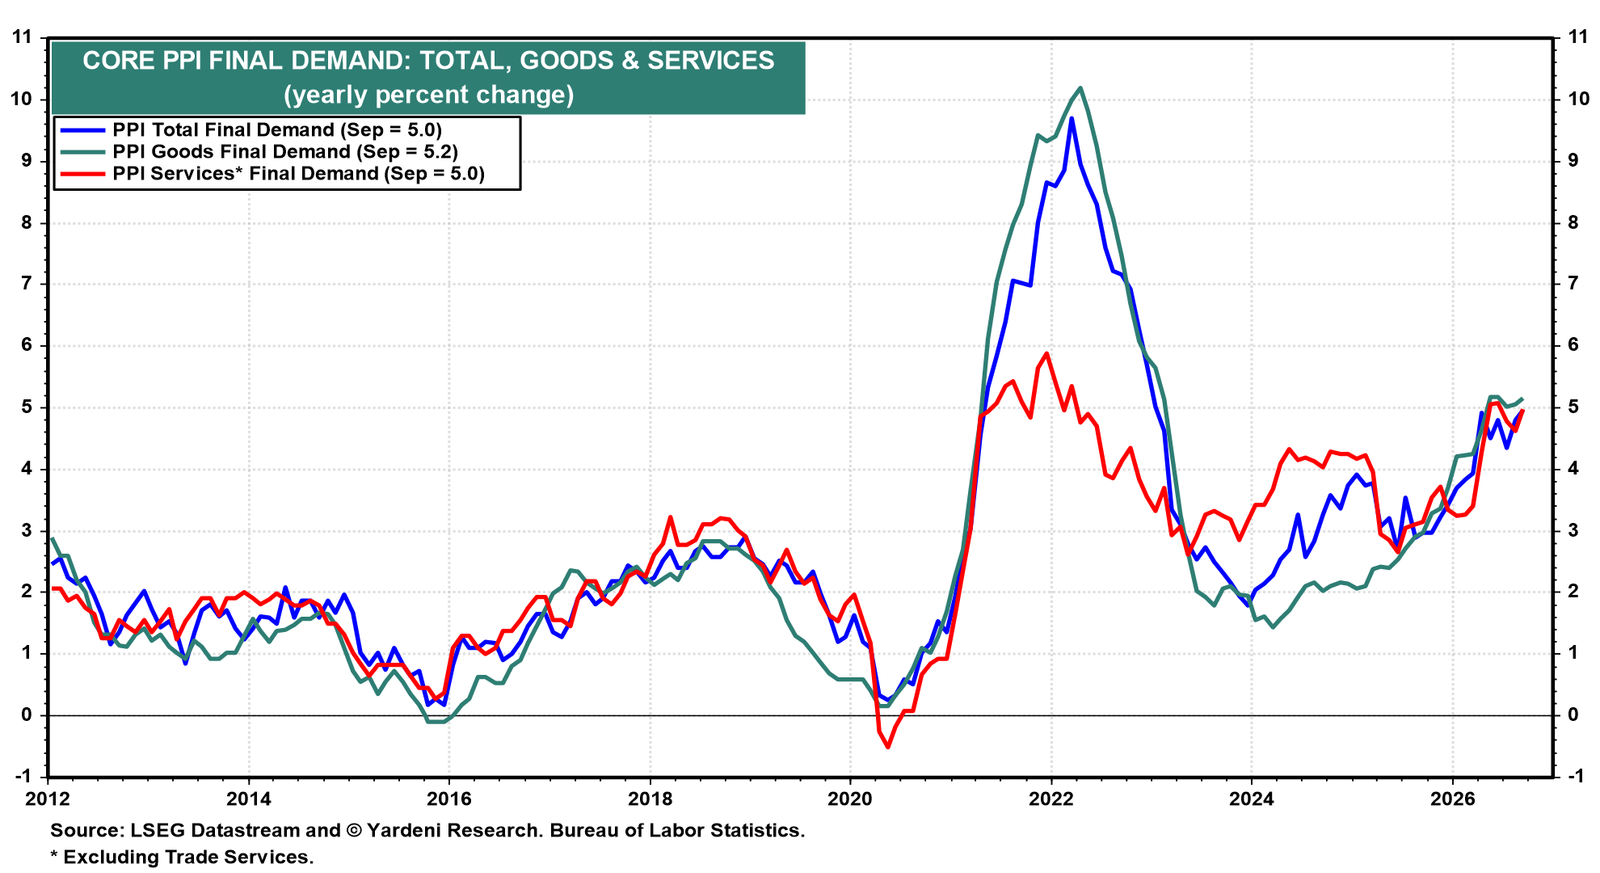
On a y/y basis, core PPI final demand rose to 5.0%, with services and goods prices rising 5.0% and 5.2%, respectively (chart).
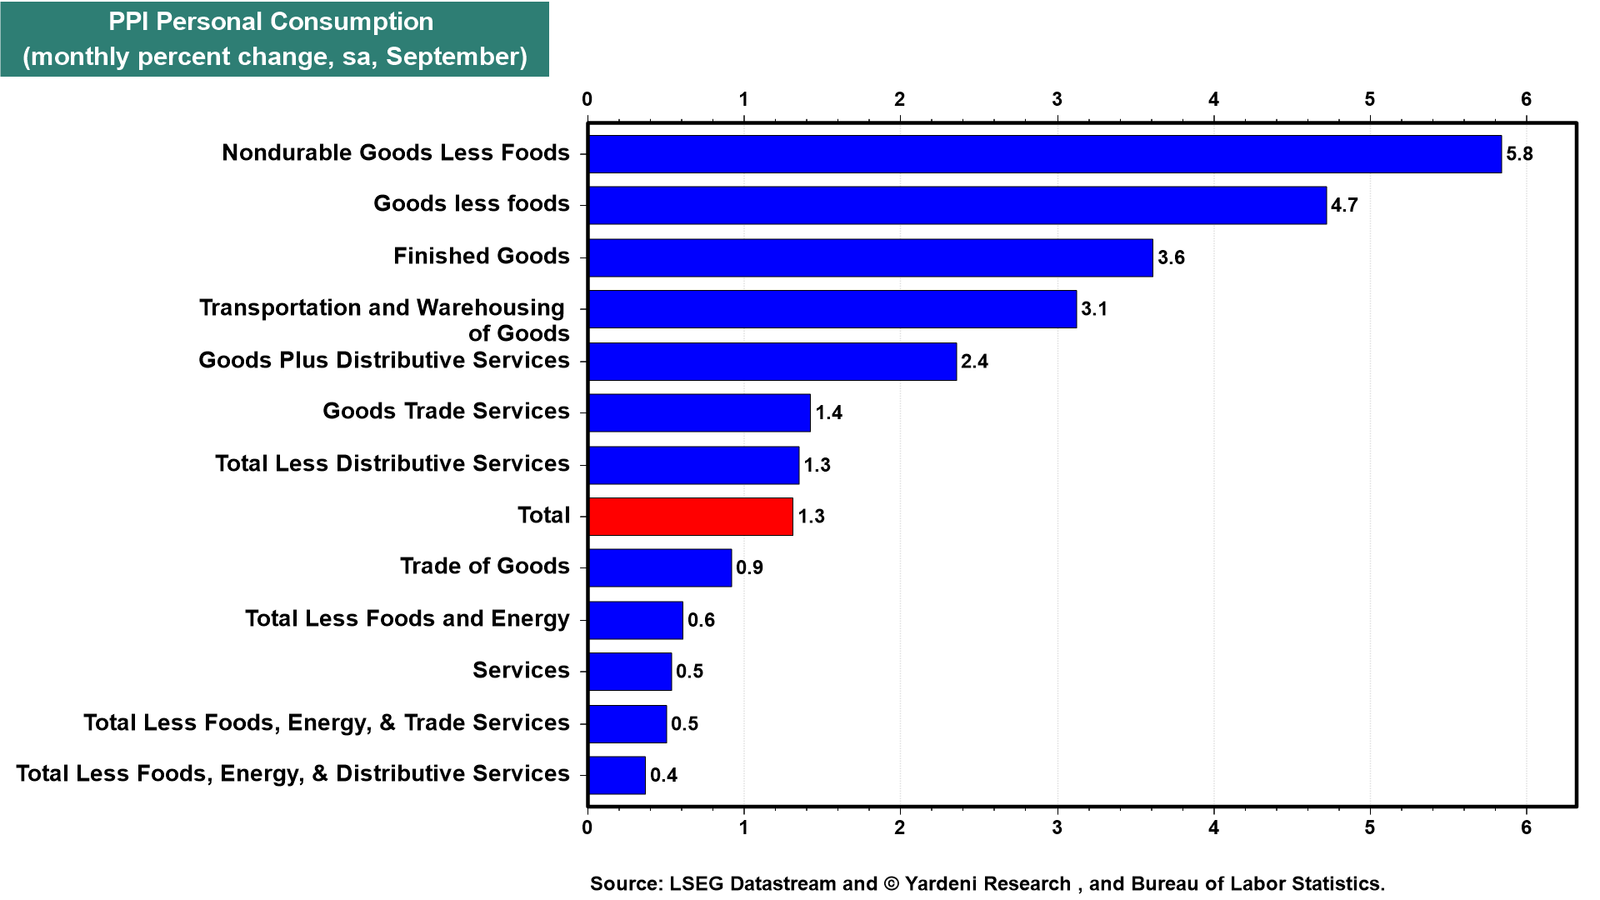
(2) PPI for consumption. The PPI for personal consumption, a key input into the Fed’s preferred PCED inflation gauge, surged by 1.3% m/m in September (chart). Excluding food and energy, it was up 0.6%.
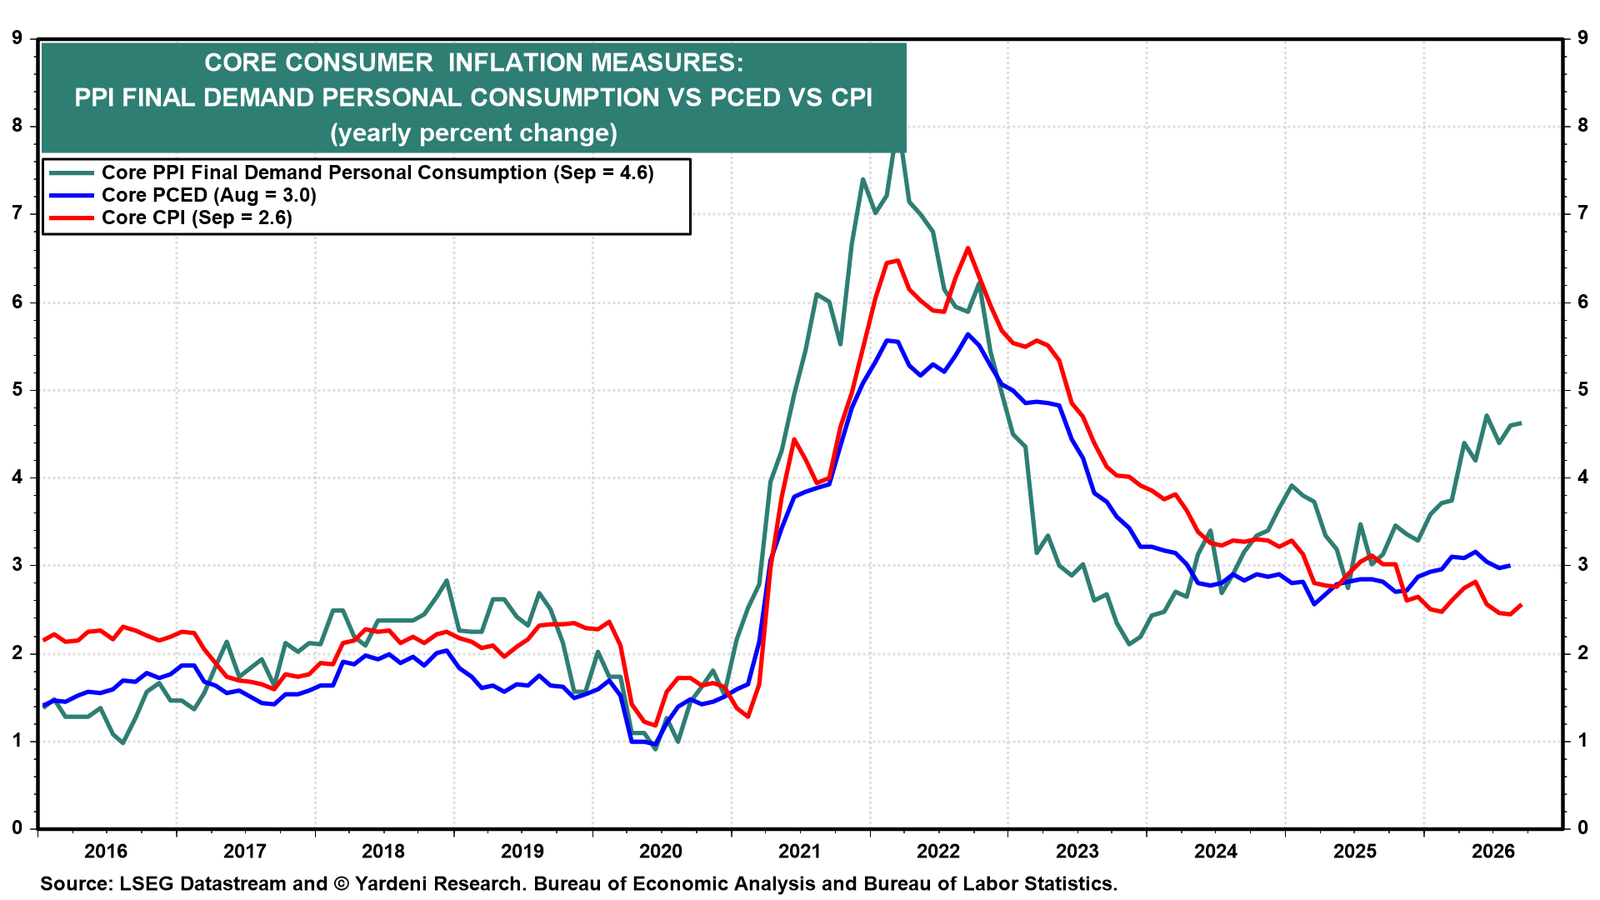
Core PPI personal consumption rose to 4.6% y/y and remained well above both core PCED and core CPI inflation, suggesting that upside risks to consumer inflation remain elevated (chart).
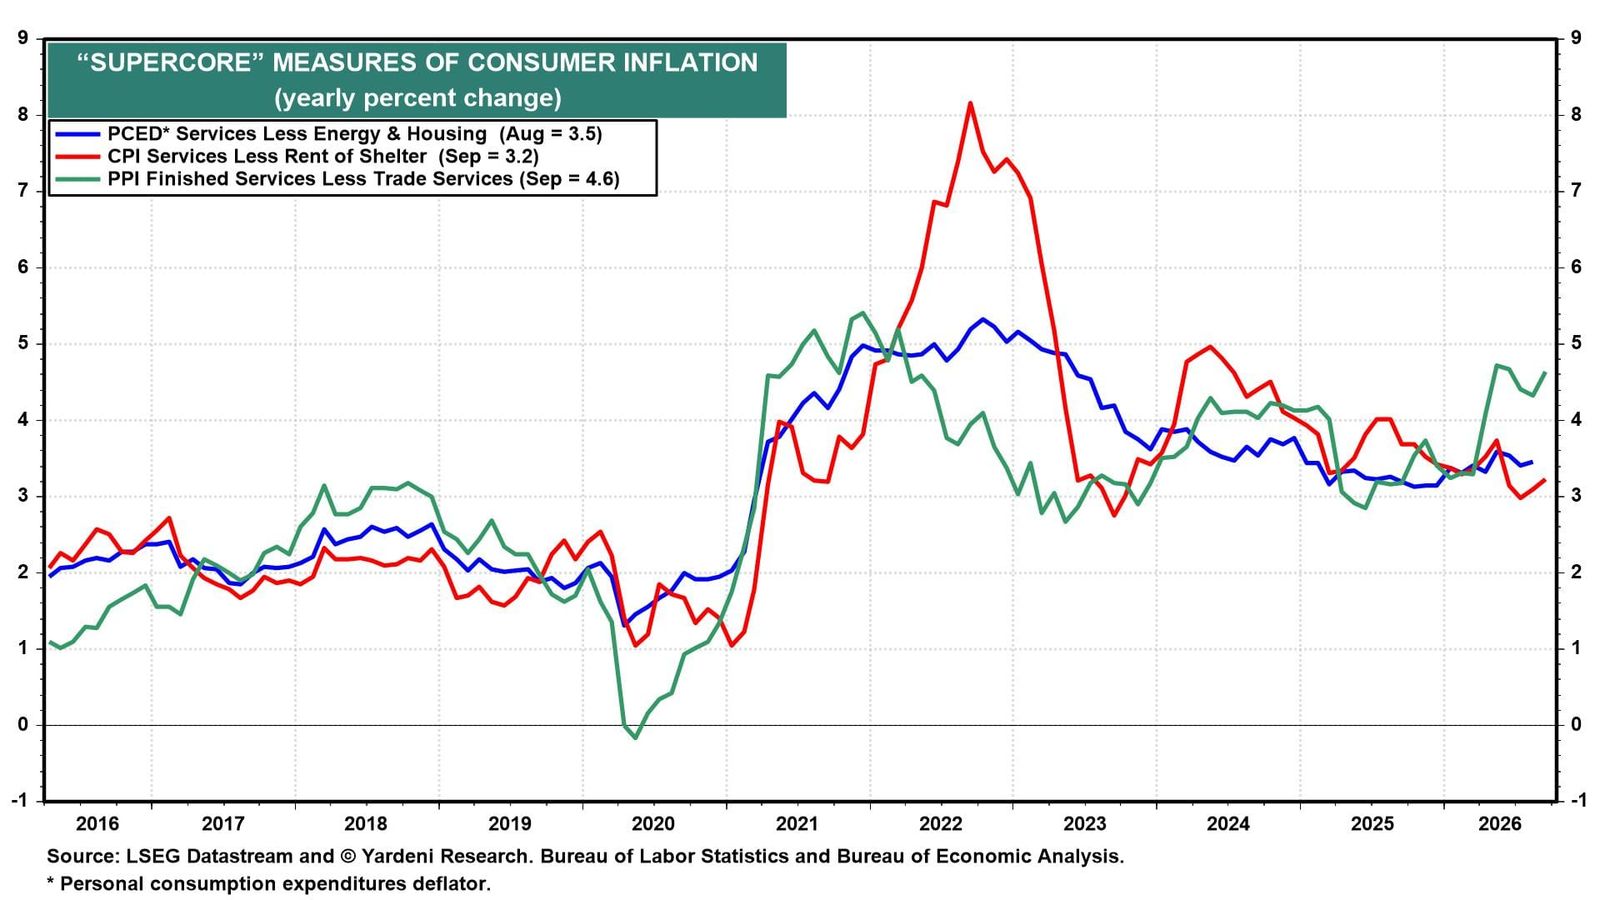
(3) Supercore inflation. The PPI supercore inflation rate rose to 4.6% y/y in September (chart).
(4) Core PCED. With September CPI and PPI now in hand, most forecasters expect core PCED inflation to rise 0.3% m/m in September, which would lift the y/y rate from 3.0% to 3.1%. The Cleveland Fed’s Inflation Nowcasting model projects 0.28% m/m and 3.05% y/y, respectively.
III. Booming Economy
For now, the US economy shows no signs of slowing down. Consider the latest data points:
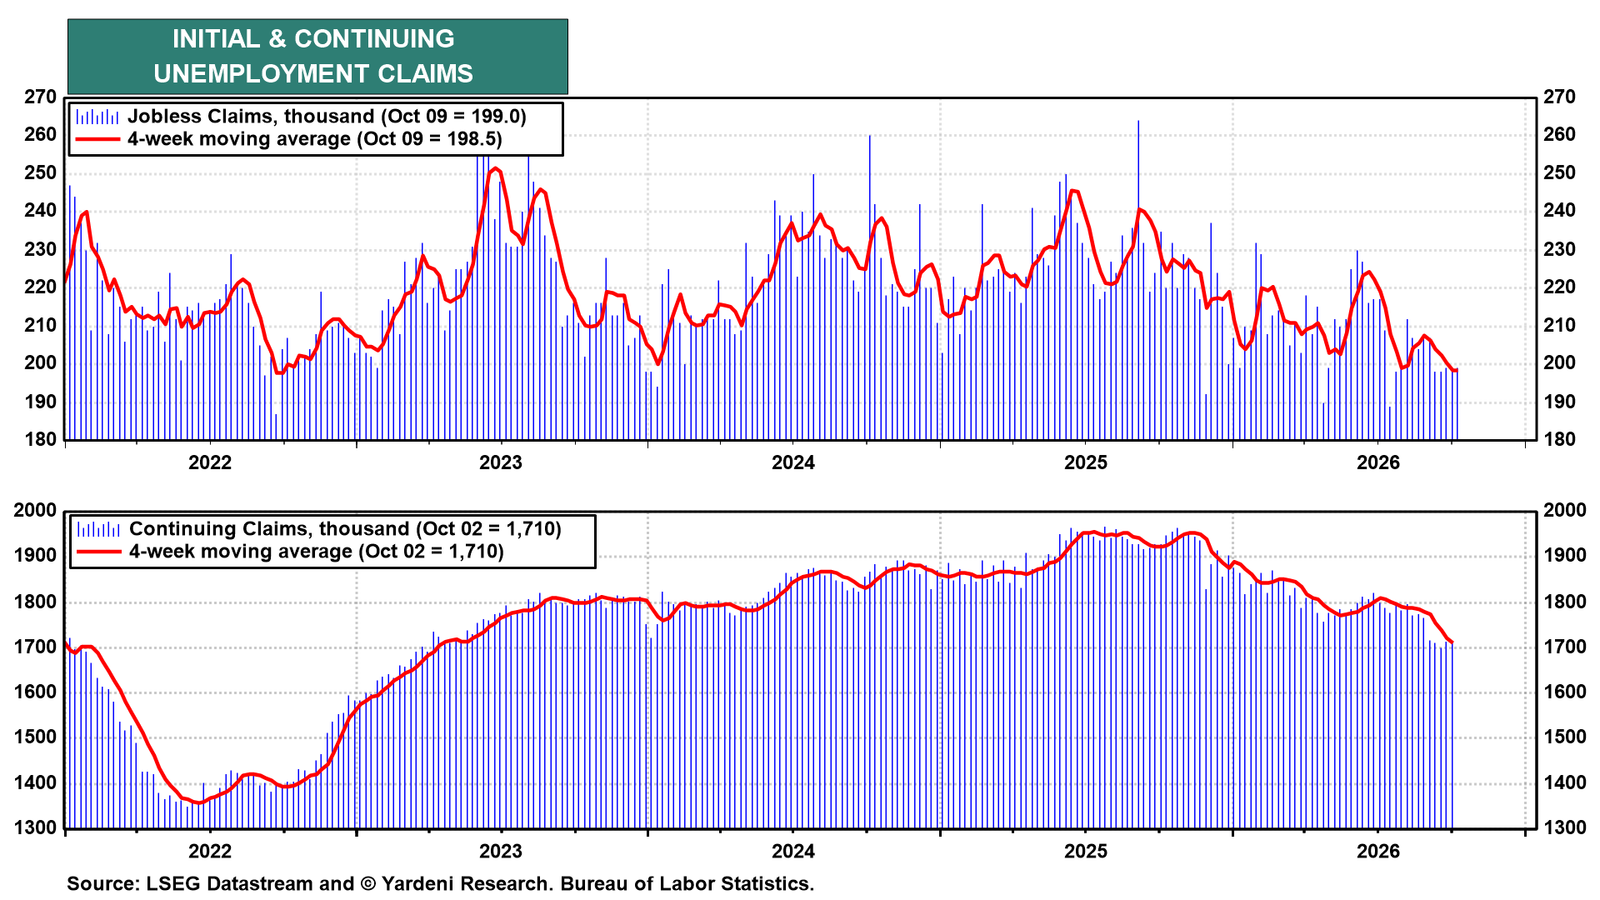
(1) Jobless claims. Initial jobless claims edged up slightly to 199,000 in the week ended October 10, the fifth straight week below 200,000. That is the longest streak since 1969! Continuing claims declined to 1.71 million, dragging down the 4-week moving average to the lowest level since April 2023 (chart).
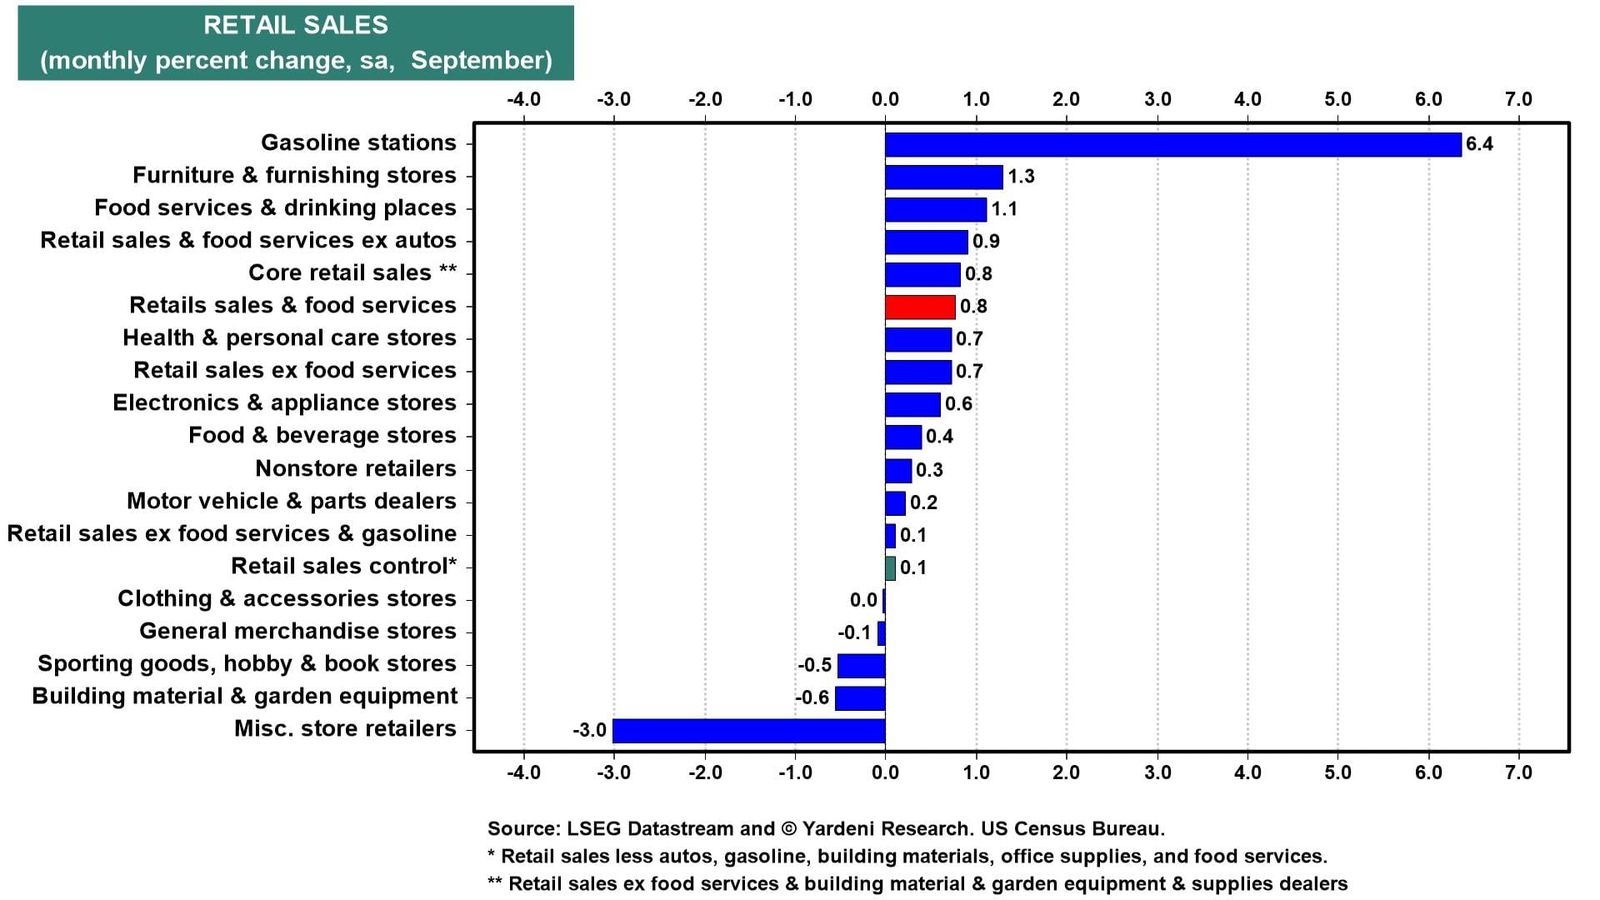
(2) Retail sales. September retail sales rose 0.8% m/m, partly driven by a 6.4% surge in gasoline station sales amid elevated pump prices (chart). Still, eight of the 13 major categories posted gains. Sales at food services and drinking places, the only services category and a key discretionary spending indicator, jumped 1.1% m/m, their eighth consecutive monthly gain. They rose 7.0% y/y, the strongest increase since March 2023.
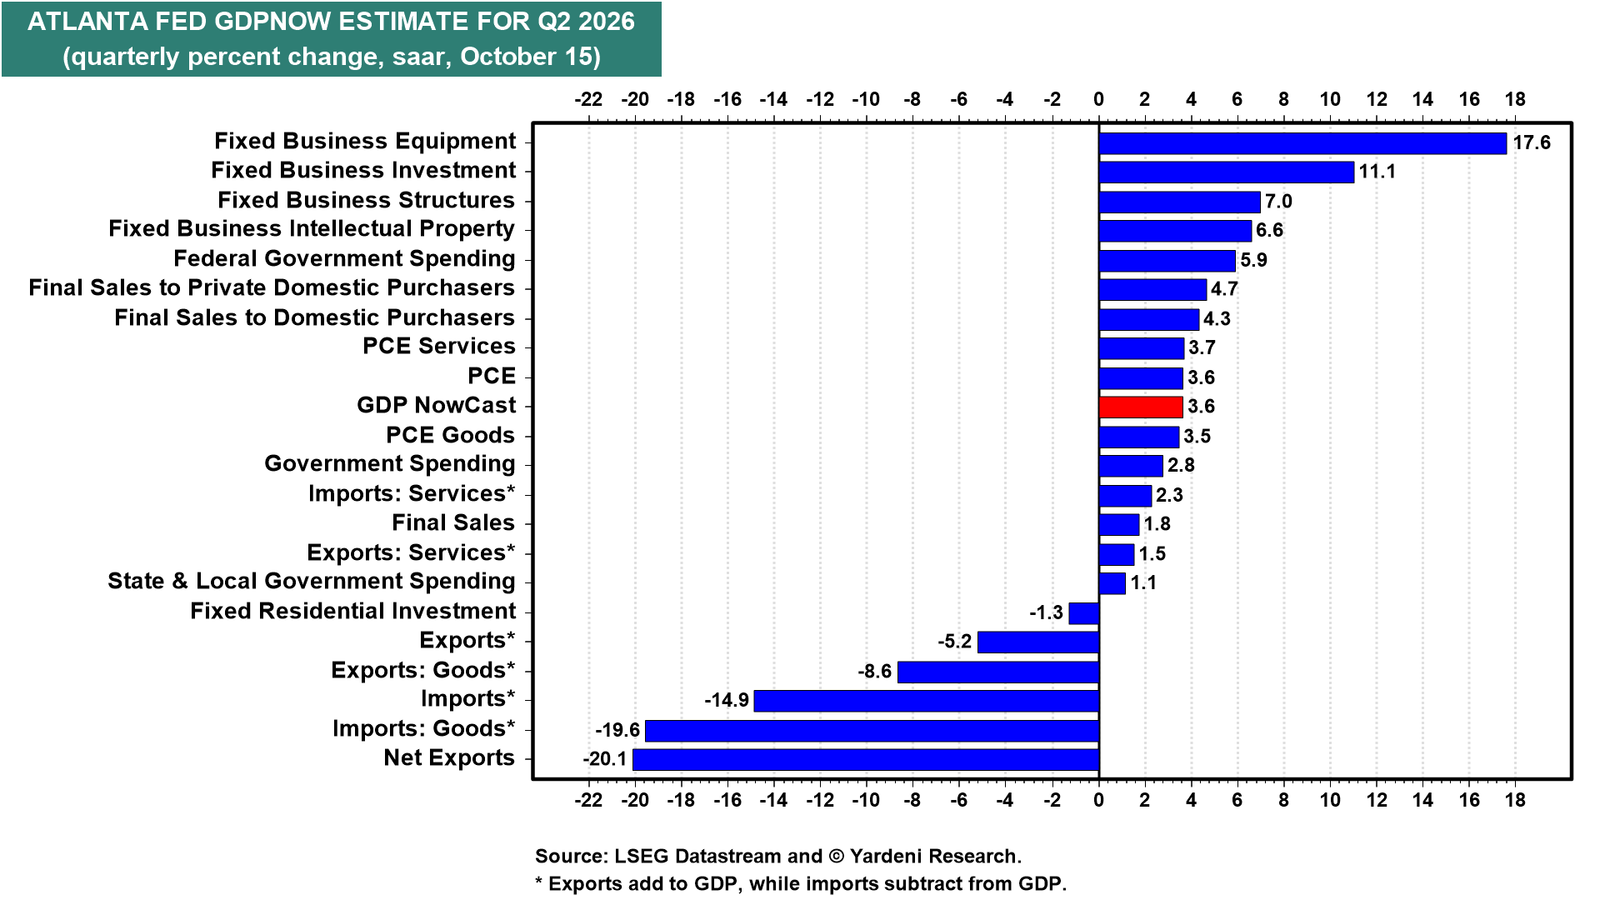
(3) GDP. Reflecting today's retail sales report, the Atlanta Fed’s GDPNow model estimates Q3 real GDP growth at 3.6% (saar), unchanged from October 8 (chart). Consumer spending is projected to rise 3.6%. AI-related demand is boosting business equipment investment (17.6%), fixed business structures (7.0%), and intellectual property investment (6.6%). Final sales to private domestic purchasers are expected to grow 4.7%.