I. Bonds
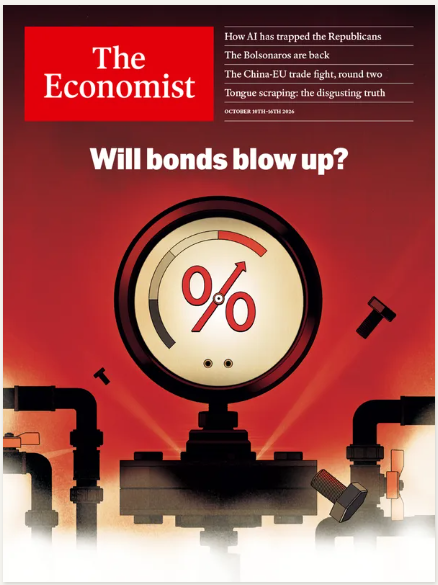
The Economist just rang the all-clear siren for the bond market (chart). It is safe to buy bonds now that the front cover of the October 10 magazine is titled "Will bonds blow up?" This and other national magazines’ cover stories often have been great contrary indicators. It’s the “front-page curse” (once magazines put in the time it takes them to produce a cover article on a financial market trend, investors have moved on).
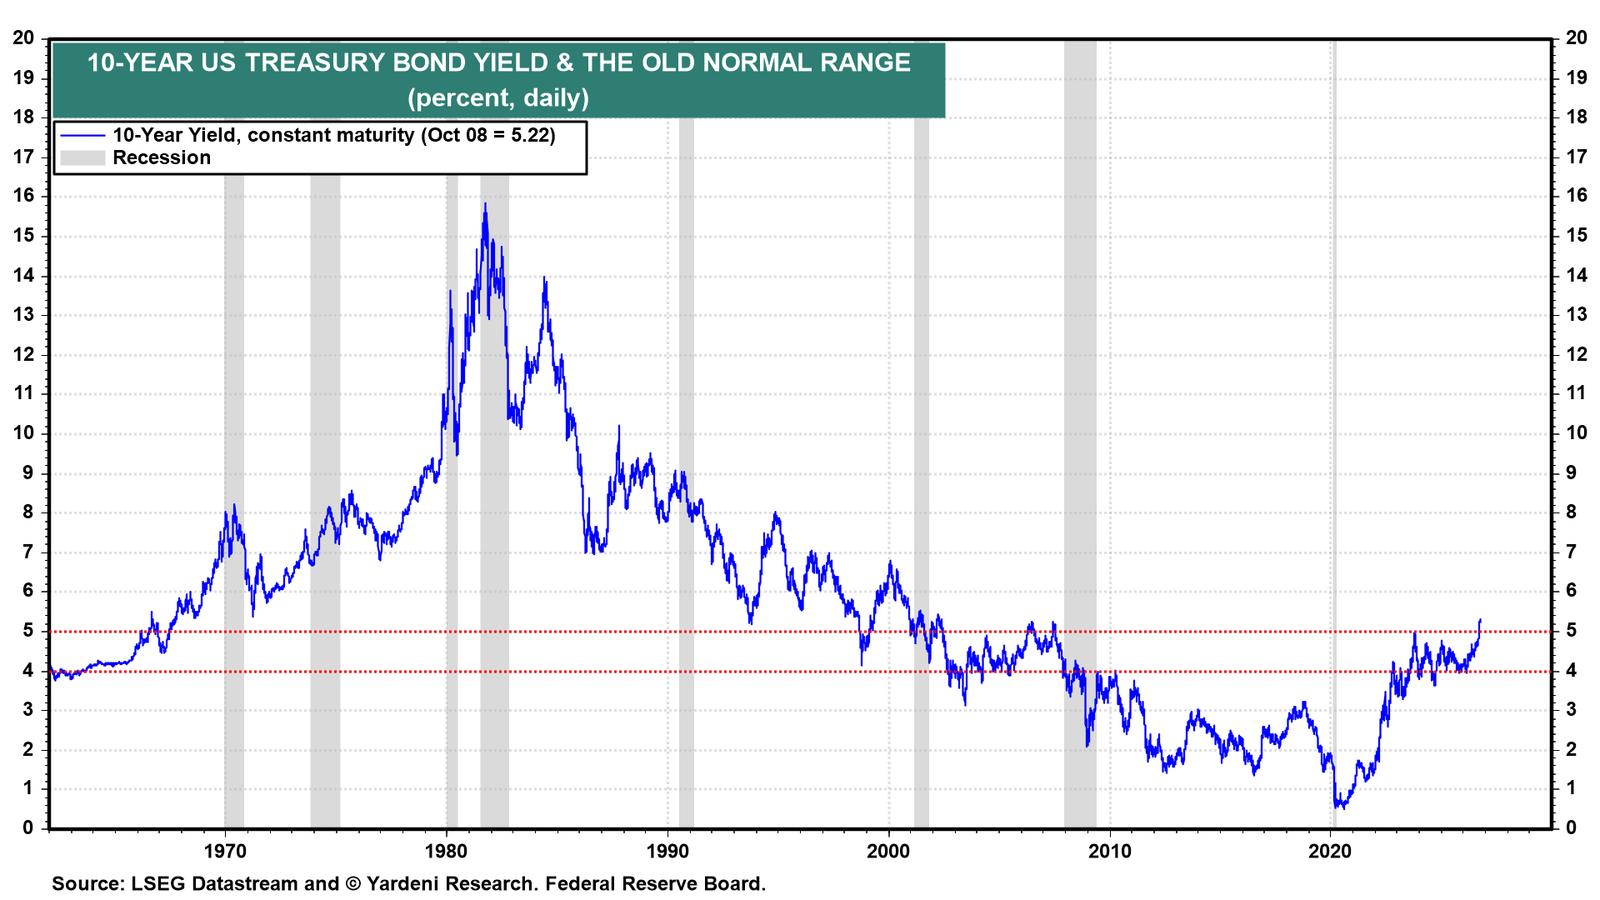
We think the 10-year Treasury bond yield is back to normal this year, i.e., in the 4.00% to 5.00% range (chart). We've disputed the widespread notion that "interest rates are likely to remain higher for longer." That implies that they should come back down at some point. We've argued that "interest rates are likely to stay normal for longer." They were abnormally low between the Great Financial Crisis and the Great Virus Crisis, when central banks rigged the fixed-income markets with zero and near-zero interest-rate policies and quantitative easing.
As bond yields rose in recent months to the top end of what we consider the normal range, we expected buyers to be attracted by higher yields, so we expected the range to be maintained (that’s what happened in in 2023, when the yield spiked to 5.00% in late October). This time, the yield spiked above the normal range, to around 5.25% (as it did during the 4.00%-5.00% normal-range period from 2002-07).
In recent conversations with several of our institutional accounts, many expressed interest in buying bonds at levels above 5.00%.
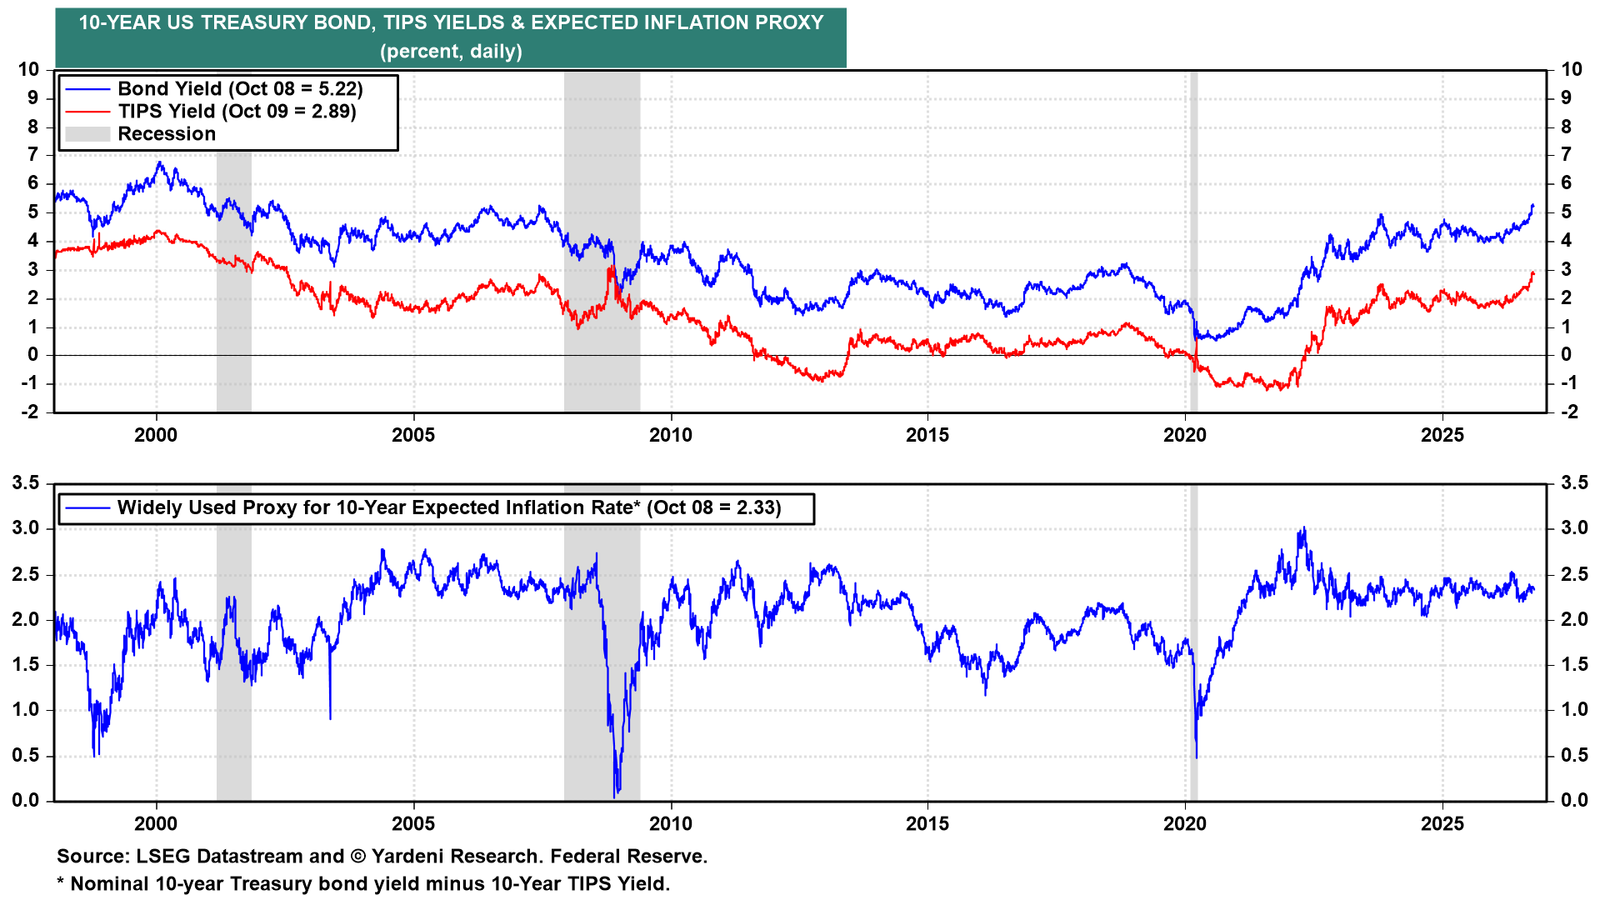
A slice-and-dice analysis of the 10-year yield shows that its rise this year has been almost entirely attributable to the rise in the comparable TIPS yield (chart). The spread, which is a proxy for inflation expectations over the next 10 years, has been range-bound roughly between 2.00% and 2.50% since 2023.
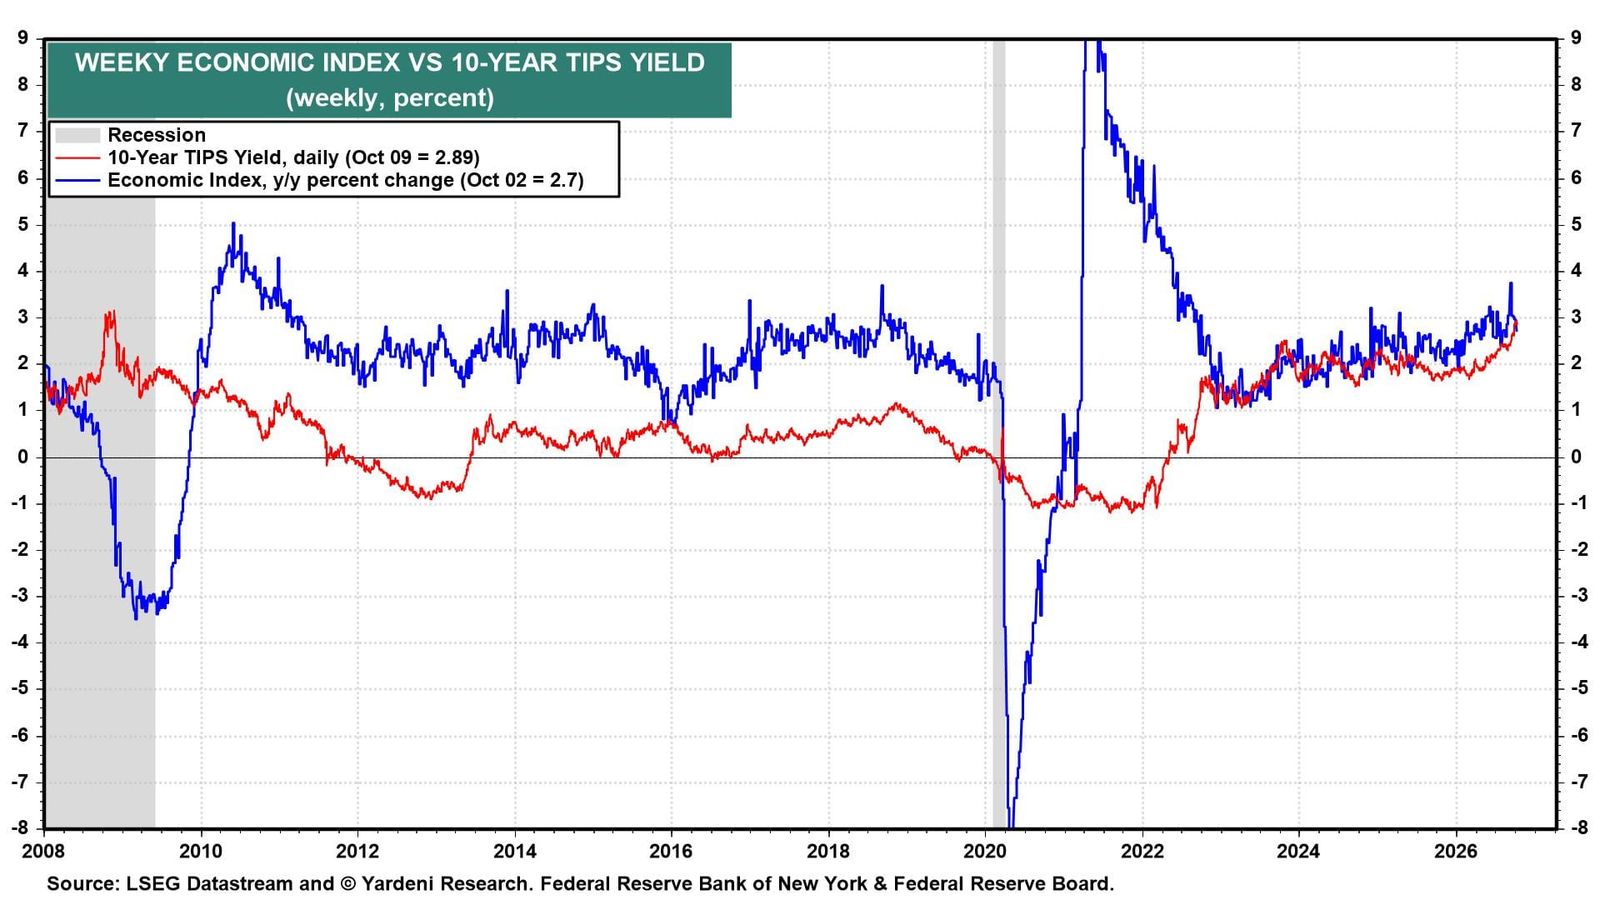
Since 2023, the TIPS yield has closely tracked the Weekly Economic Index, which tracks the growth rate in real GDP on a y/y basis (chart). This supports our view that the increase in US nominal yields has been driven by better-than-expected economic growth.
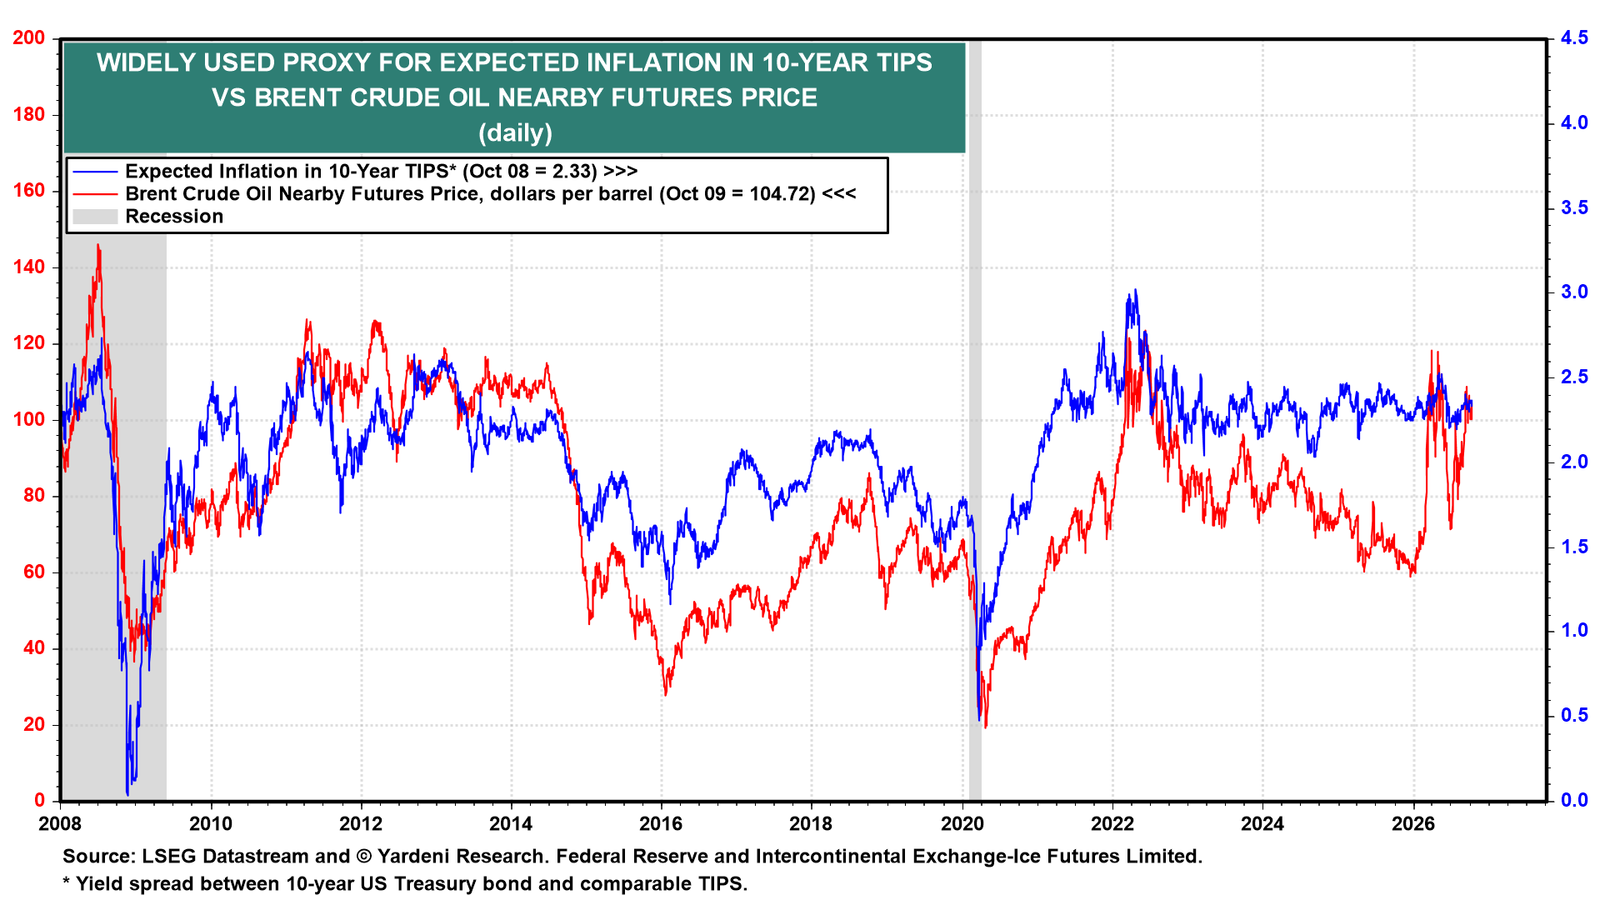
In the past, the expected inflation spread was highly correlated with the price of a barrel of crude oil (chart). That correlation has been weaker since 2023. Bond investors seem to believe that inflation will remain low in the 2.00%-2.50% y/y range over the rest of the Roaring 2020s into the Roaring 2030s. We agree.
Nevertheless, we can't rule out the possibility that another spike in oil prices, driven by a re-escalation of the war in the Middle East, won't push nominal bond yields higher. If so, that will likely be another buying opportunity.
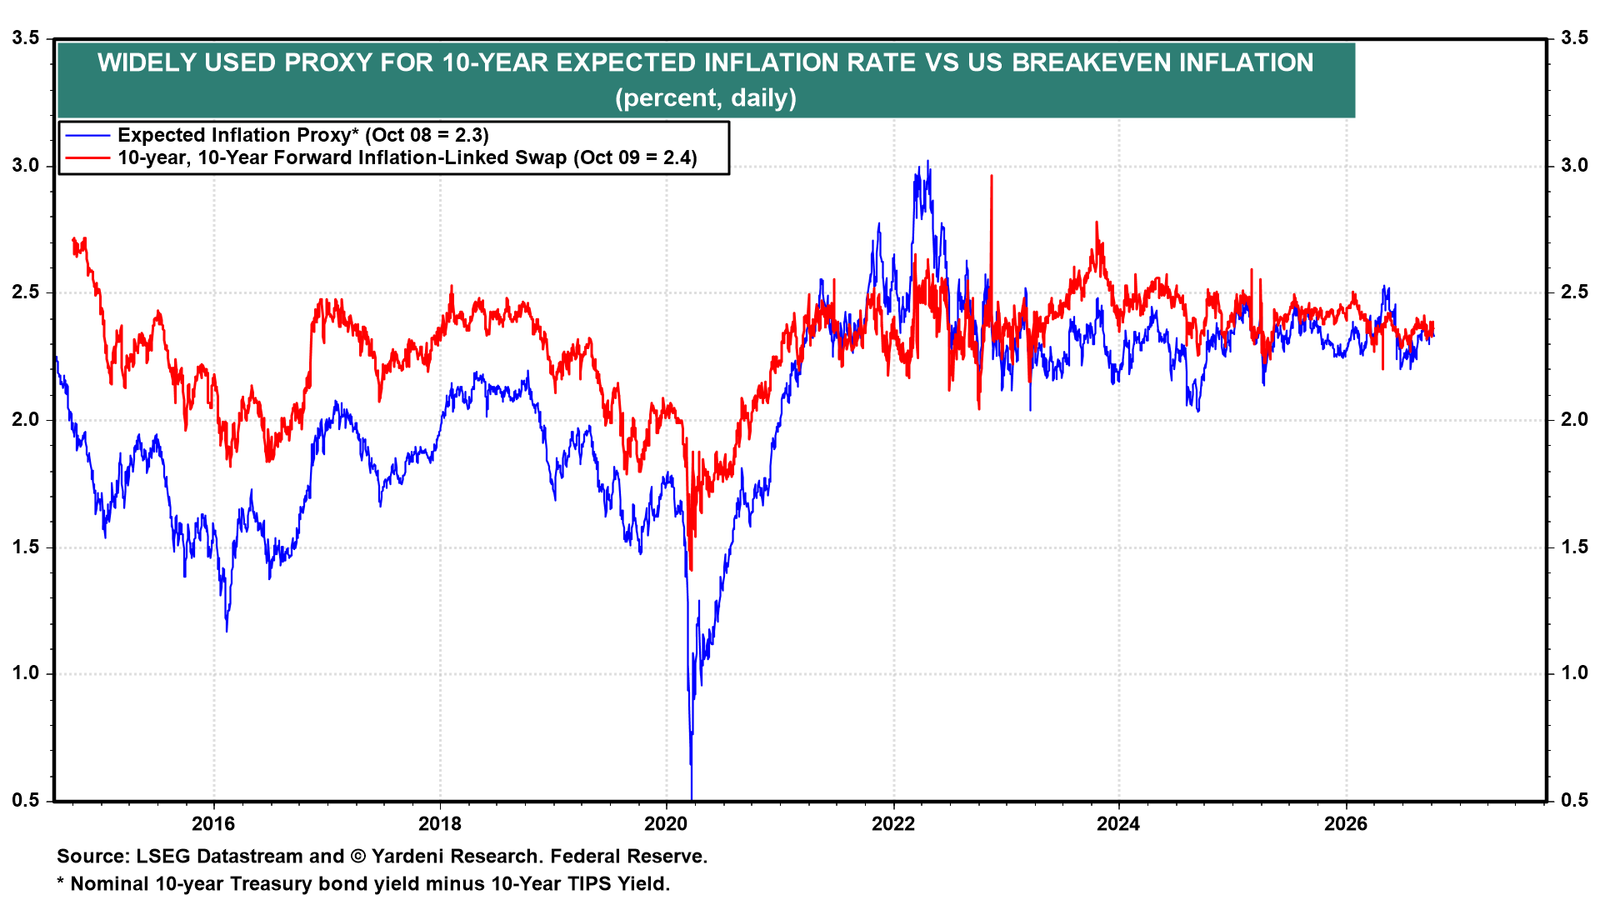
By the way, the expected inflation spread closely tracks the 10-year forward inflation-linked swap (chart).
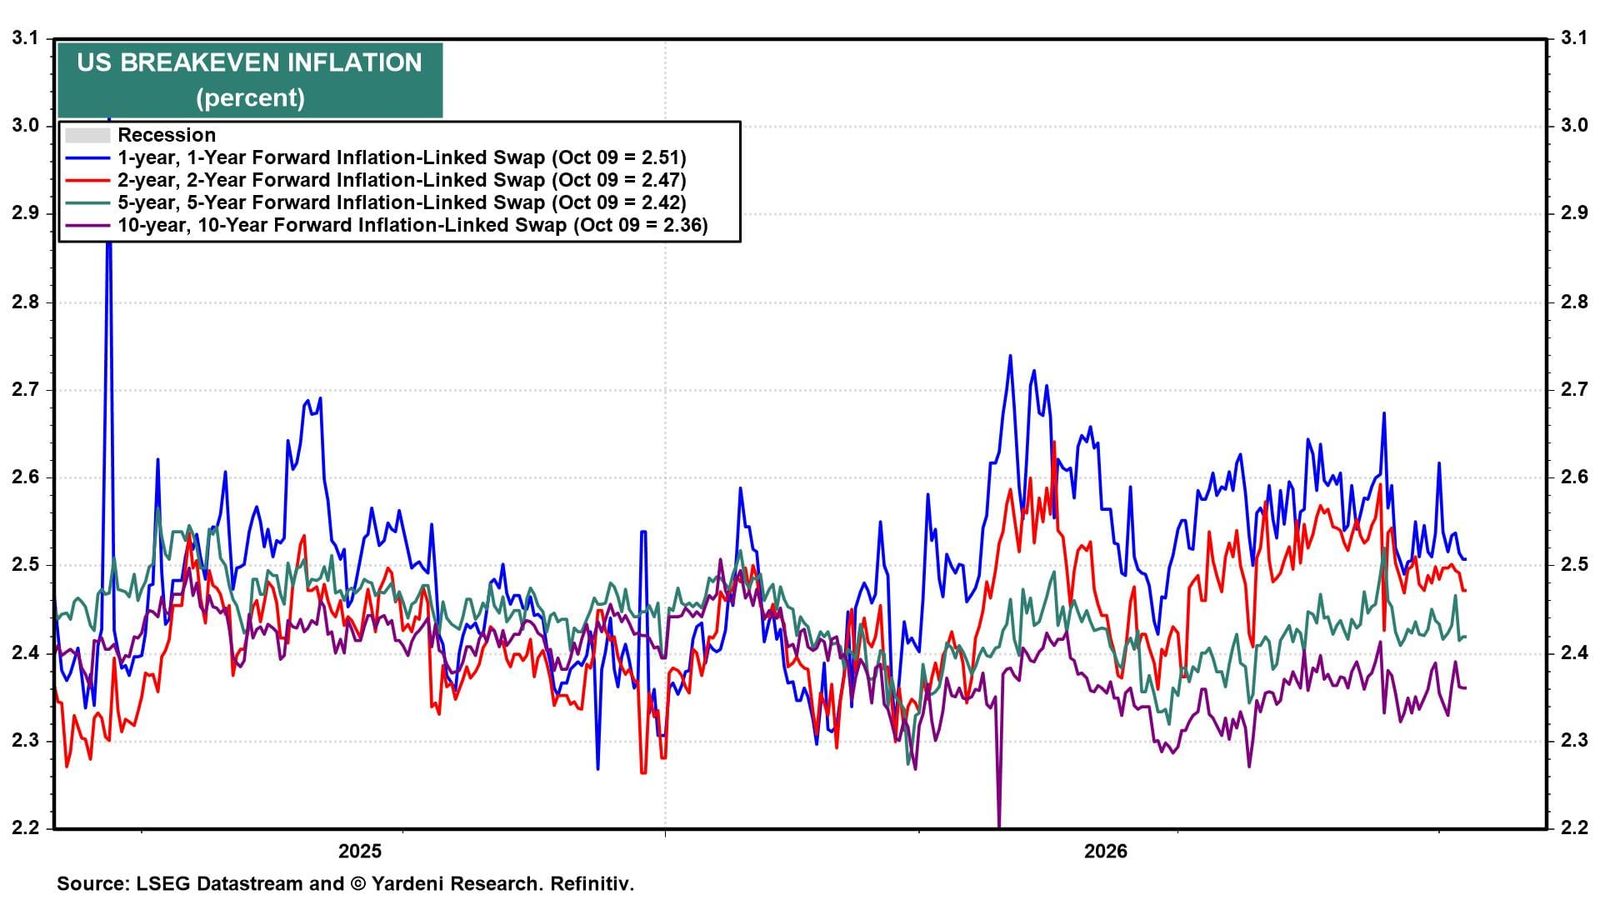
All major forward inflation-linked swaps are roughly in the 2.00%- 2.50% range (chart).
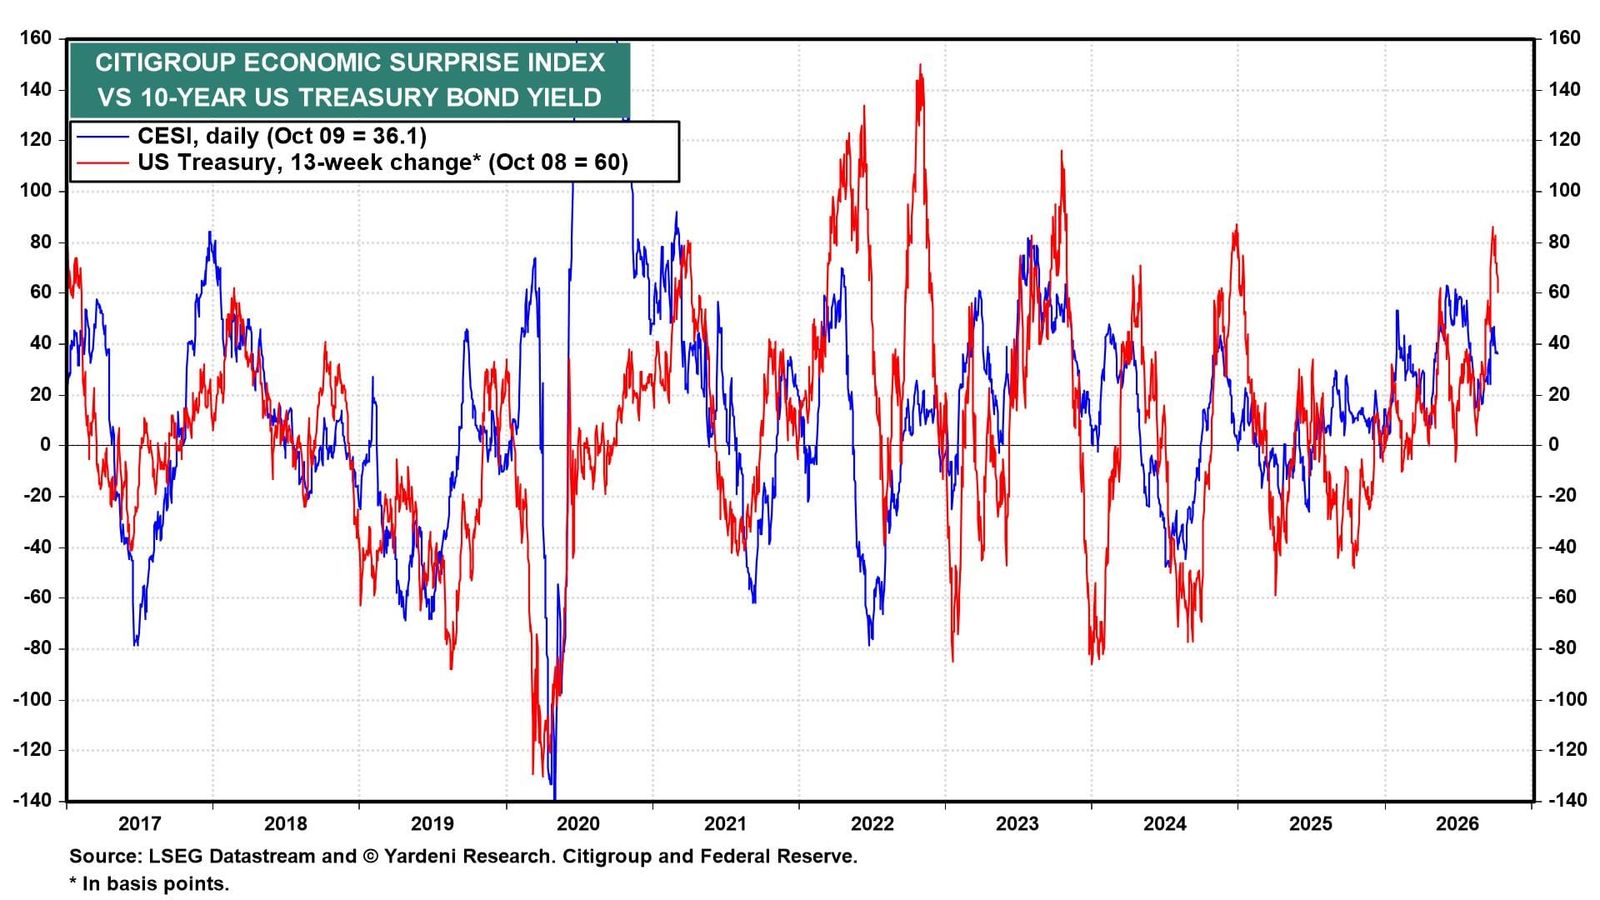
Meanwhile, the link between the 13-week change in the 10-year nominal yield and the Citigroup Economic Surprise Index suggests that the former's recent climb should abate (chart).
II. Stocks
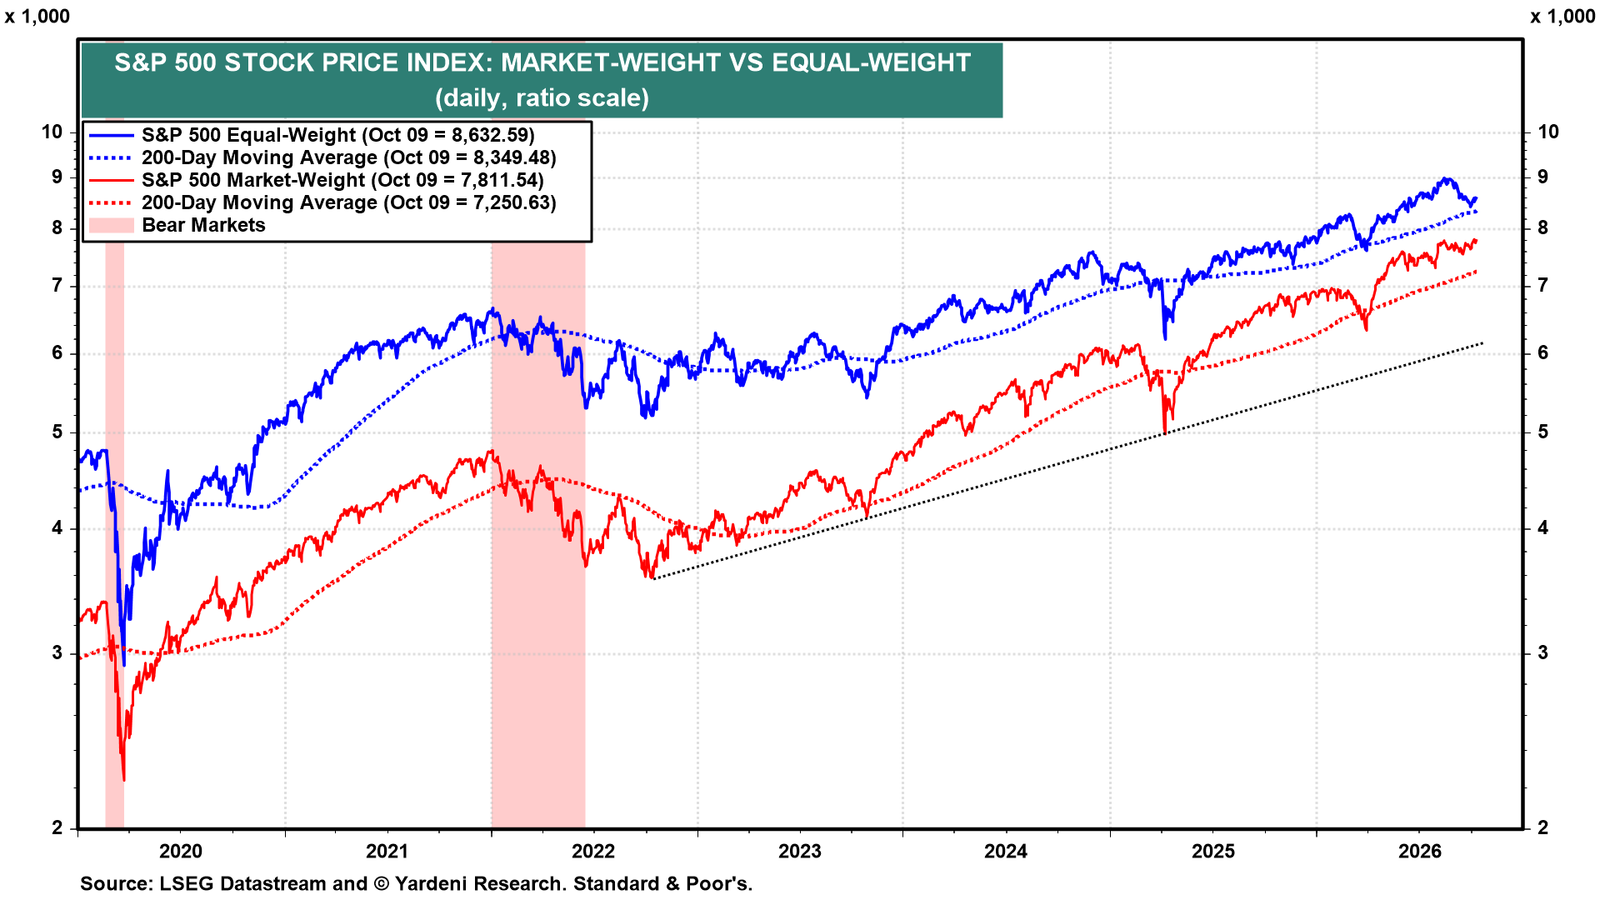
The steep rise in bond yields since mid-August has weighed on the S&P 500 equal-weight stock price index, while the market-weight index rose to record highs last week (chart). The former may be finding support at its 200-day moving average.
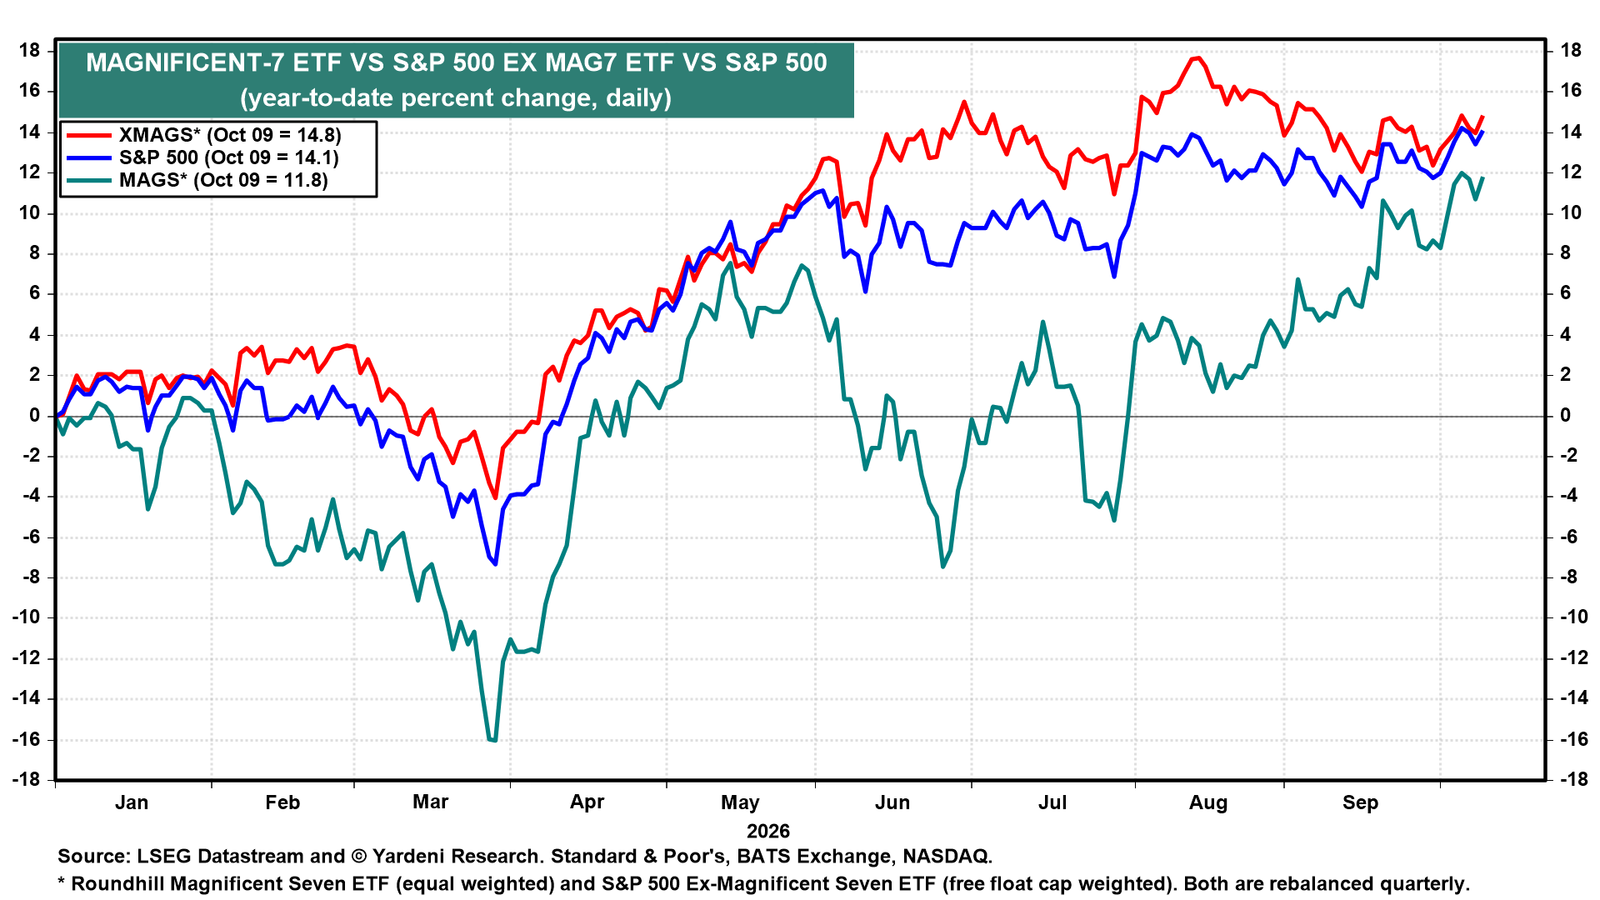
The gap between XMAGS's outperformance and MAGS's underperformance has narrowed since mid-August as bond yields jumped (chart). Over the past couple of weeks, they both did well.
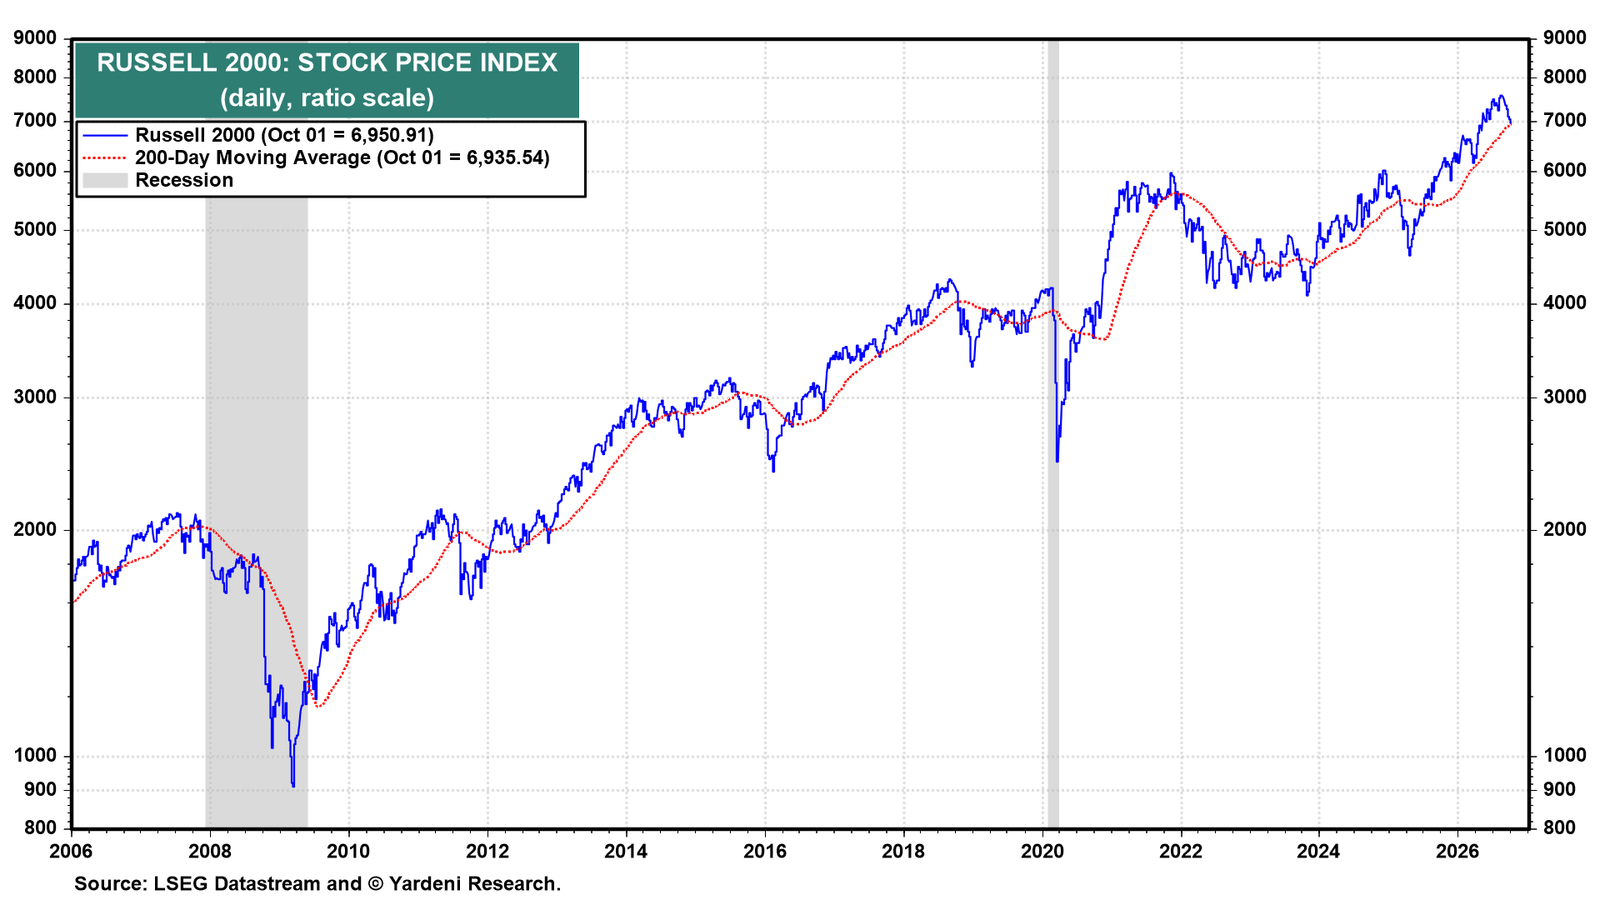
The Russell 2000 also dipped as bond yields soared since the late summer (chart). The index is back at its 200-day moving average, which should hold if US bond yields continue to stabilize.
III. Sentiment
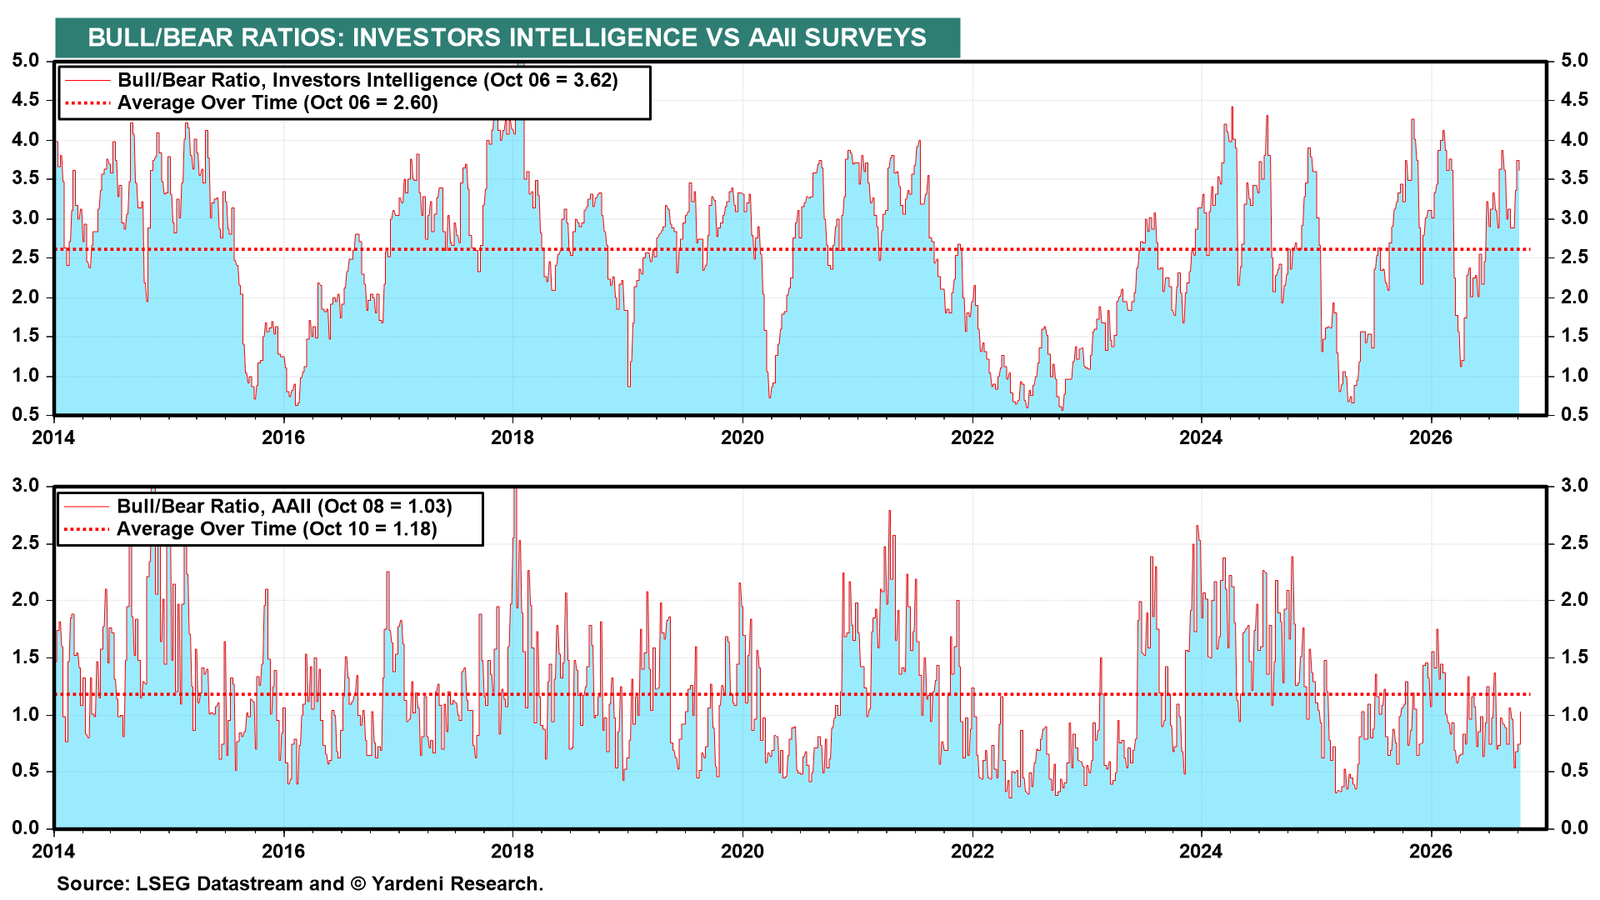
Investor sentiment turned more bullish last week according to the two bull-bear ratios we track. (chart). Like the front-page curse, they also tend to be contrary indicators. However, they aren't bullish enough to be bearish for stocks.